Stop losses — the four places a stop can legitimately go
Almost every guide tells you to put the stop “where the idea is wrong” and then stops talking, which is unhelpful the moment your chart offers you four different levels that all qualify. This lesson names the four, prices what it costs to choose between them, and derives the exact allowance that decides whether the tighter one is worth taking. It ends with an uncomfortable result: in a market with no direction, the tighter stop is shaken out at precisely the rate its better ratio can afford — to twelve decimal places.
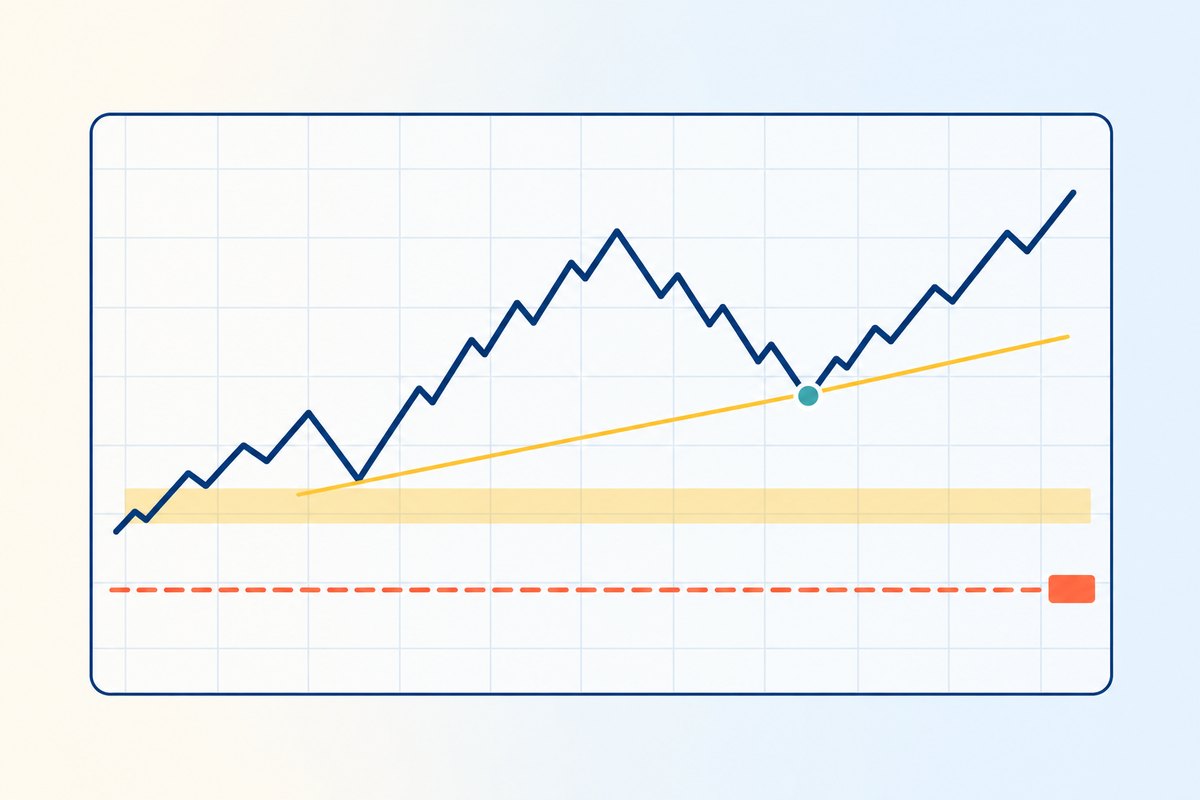
A schematic, not a measurement: the one thing it is drawn to show is the gap between the lower edge of the zone and the stop line. Every measured figure in this lesson is in the charts below.
KEY TAKEAWAYS
- Four anchors qualify, and they are all objects. A trendline, a swing low, a zone’s outer edge, an invalidation price. If you cannot point at the thing on the chart, you do not have a stop — you have a number.
- All four lose the same money. At 1% of a $20,000 account, every one of them costs $200 if it is hit. What changes is the position size — $13,380 down to $5,018 — and the win rate each one demands, 20.00% up to 40.00%.
- The wallet-derived stop fails on arithmetic, not on taste. A $34 stop at 1% risk builds a $20,071 position on a $20,000 account. It calls itself 1% risk while being a 1.00× account position.
- When two anchors disagree there is an exact allowance. The tighter one wins if it shakes you out of fewer than f* = 1 − (1 + Rwide) ÷ (1 + Rtight) of the trades that would have won. Your win rate cancels out of that inequality entirely.
- In a directionless market the allowance is spent exactly. The measured shake-out rate equals f* to twelve decimal places at every anchor. Placement generates nothing by itself — the whole value of a good level is the amount by which it beats random.
Where is a stop supposed to come from?
From the chart, and specifically from a thing on it. The course this site teaches from puts the stop at Step 2 of the entry routine, before the ratio is calculated at Step 3 and long before the position size is worked out. Lesson 42 put the same ordering more bluntly: the chart sets the stop, your account sets the risk, and the size is what falls out of the division. That leaves one question this site has not yet answered directly — which thing on the chart?
The test is a sentence you should be able to finish out loud: “I am in this trade because ___, and if price trades through ___ then that is no longer true.” The second blank is your anchor. Everything else in this lesson is about the fact that most charts offer several valid endings to that sentence at once, and they do not sit at the same price.
Not covered here, on purpose. Which timeframe the level should be read from is a separate question with a large answer, and the stop-loss glossary entry already handles it — including the table showing that copying the same idea’s stop from a 1-minute chart turns a 0.33× position into a 5.16× one. Read that first if the frame is your open question. This lesson assumes the frame is settled and asks what to anchor to inside it.
What are the four places a stop can legitimately go?
Four, and each corresponds to a different reason for being in the trade.
- The trendline or channel edge. You are long because the move is riding a rising line of higher lows. Break the line and the reason is gone. See Lesson 13.
- The swing low. You are long because the market is making higher highs and higher lows. Take out the last higher low and the sequence is broken. See Lesson 15.
- The outer edge of the zone. You are long because price is holding a support area. A zone has thickness, so the level that matters is its far side, not its near side or its middle. See Lesson 12.
- The invalidation price. You are long because of a pattern or a story, and there is a price at which that pattern has simply failed — usually below all of the above.
Here they are on one chart. The numbers are illustrative and hypothetical: an ETHUSDT four-hour idea, entry 3,412, target at the prior swing high 3,616, so a reward of $204 in every case.

Now the arithmetic, using 1% of a $20,000 account — $200 of risk — and the sizing identity from Lesson 42, size = risk ÷ stop distance.
| Anchor | Stop | Distance | Ratio | Break-even win rate | Position value | Loss if hit |
|---|---|---|---|---|---|---|
| Trendline | 3,361 | $51 | 4.00R | 20.00% | $13,380 | $200 |
| Swing low | 3,344 | $68 | 3.00R | 25.00% | $10,035 | $200 |
| Zone edge | 3,310 | $102 | 2.00R | 33.33% | $6,690 | $200 |
| Invalidation | 3,276 | $136 | 1.50R | 40.00% | $5,018 | $200 |
Read the last column first, because it is the column beginners assume varies. It does not. Moving from the tightest legitimate anchor to the widest divides the position by 2.67 and costs you nothing at all if the stop is hit. What it costs is the ratio — 4.00R down to 1.50R — and therefore the win rate the trade demands, which climbs from 20.00% to 40.00%. Break-even at 1 ÷ (1 + R) is Lesson 41’s arithmetic; this lesson only uses it.
The price of a wide stop is not money. It is a win rate. That single sentence removes most of the anxiety people feel about widening a stop, and replaces it with a question they can actually answer from their own trade history. It also has a mirror worth knowing: the price of a tight stop is a win rate too. And which of these four anchors you even get to choose from depends on when you click — while price is still falling, the swing low and the trendline do not exist yet. Lesson 51 prices that.
Why is “I’ll risk $200, so my stop goes here” not one of them?
Because it inverts the order of operations, and the inversion shows up as a number you cannot argue with. Take the same $200 and, instead of reading a level off the chart, place the stop wherever a comfortable-feeling $34 lands: 3,378. The ratio looks superb — 6.00R, a break-even win rate of just 14.29%. Then compute the position it implies.

Two things have gone wrong at once. The obvious one is leverage arriving through the back door. The subtle one matters more: 3,378 is a price nothing on the chart defends. There is no line there, no swing, no zone edge. Ordinary movement has no reason to respect it, which means the trade is now betting on noise rather than on the idea — the failure Lesson 32 described as a stop smaller than the noise it was supposed to survive.
The trading course library this site draws on puts the same warning in operational terms: never hang a stop on some vague area, and never move it there later either. A level either has a reason, or it is decoration.
The clearest historical illustration of the correct order is Nicolas Darvas, who traded American stocks from overseas dance tours in the late 1950s. He drew the range a stock was sitting in — his “box” — bought the breakout, and cabled a stop-loss order under the box in the same instruction. Because the stop was fixed by the box, the box also fixed how much he could buy: on a $10,000 account risking $100, a 4% box allows a $2,500 position and a 20% box allows only $500. Structure first, then stop, then size. Never the reverse.
When two anchors disagree, which one wins?
This is the question the guides skip, and it has an exact answer. Suppose the wider anchor gives you a win rate of p. The tighter anchor takes the same trades, minus the fraction f of would-be winners that noise between the two levels shakes out first, so its win rate is p(1 − f). Expectancy for either is p(1 + R) − 1. Set tight above wide:
(1 − f)(1 + Rtight) > (1 + Rwide)
f < f* = 1 − (1 + Rwide) ÷ (1 + Rtight)
Notice what vanished. p is on both sides and cancels. The threshold does not depend on how good your system is — a 30% win rate trader and a 55% win rate trader on the same two levels face the identical allowance. That is unusual enough in trading arithmetic to be worth sitting with for a moment.
| Tighter anchor ↓ vs wider → | Trendline 4.00R | Swing low 3.00R | Zone edge 2.00R | Invalidation 1.50R |
|---|---|---|---|---|
| 1% of capital 6.00R | 28.57% | 42.86% | 57.14% | 64.29% |
| Trendline 4.00R | — | 20.00% | 40.00% | 50.00% |
| Swing low 3.00R | — | — | 25.00% | 37.50% |
| Zone edge 2.00R | — | — | — | 16.67% |
Worked: the trendline stop against the zone-edge stop reads 40.00%. Taking the trendline is right if, across your own history of this setup, fewer than two in five of the trades that eventually reached the target dipped through the trendline on the way. That is a number you can count on your last fifty screenshots. It is not a feeling about how brave you are.
And notice the top row. The wallet-derived stop is allowed to shake you out of 64.29% of your winners before it loses to the invalidation stop — an enormous allowance, which is exactly why a 6.00R stop feels so attractive on the order ticket. The next section is about why that allowance is not the gift it appears to be.
What does a market with no direction pay for good stop placement?
Lesson 41 established the baseline: in a driftless market, the chance of reaching the target before the stop is s ÷ (s + T), which is the break-even rate itself, so every ratio pays exactly zero. Placement is the same statement seen from a different angle, and the angle is sharper.
Measure the widest legitimate anchor — the invalidation stop at 3,276 — as the reference, and ask: of the trades that end at the target, what share dipped through each tighter level first? For a driftless walk that has a closed form from the optional stopping theorem, f(L) = (T − E)(L − W) ÷ [(T − L)(E − W)], and it can be simulated independently.
Read that carefully, because it is the whole lesson compressed. The rate at which a tighter stop gets shaken out is exactly the allowance its better ratio can afford. Two quantities traders think of as unrelated — “how often will this level get poked?” and “how much better is the ratio?” — turn out to be one quantity seen twice. Under randomness, every placement in the table is worth precisely the same as every other.
Which yields the point of the four anchors. Choosing a level cannot create an edge. It can only inherit one. The entire value of putting a stop below the swing low rather than $34 below entry is the amount by which a real swing low actually holds better than a random price does — the amount by which freal falls below f*. A trendline, a swing low and a zone edge are candidates for that because market participants demonstrably act at them. 3,378 has no such claim, and never will. That is the arithmetic behind the rule, not a preference for chart-reading.
How far beyond the level should the stop actually sit?
Beyond, not on. A stop resting exactly at the swing low is killed by every wick that touches the swing low, and wicks touching the level is the normal behaviour of a level. So a buffer is required, and its cost is exactly computable.
| Buffer | In dollars | Stop | Distance | Ratio | Break-even | Must rescue more than |
|---|---|---|---|---|---|---|
| None | — | 3,344.00 | $68.00 | 3.00R | 25.00% | — |
| 0.10% | $3.41 | 3,340.59 | $71.41 | 2.86R | 25.93% | 3.58% of winners |
| 0.25% | $8.53 | 3,335.47 | $76.53 | 2.67R | 27.28% | 8.36% of winners |
| 0.50% | $17.06 | 3,326.94 | $85.06 | 2.40R | 29.43% | 15.04% of winners |
| 1.00% | $34.12 | 3,309.88 | $102.12 | 2.00R | 33.36% | 25.06% of winners |
The last column is f* applied to the buffer, and it turns a vague instruction into a testable one. A quarter-percent buffer costs 2.28 points of required win rate, and pays for itself only if it rescues more than one winner in twelve. A full-percent buffer has to rescue one in four — and at that point it has quietly turned the swing-low trade into the zone-edge trade, since 3,309.88 is essentially the zone edge at 3,310.
What this table does not tell you. Which buffer is right. That depends on how deep wicks through levels actually run in your market on your timeframe, and this lesson has not measured that — it has priced the choice, not made it. Measuring it on your own chart is twenty minutes of work and is the single most useful thing you can take from this page.
PRACTICE CORNER
Twenty minutes and your last fifty trades turn the whole lesson into two numbers you own. One: open a setup you are considering and mark all four anchors on it — trendline, swing low, zone edge, invalidation. Most charts will give you at least three. Two: write the distance and the ratio next to each, then the break-even rate 1 ÷ (1 + R). Three: pick the two you are actually torn between and compute the allowance, f* = 1 − (1 + Rwide) ÷ (1 + Rtight). Four: now go backwards through your history of this setup and count: of the trades that eventually reached target, how many first traded through the tighter level? If that fraction is below your f*, take the tighter anchor; if it is above, take the wider one and stop arguing with yourself about it. Five: while you are counting, record how far the deepest wick ran past the level. That distribution is your buffer, and it is the number the table above deliberately refuses to guess for you.
Step one needs a platform whose drawing tools let you place a horizontal level at a price you type rather than one you drag, and step four needs an order history you can actually read back. These are the three exchanges this site uses for its own worked examples.
We may earn a commission if you open an account through these links, at no cost to you. It does not change what is written above.
Where does the course method put the stop?
The chart and radar on this site place stops the way this lesson says, with the buffer measured in ATR of the frame one step up, because that is the frame whose wicks will test the level:
- Pullback entry (riding the 4h wave, entered on the 1h): under the low of the 1h pullback (the last 24 one-hour candles), then a buffer of a quarter of the 4h ATR on BTC, ETH, SOL and BNB. On altcoins the buffer is three quarters of the 4h ATR — their wicks run through tight stops far more often (in the 12-month test the wider cushion cut altcoin stop-outs from 83% to 63% of trades while keeping the average result).
- Early entry (the 1h pushing inside a strong trend before the 4h has turned): the same 1h stop — the low of the 1h pullback plus the 4h-ATR buffer, because the trade is meant to ride the 4h wave. Nothing smaller than the 1h is read for the stop: a stop under a 15-minute swing gets hit by noise and costs the position. The trade needs room: at least three times the risk to the next 12h resistance, unless the wall looks breakable (break score 4 of 5).
- After the trade works: once price is three times the risk away from the entry, the stop moves to the entry price. Capital first; the wave can still run to the fuel exit.
Three years of the same rules on BTC, ETH, SOL and BNB, run on candles that existed at the time: two positive years and one losing year, with losing streaks of 7–15 trades. The stop is what makes a losing streak survivable; it is not what makes the method profitable. See how the rules did.
What do people get wrong about this?
Turning a risk percentage into a price. One to two percent is a rule about money, and money is the last quantity in the chain, not the first. Converting it directly into a stop level skips both of the steps that were supposed to happen in between.
Putting the stop at the level instead of beyond it. A level that gets touched is a level doing its job. A stop that gets touched is a trade that is over. Those two events should not be the same event.
Anchoring to the near edge of a zone. A support zone has width because participants act across a range, not at a point. The near edge is inside the mechanism you are relying on; only the far edge is outside it.
Reading the allowance table as a promise. f* says what the tighter anchor is permitted to cost. It says nothing about what it will cost — that half of the comparison has to come from your own records.
Widening the stop after entry because it is about to be hit. That converts a known, sized loss into an unknown one, and it is the one move that breaks every piece of arithmetic on this page at the same time.
When is this lesson wrong?
When the widest legitimate anchor still is not enough. If the invalidation stop gives 1.50R, it demands a 40.00% win rate. A system that wins 38% cannot take that trade — and the fix is not to widen the stop further, which only lowers R again. The fix is to skip it. A setup where the only honest stop is too far away is information, not an obstacle.
When the market gaps. The directionless result assumes price moves in small continuous steps. Real markets jump, and a stop filled worse than its level makes the true baseline negative rather than zero. Treat the equality above as a ceiling on what randomness gives you.
When costs are large relative to the stop. Lesson 41 showed that fees eat 2c ÷ s of the risk budget, which punishes the tight anchor hardest. Nothing in the f* derivation includes costs, so on very tight stops the allowance is optimistic.
When there is no structure to anchor to at all. In a weak or ranging market a chart can genuinely fail to offer a level worth using. The right response is to trade a smaller timeframe where structure does exist, or not to trade — not to invent an anchor.
When you have fewer than a hundred trades on one rule. Then freal is not yet a quantity you can estimate, and the table can only rank options against each other rather than settle them.
Frequently asked questions
Where exactly should I place my stop loss?
Just beyond an object on the chart that has to break before your reason for being in the trade stops being true. In practice that is one of four things: the trendline or channel edge the move is riding, the swing low the higher-high sequence depends on, the outer edge of the support or resistance zone you bought at, or the price at which the whole idea is simply wrong. Which of the four you use is a judgement call about which object your entry actually depended on — but the level itself is read off the chart, never chosen from the amount you feel comfortable losing.
Is a 1% or 2% stop loss a good rule?
One to two percent is a rule about risk per trade, not about where the stop goes, and confusing the two is expensive. The percentage sets the money at stake; the chart sets the distance; the position size is what falls out of dividing one by the other. Turn the percentage into a price and you get a level with nothing behind it. On a $20,000 account risking 1%, a stop $34 below a $3,412 entry gives a position worth $20,071 — more than the whole account — while the same $200 of risk behind a $68 chart-derived stop gives $10,035.
Should I use a tight stop or a wide stop?
There is an exact condition. A tighter anchor beats a wider one if it shakes you out of fewer than f* = 1 − (1 + Rwide) ÷ (1 + Rtight) of the trades that would otherwise have reached the target. Between a 4.00R trendline stop and a 2.00R zone stop that allowance is 40.00%; between a 3.00R swing-low stop and a 1.50R invalidation stop it is 37.50%. The formula does not contain your win rate — it cancels out — so the answer depends only on the two ratios and on how well the tighter level actually holds.
How far below support should a stop go?
Far enough that an ordinary wick through the level does not close the trade, and the cost of that buffer is measurable. On a $3,412 entry with the stop anchored to a swing low at 3,344, a buffer of 0.25% of price is $8.53: it widens the stop from $68 to $76.53, drops the ratio from 3.00R to 2.67R and raises the break-even win rate by 2.28 points. That buffer is worth paying for only if it rescues more than 8.36% of the trades that would otherwise have won — roughly one winner in twelve. How often a buffer of a given size actually does that is an empirical question about your market and your timeframe, not something a formula can answer.
Next in Stage 9: scaling in and scaling out — entering and exiting in tranches instead of all at once, and what that does to the average price the stop is measured from.