Risk-to-reward — the ratio that lets a 40% win rate pay
Everyone has seen the table showing that 1:3 pays at a 25% win rate. Almost nobody has seen the second half of the sentence — that the ratio and the win rate are attached to each other, so buying a bigger ratio by pulling the stop closer sells some win rate to pay for it. This lesson prices that exchange exactly, shows what one more unit of R is really worth, and finishes with the uncomfortable result that in a market going nowhere every ratio pays exactly zero.
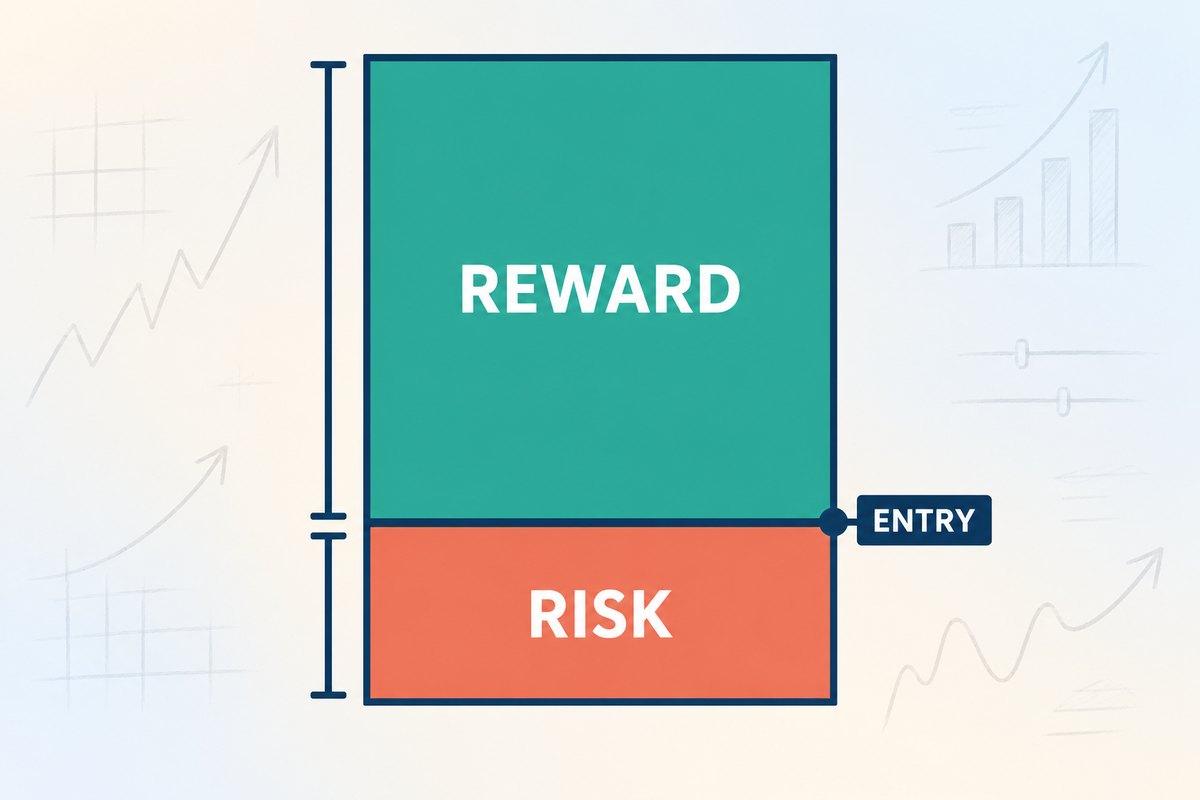
The tool, not a chart. There is no price scale here and nothing in this picture is measured — it is a schematic of the two boxes, not a claim about any particular ratio. Every measured figure in this lesson is in the charts below.
KEY TAKEAWAYS
- A 40% win rate breaks even at exactly 1:1.5. Below that it loses however well the entries feel; at 1:3 the same 40% earns +0.60R per trade. The course sentence that a 40% win rate “can leave you profitable” is true only above that hinge.
- The ratio is a readout, not a setting. Entry and stop exist first; R is what is left when you divide. The honest way to change it is to change which timeframe your stop answers to — and that changes how often it is touched.
- Each extra R buys less than the last. Starting from 40% at 3.00R, the step to 4R lets your win rate fall 8.00 points and still break even on the swap; the step from 9R to 10R buys only 1.45. The first step is worth 5.50× the last.
- In a market with no direction, every ratio pays exactly zero. The chance of reaching the target before the stop is s ÷ (s + T), which is the break-even rate itself. The ratio generates nothing on its own; the whole edge has to come from the setup.
- Costs punish the tight stop hardest. The share of your risk budget eaten by fees, 2c ÷ s, is also the percentage by which your win rate must beat the coin-flip baseline: 10% at a $660 stop, 30% at a $220 one.
What does risk-to-reward actually measure?
Two distances, both measured from your entry: down to the stop, and up to the target. Divide the second by the first and you have the ratio. Buy at $66,000 with a stop at $65,340 and a target at $67,980 and you are risking $660 to make $1,980, which is 1:3, or a 3.00R trade — one R being the entry-to-stop distance, the unit everything else on this site is quoted in.
The course this site teaches from is precise about where the calculation sits. It appears as Step 3 of the entry routine: “Step 3: Reward / Risk = ?”. Steps one and two produce the entry and the stop. The ratio is step three because it cannot exist until they do. That ordering is not a detail — it is the whole disagreement between this lesson and the advice you have read elsewhere.
If the basics are new to you — what “1:3” means, why writing it backwards empties accounts, the standard break-even table — the risk/reward glossary entry covers them in five minutes and this lesson assumes them from here.

Why can a 40% win rate pay at all, and where is the hinge?
Because a losing trade costs 1R and a winning one pays R, so the sign of the whole enterprise is decided by p × R − (1 − p), where p is the share of trades that win. Set that to zero and the break-even win rate falls out as 1 ÷ (1 + R) — the identity Lesson 42 computed when it showed a 2R trade breaking even at 33.3%.
The short version of this table is in the glossary entry; the rows below extend it to 1:0.5 and 1:10, and add what a 40% win rate earns at each. Our own Part 10 summary says it plainly: “Once you hold to the reward-to-risk ratio you set, even a 40% win rate can leave you profitable in the end.” That sentence is true, and it has a threshold hiding inside it. Here is the full table, with what a 40% win rate earns at each ratio in the last column.
| Risk : reward | Break-even win rate | Result at a 40% win rate |
|---|---|---|
| 1 : 0.5 | 66.67% | −0.40R per trade |
| 1 : 1 | 50.00% | −0.20R per trade |
| 1 : 1.5 | 40.00% | 0.00R — the hinge |
| 1 : 2 | 33.33% | +0.20R per trade |
| 1 : 3 | 25.00% | +0.60R per trade |
| 1 : 4 | 20.00% | +1.00R per trade |
| 1 : 5 | 16.67% | +1.40R per trade |
| 1 : 6 | 14.29% | +1.80R per trade |
| 1 : 8 | 11.11% | +2.60R per trade |
| 1 : 10 | 9.09% | +3.40R per trade |
The row that matters is the one nobody prints. A 40% win rate breaks even at exactly 1:1.5, because 40% is exactly 1 ÷ (1 + 1.5). Everything below that line loses money at a win rate the course explicitly asks you to maintain. So the reassuring sentence is not a general licence — it is a conditional one, and the condition is a ratio above 1.5.
The 1:2 row was computed in Lesson 39 as +0.20R, and it is worth noticing how small that is: a trader at 40% and 1:2 is running on a fifth of a risk unit per trade, which one bad fee schedule can erase. The 3.00R setup used throughout this lesson earns +0.60R, three times as much, from the same 40%.
Every percentage in this lesson is a threshold, never a forecast. We do not publish measured hit rates for any method, here or anywhere on the site. “25.00%” means a 1:3 trade needs better than 25% to make money; it says nothing about whether any particular setup achieves it.
The handwritten journal page reproduced in our Part 1, dated 21 May 2023, aims lower and further out: “I understand that even a consistently successful trader wins only about 30-35% of their trades, and that they hold a risk-to-reward ratio near 3:1.” Run those numbers and 30% at 3R gives +0.20R, 35% gives +0.40R. Both are positive, both are modest, and neither has any room in it for a ratio that turns out to be smaller than advertised.
Where does the ratio actually come from?
From the chart, in this order: you find a target the market has already respected, you find a level below which your idea is simply wrong, and the ratio is whatever falls out. That is why the course puts it at step three. Nothing about the number is a preference.
But there is one legitimate way to change it, and the course states it as an entry rule: “Find the stop on a lower frame to get the best R:R.” Drop from the four-hour chart to the one-hour, and the swing low you are hiding behind is nearer. Drop again to the fifteen-minute and it is nearer still. Same entry, same target, three different stops — and three different ratios.
| Stop sits under… | Stop price | Risk | Ratio | Break-even win rate |
|---|---|---|---|---|
| the 4H swing low | $65,340 | $660 | 3.00R | 25.00% |
| the 1H swing low | $65,560 | $440 | 4.50R | 18.18% |
| the 15m swing low | $65,780 | $220 | 9.00R | 10.00% |
Read that table the way a sales page would and it is an invitation: same trade, and 1:9 is available for free. It is not free, and the reason is in the first column rather than the last. Each of those stops is a real level on a real chart — none of them is invented — but each one belongs to a different timeframe, and a stop only means anything against the size of the moves on the frame that produced it.

How much ordinary movement is there? Take an average bar's high-to-low range as the yardstick. On a random-walk baseline — the fairest possible market, no direction either way — that range grows with the square root of the timeframe, so a frame four times longer has bars about twice as tall. We checked the law rather than assumed it: over 40,000 simulated bars per frame the ratios came out 2.09 and 2.04 against a theoretical 2.00, and refining the grid fourfold moved them to 2.04 and 2.03, so the excess is the coarseness of the grid rather than a broken rule. Note what the law says: it is about a factor of four in the timeframe. One hour to thirty minutes is a factor of two, and shrinks the bar by about 1.41, not 2.
The law gives ratios, not dollars, so the dollars have to be stated as an assumption. For this illustration take an average four-hour bar as $520 — an assumption about this hypothetical chart, not a measurement of bitcoin — which makes the hourly bar $260 and the fifteen-minute bar $130.
Now the three stops stop looking like one sensible choice and two aggressive ones. The $660 stop is 1.27 four-hour bars. The $440 stop is 1.69 one-hour bars. The $220 stop is 1.69 fifteen-minute bars. Each clears the noise of its own frame by much the same margin, so each is the same kind of decision taken on a different chart. That does not make them the same trade — section 9 is blunt about why not.
Which also puts a ceiling on R that has nothing to do with ambition. If a stop must clear at least one average bar of its frame, then the largest ratio a $1,980 target can support is 3.81R on the four-hour, 7.62R on the hourly and 15.23R on the fifteen-minute. Lesson 32 derived this ceiling — target distance divided by average bar range — for a single pattern on a single chart. The addition here is that the ceiling moves with the frame, and by a known factor: quarter the timeframe, halve the bar, double the ceiling. That is the arithmetic behind the course's entry rule, and it is the only honest way to read it.
So what does a bigger ratio actually cost?
Win rate. Not as a moral point — as a swap you can price. A stop at $220 is a stop that ordinary fifteen-minute movement reaches far more often than a stop at $660, so the same idea, entered the same way, wins less often when you protect it more tightly. The two sides of p × R − (1 − p) are not independent variables. Pull one up and the other comes down.
The course knows this, though it never joins the two halves. Its entry rule sends you to a lower frame for a better ratio; its stop-management material warns that the tighter stop is only for a trader willing to be knocked out once or twice and re-enter while the higher-frame move is still intact. That willingness is the price, and it can be written down.
Hold your expectancy constant. If you were running a 40% win rate at 3.00R and you tighten to R₂, the win rate you can afford to fall to is
p₂ = p₁ × (1 + R₁) ÷ (1 + R₂)
and the number of percentage points you may surrender is p₁(R₂ − R₁) ÷ (1 + R₂). Call it the win-rate allowance. It is exact, and it is the only figure that makes a tighter stop a decision rather than a preference.
| Tightening to… | Stop must come in to | Win rate may fall to | Allowance |
|---|---|---|---|
| 4.00R | $495 | 32.00% | 8.00 points |
| 4.50R (the 1H stop) | $440 | 29.09% | 10.91 points |
| 5.00R | $396 | 26.67% | 13.33 points |
| 6.00R | $330 | 22.86% | 17.14 points |
| 8.00R | $247.50 | 17.78% | 22.22 points |
| 9.00R (the 15m stop) | $220 | 16.00% | 24.00 points |
| 10.00R | $198 | 14.55% | 25.45 points |
So moving your stop from the four-hour low to the fifteen-minute low is worth doing if — and only if — it costs you fewer than 24 percentage points of win rate. That is a real question with a real answer, and it is answerable from your own trade history rather than from an opinion about what ratio is professional.
Notice also what the allowance is bounded by. It can never exceed p₁ itself, because you cannot surrender more win rate than you have. At 40% starting out, no ratio in the world buys more than 40 points of room, and the last few points cost almost the entire remaining stop distance to obtain.
What is one more unit of R actually worth?
Much less than the one before it, and the decline is steep. Take the allowance formula and ask what a single step of +1R buys at each level. It works out to p₁(1 + R₁) ÷ ((1 + R₂)(2 + R₂)) — a quantity that falls away roughly with the square of the ratio.
Read the two ends. Going from 3R to 4R buys 8.00 points of slack and costs $165 of stop distance. Going from 9R to 10R buys 1.45 points and costs $22. The dollar cost gets smaller, which is exactly why it feels tempting — but the market's noise did not get smaller with it. The dollar cost gets smaller, which is exactly why it feels tempting — but the noise does not shrink with it, and the frame you are answering to keeps changing underneath. A $198 stop is 1.52 fifteen-minute bars, so it is still a legal stop on that chart; measured against the four-hour bar the idea started on, it is 0.38 of one. Somebody who set out to swing a four-hour move and finished holding a 10R ticket has changed timeframes twice without deciding to. Push past the ceiling of the smallest frame you are actually willing to watch and the stop does fall inside ordinary movement — the state Lesson 32 named, a stop smaller than the noise it was supposed to survive, and Lesson 35 called a number you cannot hold.
This is where the material we teach from and the folk wisdom part company. The common advice is to demand a minimum ratio — 1:3, or higher — and pass on anything below it. Our own stop-management notes take the opposite line: a 1:2 or 1:3 on a nearby target is worth taking when the higher timeframe still has room to run, and demanding 1:8 to 1:10 on every trade is greed. The chart above is why that is arithmetic rather than temperament: past about 5R each further step buys under four points of slack, while the stop keeps marching down towards the size of an ordinary bar.
Notice the word demanding, because the distinction it carries is the whole point. Taking a 9R when a chart genuinely offers one — as the fifteen-minute stop in section 3 does — costs nothing: the ratio was there to be read. Requiring 9R before you will place any trade is a different act. It makes you refuse the setups your own frame produces, and then go looking for the stop that manufactures the number. The first is reading. The second is bargaining.
Which is also what a minimum like 1:2 is really doing. It is not a magic number; it is a rough proxy for “the target is far enough from the stop that the trade survives a normal bar and still has somewhere to go.” The proxy is fine. Knowing what it stands for is better, because it tells you when to relax it and when it is not nearly strict enough.
What does a market with no direction pay at each ratio?
Exactly nothing, at every ratio, and the proof is short enough to check. Suppose price moves in small steps up or down with equal likelihood — no trend, no edge, the fairest coin a market can be. Start at the entry with a stop s below and a target T above. The probability of touching the target first is s ÷ (s + T).
Look at what that is. s ÷ (s + T) is the same thing as 1 ÷ (1 + R). The chance of winning in a directionless market is precisely the break-even win rate. Every ratio, from 1:1 to 1:20, sits exactly on its own break-even line and pays zero. We checked it two ways rather than one: by solving the walk exactly on a $2 price grid — which every one of these three stops divides into, so there is no rounding anywhere — and again by simulating 30,000 paths.
| Stop | Ratio | Break-even win rate | Exact, no trend | Simulated, no trend |
|---|---|---|---|---|
| $660 | 3.00R | 25.00% | 25.00% | 24.95% |
| $440 | 4.50R | 18.18% | 18.18% | 18.28% |
| $220 | 9.00R | 10.00% | 10.00% | 10.01% |
The middle column is not an estimate. It is the solution of the walk, and it lands on the break-even column to every digit shown; the simulation is there only to confirm nothing was mis-stated.
This is the most useful thing in the lesson, and it is worth sitting with. A trader running 1:9 setups and winning one in ten is not doing badly, and a trader running 1:3 and winning one in four is not doing well. Both are producing exactly the numbers a coin produces. The ratio is not a source of profit. It converts a given edge into money, and it decides how the equity curve feels along the way, but it cannot manufacture the edge. Everything that makes a system worth running — the reason the target is more likely than the stop — comes from the setup, and this site spends stages 2 through 8 on precisely that question.
It also explains the discipline our own material insists on and most readers skip: “Enter only with a pattern; no pattern, no entry.” Without the pattern, s ÷ (s + T) is what you get, whatever the ratio says.
What do fees do to the ratio?
They raise the bar, and they raise it most for the trade that looks most attractive. Costs cut the reward and add to the risk at the same time. With a one-way cost c on each side, the break-even win rate becomes (s + 2c) ÷ (s + T), so the penalty in percentage points is
Δp* = 2c ÷ (s + T)
— which depends only on the whole stop-to-target span, not on where the entry sits inside it. Assume a cost of 0.05% a side, the same working assumption Lesson 40 uses. On a $66,000 entry that is $33 each way, $66 the round trip.
| Stop | Ratio | Break-even, before costs | Break-even, after costs | Penalty |
|---|---|---|---|---|
| $660 | 3.00R | 25.00% | 27.50% | +2.50 points |
| $440 | 4.50R | 18.18% | 20.91% | +2.73 points |
| $220 | 9.00R | 10.00% | 13.00% | +3.00 points |
The tighter stop pays a bigger penalty in absolute points, which is already backwards from intuition. But divide the penalty by the requirement it is added to and something exact appears:
Δp* ÷ p* = 2c ÷ s
Target cancels out entirely. The relative amount by which your win rate has to beat the coin-flip baseline is the round-trip cost divided by the stop distance, and nothing else. At the four-hour stop that is 10.0%. At the one-hour stop, 15.0%. At the fifteen-minute stop, 30.0%. The trader showing off a 1:9 setup has to out-perform a fair coin by three times as much as the one at 1:3.
And 2c ÷ s is not a new quantity. It is the identical expression Lesson 40 derived as the share of your risk budget that costs consume before the market has an opinion. One number, two readings: how much of your budget the fees eat, and how far above chance your judgement has to be. They are the same thing seen from two sides — the fee is a fixed bite out of a budget whose size is the stop, so of course it costs proportionally more when the stop is small.
One simplification, stated. The worked cost above charges 0.05% of the entry price on both legs. A real exit at the target is charged on the exit price, which is larger, so the figures here are a shade generous. The identity 2c ÷ s is exact for whatever c you actually pay.
What this looks like at industrial scale. The most profitable trading operation ever measured ran on a hit rate of about 50.75% — barely better than a coin. It worked because its cost per trade was close to nothing, so 2c ÷ s was close to nothing and almost all of that thin edge survived. The profile of Jim Simons and Renaissance Technologies runs this same identity on a $2,000 retail account and reaches the opposite conclusion: at a 0.10% taker fee with a 1% stop, the round trip eats 20% of the risk budget, and that identical 50.75% edge then needs a 60% win rate just to break even. Same arithmetic, different cost base, opposite answer about how often you should be trading.
PRACTICE CORNER
Half an hour on your own chart, and you leave with your ceiling rather than someone else's minimum. One: open a setup you are actually considering and mark the target at a level the market has already reacted to — a prior swing high or a tested support or resistance zone, and be wary of a round number that nothing has actually happened at. Two: mark the stop on the frame you intend to manage the trade on, and write the ratio down. Three: measure that frame's average bar range over the last twenty bars and divide the target distance by it. That is your ceiling on R for this setup; if the ratio you wrote down is above it, you are not being ambitious, you are using a stop the frame cannot support. Four: if you want a bigger ratio, drop one frame, take the nearer swing low, and compute the allowance — p₁(R₂ − R₁) ÷ (1 + R₂) — before you decide. Five: divide your round-trip cost by the stop distance and read the answer as the percentage by which your judgement has to beat a coin. Do it for the wide stop and for the tight one and put the two side by side: in the worked example the figure triples, from 10% to 30%, and that gap is the part of a tighter stop nobody quotes you.
Step three needs a platform that will show you a bar's range without arithmetic, and steps two and four need an exchange whose order ticket lets you place a stop at a price rather than a percentage — otherwise the frame you chose gets rounded away at the moment of entry. These are the three exchanges this site uses for its own worked examples.
We may earn a commission if you open an account through these links, at no cost to you. It does not change what is written above.
Where the stop itself should be anchored — and the exact allowance that decides between two candidate levels — is Lesson 43.
What do people get wrong about this?
Treating the ratio as an input. It is the answer to a division, and the two numbers going into it come from the chart. A trader who decides on 1:4 first will find a way to get there, and the way is always to move the stop or the target somewhere it does not belong.
Comparing ratios across timeframes as if they were the same measurement. A 9R on a fifteen-minute stop and a 3R on a four-hour stop are not two grades of the same thing. They are two different trades, with different holding periods, different numbers of chances to be knocked out, and different win rates. Comparing the ratios alone is comparing the numerators of two fractions with different denominators.
Reading the “result at 40%” column as a menu. That column holds the win rate fixed while the ratio changes, which is exactly the thing that cannot happen in the market. It is there to show the shape of the arithmetic, not to recommend the bottom row.
Believing the ratio supplies the edge. Section 6 is the answer, and it is worth repeating because it is counterintuitive: a coin delivers the break-even win rate at every ratio you choose. Nothing in the ratio wins.
Sizing off the ratio rather than off the risk. The ratio has no role in how big the position is; that is a separate calculation, and Lesson 42 is where it lives.
Forgetting that a late entry rewrites the ratio. The stop stays on its level, so paying a higher price shortens the reward and lengthens the risk at the same time — a 4.00 becomes a 1.21 on a chase of only 3%, which is why every setup has a price above which it is no longer worth taking. Lesson 45 works that price out.
Improving the ratio after entry by moving the stop away. Our Part 5 material lists this among the emotional habits, and names the emotion: “Moving the stop loss further out than planned because you want to give price a little more room”. The ratio on your screen improves; the trade you are actually in has changed into a different one.
When is this lesson wrong?
When the market gaps. The zero-expectancy result assumes price moves in small continuous steps. Real markets jump, so a stop is often filled worse than where it sits while the target, being a limit, pays exactly what it says. That asymmetry makes the true directionless expectancy negative, not zero — so treat s ÷ (s + T) as a ceiling on what a coin gives you, not a floor.
When you do not have a win rate yet. The allowance table compares two choices under the assumption that p is a stable long-run number. Under a hundred of your own trades on one consistent rule, p is not yet a quantity. Use the table to rank options against each other, never to forecast an outcome.
When the cost figure is not yours. The 0.05% a side used here is a working assumption for the arithmetic, not any exchange's current schedule. Substitute your own, including funding if you hold perpetuals overnight, because 2c ÷ s is very sensitive to c.
When the average-bar-range yardstick is unstable. Ranges expand and contract. A ceiling computed in a quiet week is too generous for a volatile one, which is the same failure as a stop that was fine yesterday.
When you are using it to argue yourself into a trade. The ratio can justify almost anything if you are allowed to move either end. The protection is not a better formula; it is deciding the target and the stop before you look at what they imply, which is why the course puts the division at step three and not step one.
Frequently asked questions
What is a good risk-to-reward ratio?
There is no single good number, because the ratio is not something you set — it is what you get when you divide the distance to a real target by the distance to a stop the chart justifies. What you can say exactly is what each ratio requires: 1:1 needs a 50% win rate to break even, 1:1.5 needs 40%, 1:2 needs 33.33% and 1:3 needs 25%. A widely used minimum is 1:2, and it works as a rough proxy for “the target is far enough from the stop that the trade survives a normal bar and still has somewhere to go.” Above roughly 5R the extra ratio buys very little while the stop keeps shrinking, which is why demanding 1:8 to 1:10 on every trade does more harm than good.
Can you really be profitable with a 40% win rate?
Yes, above one specific ratio. A 40% win rate breaks even at exactly 1:1.5, because 40% is 1 ÷ (1 + 1.5). Below that it loses money no matter how convincing the entries feel. At 1:2 it earns +0.20R per trade and at 1:3 it earns +0.60R. So the familiar claim that a 40% win rate can still be profitable is true, but it is conditional — and the condition is a ratio above 1.5, held consistently rather than abandoned on the trades that look certain.
Does a higher risk-to-reward ratio always mean a better trade?
No, because the ratio and the win rate are attached to each other. The usual way to raise the ratio is to move the stop closer, and a closer stop is reached more often by ordinary movement, so the win rate falls at the same time. You can price the swap: starting from 40% at 3.00R, tightening to 4.50R is worth doing only if it costs fewer than 10.91 percentage points of win rate, and tightening to 9.00R only if it costs fewer than 24.00. The returns also shrink fast — the step from 3R to 4R buys 8.00 points of room, the step from 9R to 10R buys 1.45.
Why does my risk-to-reward ratio change when I switch timeframes?
Because the stop moves. The same entry and the same target, with the stop under the four-hour swing low, the one-hour swing low and the fifteen-minute swing low, give 3.00R, 4.50R and 9.00R respectively. All three stops are real levels; each simply belongs to a different chart. On a random-walk baseline an average bar's range grows with the square root of the timeframe, so quartering the frame halves the bar and doubles the largest ratio a given target can support — which is the arithmetic behind the entry rule “find the stop on a lower frame to get the best R:R”. What the rule does not say is that you also inherit the smaller frame's rate of being stopped out.
Do trading fees change the break-even win rate?
They raise it, and they raise it most for the tightest stop. With a one-way cost c, the break-even rate becomes (s + 2c) ÷ (s + T), so the penalty in percentage points is 2c ÷ (s + T). At a $66,000 entry and 0.05% a side, a $660 stop goes from 25.00% to 27.50% and a $220 stop from 10.00% to 13.00%. Relative to the requirement, the penalty is exactly 2c ÷ s — the target cancels out — which is 10.0% at the wider stop and 30.0% at the tighter one. The trader on a 1:9 setup has to beat chance by three times as much.
The course this lesson works from
Ten free PDF parts, taught on real charts — including the entry routine, the stop rules and the journal pages quoted above.