Position sizing — the stop decides the size
Almost every new trader does this backwards. They decide how much of the coin to buy, place the trade, and only then work out — usually after it has gone wrong — what that decision was costing them. The professional order is the reverse, and it is short enough to hold in your head: the loss you accept comes first, the stop comes second, and the size falls out of the two. The three slides below are from the course deck this site teaches from; the arithmetic underneath each one is worked out in full, including the one place the sheet is easy to misread.
What do the three course slides say?
Swipe or use the arrows. Each slide is from the course deck, redrawn for the web; the note underneath is ours.
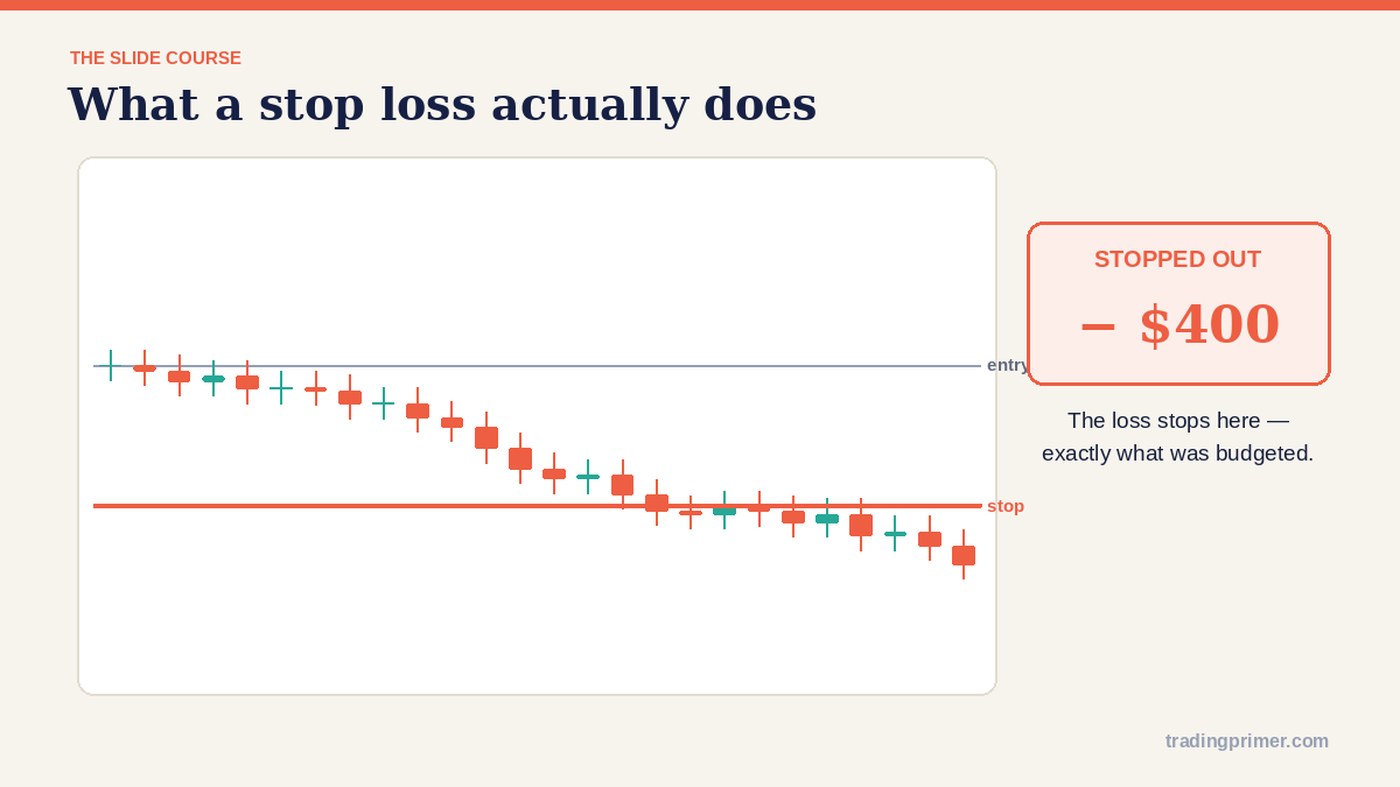
Start here: the stop is a budget, not a prediction. The slide defines it as the point where you cut the trade once price reaches the maximum loss you are willing to accept — and the second half is the part that matters for sizing. A stop is the only thing in a trade whose cost you know in advance, which is exactly why the position is built around it rather than the other way round. The claim that you can keep a low win rate and still be profitable is not encouragement; it is arithmetic that only works if every loss is the size you planned.Part 1, slide 20.
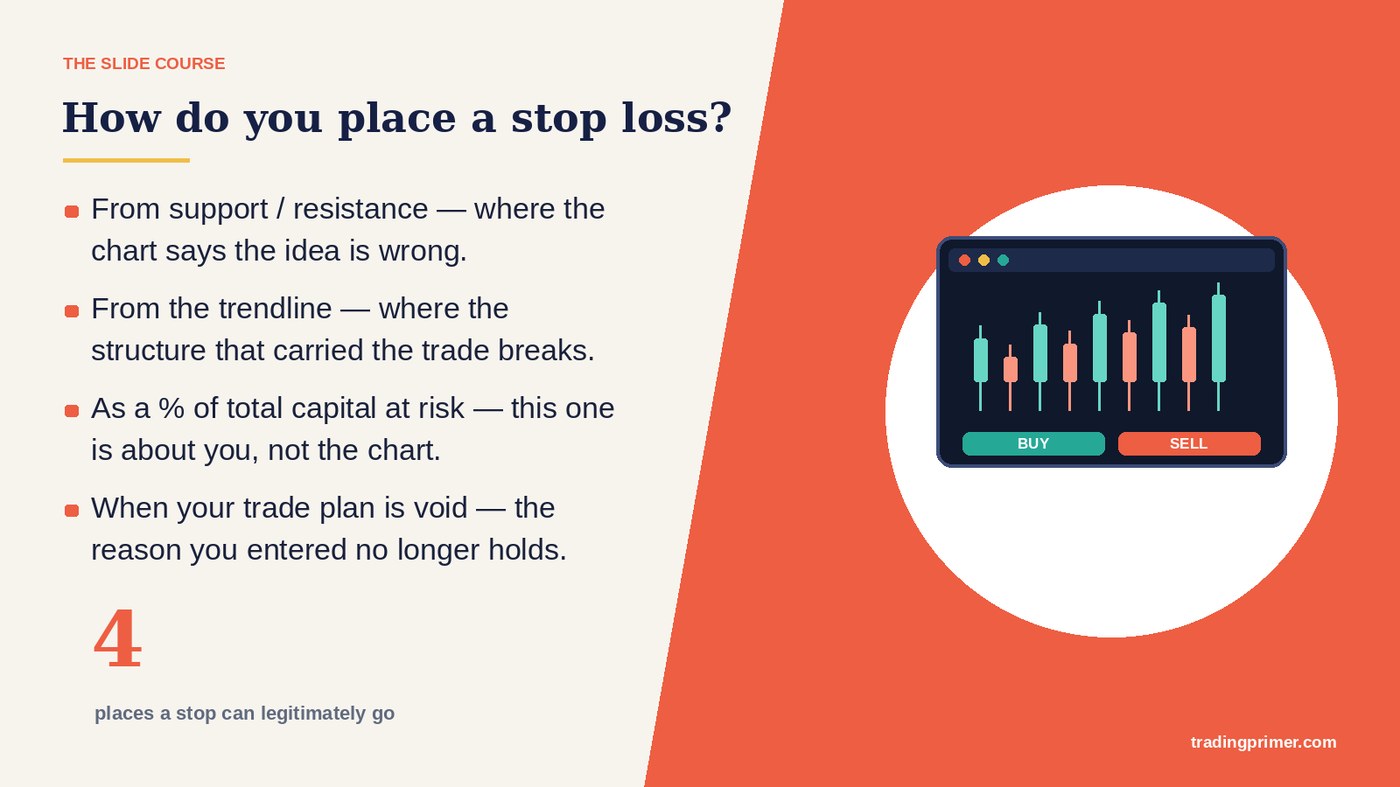
Four legitimate places — and only one of them is about you. Support or resistance, the trendline and “the plan is void” are all readings of the chart: they answer where would this idea be proven wrong. The percentage-of-capital option answers a different question — how much am I willing to lose — and if you let it choose the level, you have put the stop where your wallet is comfortable rather than where the market invalidates the trade. Use the chart to set the level, then use the percentage to set the size. That sequencing is the whole lesson.Part 1, slide 22.
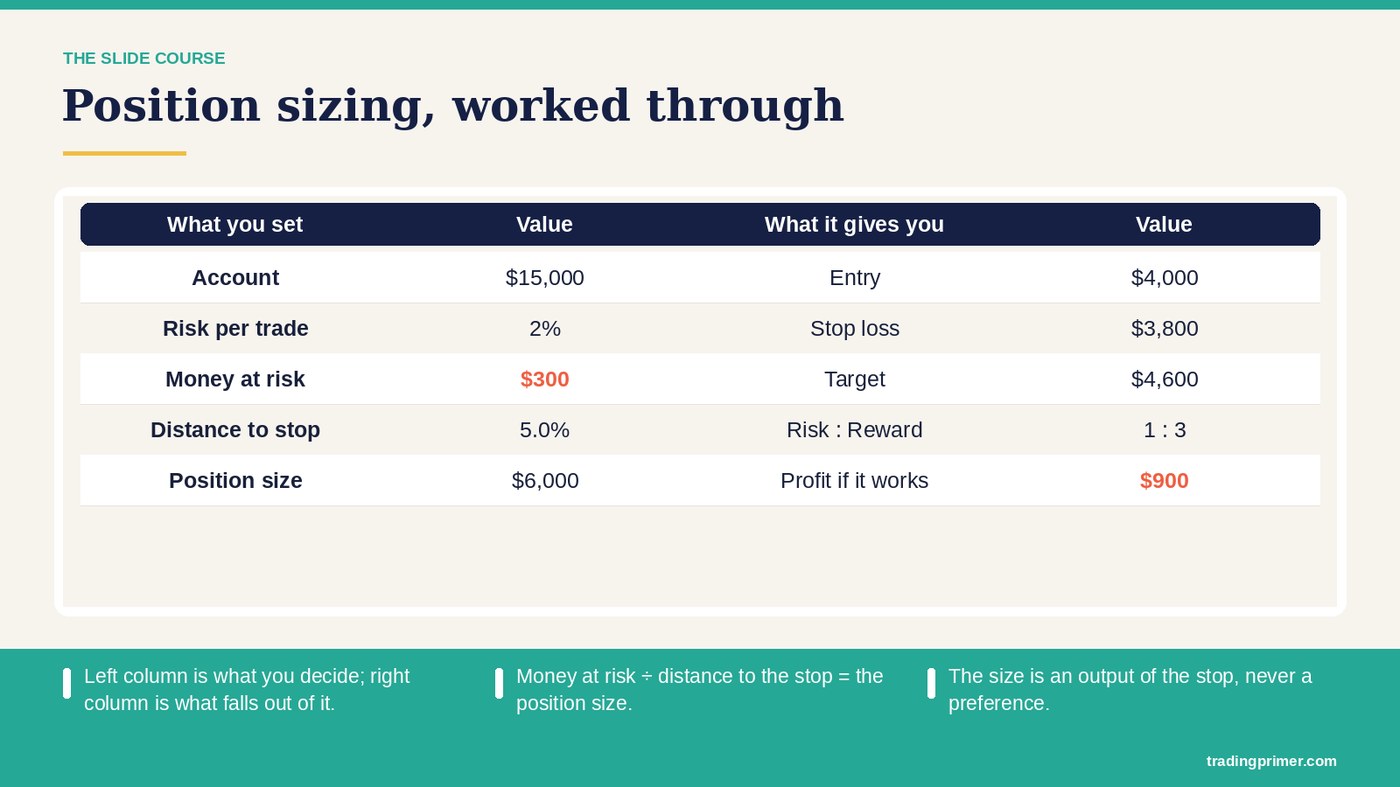
The sheet, and the one field that misleads. Capital $20,000, risk accepted 2% = $400, entry 9,900, stop 9,200, target 11,300, position value $5,657, potential profit $800, R:R 2. Every number is consistent and section 3 reproduces all of them. The trap is the field marked Risk 7.1%: that is the distance to the stop, not the share of your account at risk. Your account risk is the 2%. Read them the wrong way round and you will size the trade three and a half times too large.Part 1, slide 23. The step list on the slide says “e.g. 5% × capital” while the sheet is filled in at 2% — the 2% is the one the numbers follow.
KEY TAKEAWAYS
- Size is an output. Money at risk ÷ stop distance as a percentage of entry = position value. Nothing else enters the formula.
- The chart sets the stop; your account sets the risk. Swap those two jobs and you are placing stops where they feel affordable rather than where the idea dies.
- The worked case: $20,000 capital, 2% risk, entry 9,900, stop 9,200 → stop is 7.07% away, risk is $400, position is $5,657, or 0.5714 BTC.
- Check it backwards. 0.5714 × 700 = $400. If that multiplication does not return your intended risk, the size is wrong.
- A stop twice as far halves the position and leaves the dollar loss identical. Wider stops are not braver and tighter stops are not riskier — once sized, they cost the same.
- Two percentages, two meanings. 2% is account risk. 7.1% is stop distance. Confusing them is the most expensive reading error on the sheet.
Why does the size have to come last?
Because it is the only variable you can adjust without lying to yourself about the trade.
A trade has three numbers that come from the chart — entry, invalidation, target — and one that comes from you: how much of your capital this idea is worth. If you fix the position first, then one of the chart numbers has to bend to accommodate it, and in practice the one that bends is always the stop. It gets moved a little further out, to a place with no particular meaning, because that is what makes the size you already chose feel survivable.
The reason the order is worth this much fuss is measurable: run one identical strategy at different risk settings and it returns ×6.98 at 10% per trade and ×0.006 at 30%, without a single entry or exit changing — why risk comes before strategy works that through.
Run the order the other way and nothing has to bend. The level stays where the chart put it. The risk stays where you put it. The position — the one quantity with no opinion attached — absorbs the difference. This is also why sizing is the part of risk management that generalises: it does not care whether the setup came from a support level, a candlestick pattern or a moving average cross. It only asks how far away the exit is.
Where this sits in the whole sequence — budget fixed at step two, stop from the chart at step three, size falling out between them — and what it costs when the two are swapped at the same average exposure, is worked through in the trading plan: the five steps, in order.
How is the four-step calculation done?
Using the slide's own numbers, so you can check every line against the sheet above.
- Money at risk. 2% of $20,000 = $400. This is chosen before the chart is opened, and it does not change from trade to trade.
- Stop distance. Entry 9,900, stop 9,200, so the gap is 700 points. As a share of the entry price: 700 ÷ 9,900 = 7.07%. This comes entirely from the chart.
- Position value. $400 ÷ 0.0707 = $5,657. This is the value of the position, not the cash you need for margin — on a spot purchase they are the same, on a leveraged one they are not.
- Quantity. $5,657 ÷ 9,900 = 0.5714 BTC. This is the number you type into the order box.
Now check it in reverse, which takes five seconds and catches almost every sizing error: if the stop is hit, you lose 0.5714 × 700 = $400. That is the number from step one, so the chain holds.

The target completes the picture. From 9,900 to 11,300 is 1,400 points, or 14.14% of the entry — exactly twice the 7.07% risked. So the profit is twice the risk: 0.5714 × 1,400 = $800, and the reward-to-risk ratio is 2, which is the figure in the sheet. At an R:R of 2 the trade breaks even at a win rate of 1 ÷ (1 + 2) = 33.3% before costs, which is the arithmetic behind the claim on slide 20 that a modest win rate can still pay.

What does a wider stop do to the size?
It shrinks the position in exact proportion and leaves the dollar risk untouched. Holding the same $400:
| Stop distance from entry | Position value | Loss if stopped |
|---|---|---|
| 2.00% | $20,000 | $400 |
| 3.50% | $11,429 | $400 |
| 7.07% — the worked case | $5,657 | $400 |
| 14.00% | $2,857 | $400 |
| 20.00% | $2,000 | $400 |
Read the right-hand column first: it never moves. That is the entire purpose of the exercise. The left-hand column is the market's business and the middle column is arithmetic; only the right-hand column is your decision, and it is made once rather than trade by trade.

Notice the top row. A 2% stop supports a position equal to the entire account — and if the stop were tighter still, the formula would ask for more than the account holds, which is the point at which leverage stops being a way to feel bold and becomes a mechanical requirement of a very tight stop. That is a different lesson, and a genuinely dangerous one, which is why we treat it separately in leverage and margin.
One question this lesson deliberately leaves open: where should the stop distance in that left-hand column come from in the first place? One well-documented answer is to stop choosing it. The traders Richard Dennis trained in 1983 measured how far each market typically moved in a day, placed the stop at twice that distance, and let the size fall out of the division — so a violent market automatically got a smaller position than a quiet one, at identical dollar risk. Their rules also cut the whole account down a step after every 10% of drawdown, without asking the trader. See Richard Dennis and the Turtles for how that worked, and for what happened to the man who wrote the rules and then stopped following them.
What does a volatility stop look like on a real year of Bitcoin?
The Turtle rule above — stop at twice the market's typical daily move, size from the division — sounds tidy on paper, so we ran it on a year of real candles to see what it actually hands a trader. Conditions, so you can repeat it: Binance spot BTCUSDT daily candles, closed only, 22 Sep 2025 to 22 Sep 2026 UTC, 365 days. A day's range is (high − low) ÷ close. The “typical move” is the plain 20-day average of that range, recomputed every day from day 21, so 345 readings. Stop distance = 2 × that average; position = $400 ÷ stop distance, exactly the formula of this lesson.
| Reading | Typical daily range (20-day mean) | Stop = 2× that | Position for $400 at risk |
|---|---|---|---|
| Median day of the year | 3.48% | 6.95% | $5,752 |
| Quietest reading (ends 2026-08-17) | 1.87% | 3.74% | $10,695 |
| Most violent reading (ends 2026-02-18) | 6.62% | 13.24% | $3,021 |
| Quietest 30-day block (from 2026-07-19) | 2.07% | 4.14% | $9,659 |
| Most violent 30-day block (from 2026-01-20) | 5.41% | 10.83% | $3,694 |
Three things fall out of that table. First, the course's worked case is not a made-up number: the slide puts the stop 7.07% below the entry, and the median volatility stop on a real year of Bitcoin came out at 6.95% — the same distance to within a tenth of a point, which is presumably why the sheet was filled in that way. Second, at an identical $400 of risk the correct position swung from $3,021 to $10,695 across the year, a factor of 3.5×, without the trader changing a single setting. The market did the sizing; the trader only kept the $400 fixed. Anyone who instead bought “the usual amount” through the block starting 2026-01-20 was carrying more than twice the risk they were carrying in 2026-07, and nothing on the order ticket would have told them. Third, the single worst day of the year (2025-10-10) ranged 18.22% inside one candle — six times the median day. A stop sized on the 20-day average is not built for that day, and no position size is; that is the “the stop is not guaranteed” limit below, seen in the data rather than asserted.
Which two percentages do people confuse?
On the sheet, two numbers wear a percent sign and mean completely different things.
- 2% — account risk. The share of your capital that disappears if the stop is hit. Yours to choose, constant across trades, measured in your account.
- 7.1% — stop distance. How far the stop sits below the entry, as a share of the entry price. The market's to choose, different on every trade, measured on the chart.
They are not comparable, and they are certainly not interchangeable. The expensive version of the mistake goes like this: a trader reads “risk 2%”, thinks in terms of position size rather than loss, and buys $20,000 of BTC — the whole account — on the grounds that the risk is “only small”. The stop is still 7.07% away. It gets hit. The loss is 7.07% of $20,000 = $1,414, against a budget of $400. Nothing about the chart went unusually wrong; the trade simply cost three and a half times what it was supposed to.
The habit that prevents it: always convert the percentage into a dollar figure before you place the order, and say the sentence out loud — if this stop is hit I lose four hundred dollars. Percentages hide magnitude. Amounts do not.
A long-run record can hide exactly the drawdown this lesson sizes for. Charlie Munger’s partnership compounded at 19.8% a year from 1962 to 1975 with a concentrated portfolio, and still lost 31.9% in 1973 and 31.5% in 1974 — 53.4% in two years, a hole that needs +114.6% to fill. Someone who joined at the end of 1972 still had about $8,080 of every $10,000 when the record ended in 1975. See the year-by-year path and what it cost his partners.
When is this lesson wrong?
Four honest limits, because a formula that is presented as complete stops being useful the first time reality disagrees with it.
“Where the chart says the idea is wrong” is doing a lot of work. Most charts offer several levels that all qualify — a trendline, a swing low, a zone edge, an invalidation price — and they sit at different prices, so they produce different sizes from this same formula. Lesson 43 names the four and prices the choice between them.
The stop is not guaranteed. Sizing assumes you exit at the level you chose. In a fast market, or a gap, or a thin book, the fill can be worse — so $400 is a planned loss, not a promised one. This is a reason to size on the modest side, not a reason to skip the calculation.
Fees and funding are not in the arithmetic. Every figure above is before costs. They are small per trade and not small per year, and they always work against the reward-to-risk ratio you calculated.
One trade at a time is the wrong unit. Four open positions at 2% each are not four separate 2% risks if they are all long crypto majors — correlated positions can be stopped out together, which is a single 8% day wearing four disguises. Sizing each trade correctly is necessary and not sufficient; portfolio-level risk is its own lesson.
What are the most common mistakes here?
| Mistake | Why it fails | Do this instead |
|---|---|---|
| Choosing the quantity first, then finding a stop that “fits” | One of the chart's three numbers has to bend, and it is always the stop, moved to a level with no meaning | Risk from the account, stop from the chart, size from the division — in that order |
| Reading the 7.1% on the sheet as account risk | That is stop distance. Sizing the whole account against it turns a $400 loss into $1,414 | Say the dollar figure out loud before the order: “if this stop is hit I lose $400” |
| Dividing dollars by a stop measured in points | Wrong units — 400 ÷ 700 is not a position | Convert the stop to a share of the entry price first: 700 ÷ 9,900 = 7.07% |
| Calling $5,657 “the money I need” | It is position value. On spot the two match; on margin they do not, and the confusion is how leverage gets used without being chosen | Keep value and margin as separate numbers; see the leverage lesson |
| Treating a wide stop as reckless or a tight one as safe | After sizing, both lose exactly $400. Width changes the position, not the loss | Ask what the stop tells you about the idea, not how brave it looks |
| Rounding the quantity, then trusting the old check | 0.57 × 700 = $399, and on larger sizes the rounding error is real money | Round last, then rerun quantity × points with the rounded figure |
| Skipping the sizing when the account is small | A $400 risk on $20,000 and a $10 risk on $500 are the same discipline; the habit is what scales | Size every trade, even the ones that feel too small to matter |
Five of those seven are the same error wearing different clothes: letting something other than the stop distance decide the size — the account balance, the feeling of conviction, a rounded number, a percentage read off the wrong line. The formula has exactly two inputs, and both of them are measured before the order exists.
What else do people ask about position sizing?
How do you calculate position size?
In four steps, and the order matters. Decide the money you are prepared to lose on this one trade. Place the stop where the chart says the idea is wrong, and measure that distance as a percentage of the entry price. Divide the money by that percentage to get the position value. Divide the position value by the entry price to get the quantity. On the course's example: $20,000 capital, 2% risk, entry 9,900, stop 9,200 → 7.07% distance, $400 risk, $5,657 position, 0.5714 BTC. Check it backwards: 0.5714 × 700 = $400.
In a sizing sheet the risk field reads 7.1%. Is that how much of the account is at risk?
No — that is stop distance, not account risk. Your account risk is the 2%, which is $400. The 7.1% is a fact about where the stop sits relative to the entry price and has nothing to do with the size of your account. Reading one as the other is how a $400 trade quietly becomes a $1,414 one.
What happens to position size when the stop is further away?
It shrinks in exact proportion, and the dollar risk does not change. Holding $400 fixed: 2% supports $20,000, 3.5% supports $11,429, 7.07% supports $5,657, 14% supports $2,857, 20% supports $2,000. Double the distance, halve the position. Wider stops are therefore not more cautious once sizing is done — what changes is how far price has to travel to reach the same reward-to-risk ratio.
What if the correct stop makes the position too small to bother with?
Take the smaller position, find an entry closer to the invalidation level, or skip the trade. Do not widen the risk to make the number look worth your time — that is the same error as sizing first, arriving by a more flattering route. If small positions feel pointless at your account size, that is a fact about the account rather than about the method.
Where does this sit in the course?
Lesson 42 follows Lesson 41 on reward-to-risk, which explains why a 2:1 trade can pay at a 40% win rate; this lesson is the arithmetic that makes every one of those trades cost the same amount when it fails. It leans on Lesson 40 for where the 2% comes from and on Lesson 8 for what happens when the division asks for more than the account holds. Next comes Lesson 43 on stop placement, which names the four legitimate places the stop distance in step 2 can come from — the one input this lesson deliberately leaves open.
The deck these slides come from
Ten free PDF parts, taught on real charts — the same course this lesson works from.