The one to two percent rule — and what breaking it costs
Everyone knows the rule and almost nobody can say where the number came from, which is why it gets abandoned the first time a trade looks certain. It is derivable. Two facts settle it: how long your losing streaks actually run — nine in a row is the median for a 40% win rate, not the disaster case — and how deep a hole you can sit in without changing the plan. Below, both are measured, the second is left to you, and the cost of ignoring the answer is priced: at 10% per trade, an ordinary losing streak is longer than the run that halves the account.
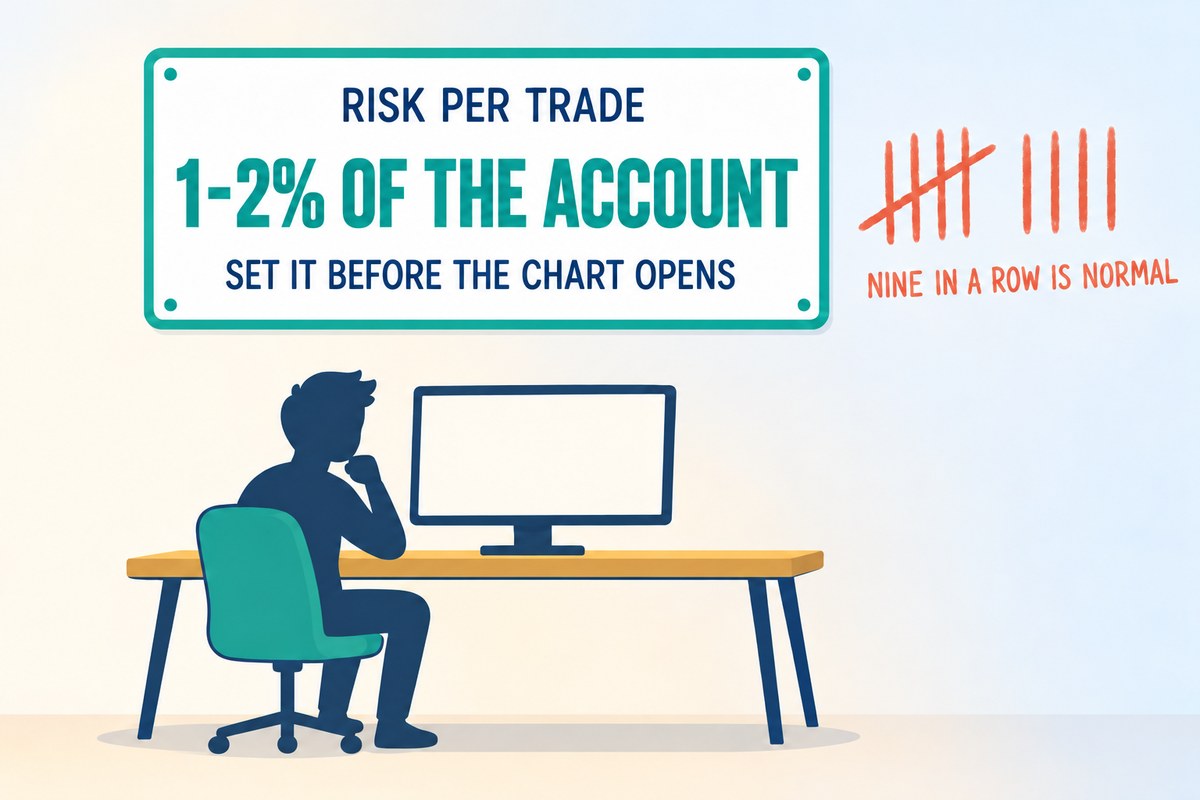
A card on the wall, not a scale on a chart — nothing in this picture is measured, and it is not meant to be. The arithmetic that produces the number on the card is in the three figures below.
KEY TAKEAWAYS
- Nine losses in a row is the median, not the disaster. A system winning 40% of its trades produces a nine-loss streak as its middle outcome over 200 trades, and a 90.9% chance of at least seven in a row. At a 30% win rate the routine streak is twelve.
- The hole and the climb out grow at different speeds. That same streak costs 8.65% at 1% risk and 61.26% at 10%. Moving from 1% to 10% multiplies the hole by 7.08 but the climb back by 16.70 — 9.47% becomes 158.12%.
- At 10% per trade the ordinary streak is longer than the budget. Seven straight losses halve the account and the routine run is nine. No bad luck is required; the setting fails on a normal year.
- The band is a solution, not a convention. f = 1 − (1 − D)1/L, where L is your routine streak and D the fall you would sit through. Ordinary inputs give 1.35% to 2.45% — and different inputs correctly give a different number.
What does the one to two percent rule actually say?
It says: decide the largest amount a single trade may take from you, express it as a percentage of your trading capital, fix it before you open a chart, and then never let a particular trade talk you out of it. On a $20,000 account, 1% is $200. That is the whole rule.
Two things it does not say, both of which cause trouble. It is not a limit on position size — a $200 risk buys a $10,000 position when your stop sits 2% away and a $40,000 position when it sits 0.5% away, and turning the risk budget into a size is a separate step covered in Lesson 42. And it is not a limit on the balance sitting on the exchange; Lesson 39 showed why funding a smaller account changes nothing about the money a trade can cost.
So the rule is one number. The question this lesson answers is where that number comes from, because “1–2%” is usually presented as something everyone agrees on and nobody derives. It is derivable, from two facts about you, and the derivation turns out to be more useful than the number.
Why does a losing streak decide the number?
Because losing streaks are the only thing that can kill a working system, and they are far longer than people expect. The course this site teaches from names the mechanism in its own definition — fixing the maximum loss in advance “lets you survive in the market for a long time, especially through a losing streak”. That last clause is the whole design brief.
A win rate of 40% does not mean losses come politely spaced out. It means each trade is an independent coin with a 60% chance of a loss, and long runs of tails are ordinary. The table below is the exact distribution — computed by enumerating every sequence with dynamic programming, not simulated — of the longest run of consecutive losses a trader meets. The figure shown is the median: half of all traders running that exact system meet a streak that long or worse.
| Win rate | 100 trades | 200 trades | 500 trades | 1,000 trades | Chance of a 7-loss run in 200 |
|---|---|---|---|---|---|
| 50% | 6 | 7 | 8 | 9 | 54.4% |
| 40% | 7 | 9 | 11 | 12 | 90.9% |
| 30% | 10 | 12 | 15 | 17 | 99.8% |
Read the middle row. Two hundred trades is roughly one active year of swing trading. A 40% system hands that trader a nine-loss streak as the median outcome, and gives them a 90.9% chance of at least seven in a row. Nine consecutive losses is not a bad year; it is the ordinary shape of a 40% win rate seen from the inside.
The bottom row matters more than it looks. The trading journal reproduced in our own course — a real page, dated 21 May 2023 — contains the sentence “a consistently successful trader wins only about 30–35% of their trades”. If that is the target, the streak to plan for is twelve, not nine.
One caveat, and it points the wrong way for comfort. The table assumes trades are independent. Real losses are not: a market that stops suiting your method stops suiting it for weeks, so losses cluster and real streaks run longer than these figures. Treat the table as a floor.
What does one ordinary streak cost at each risk setting?
Take that nine-loss streak, hold it completely fixed, and change only the risk setting. Each trade risks its percentage of what is left, the arrangement usually called fixed-fractional sizing — the dollar risk shrinks as the account does.

Now the same streak across four settings, with the number nobody computes in the third column.
| Risk per trade | Account after 9 straight losses | Gain needed to get back | Consecutive losses that would halve the account |
|---|---|---|---|
| 0.5% | −4.41% | +4.61% | 139 |
| 1% | −8.65% | +9.47% | 69 |
| 2% | −16.63% | +19.94% | 35 |
| 5% | −36.98% | +58.67% | 14 |
| 10% | −61.26% | +158.12% | 7 |
The two right-hand columns describe the same event and they grow at different speeds. Moving from 1% to 10% multiplies the risk by ten. It multiplies the hole by 7.08 — less than ten, because compounding cushions the fall. But it multiplies the climb out by 16.70, from 9.47% to 158.12%.
That gap is the entire cost of breaking the rule, and it is invisible for a simple reason. Recovery is loss ÷ (1 − loss), and that denominator collapses as the loss deepens. People estimate the hole, because a falling account is something you can picture. Nobody estimates the climb, because there is nothing to look at until you are standing in it. A trader down 61% is not “having a bad run” — they need to more than double what is left before they have made a single dollar.
How many losses in a row can you actually afford?
That last column deserves its own name: it is your budget of consecutive mistakes, measured in trades. Halving the account is a fair place to draw the line, because a 50% drawdown needs a 100% gain and almost nobody keeps executing a plan through one.
Set the budget against the streak you already know is coming, and the picture resolves. At 1% per trade, one ordinary nine-loss streak spends 13% of the budget — you could survive roughly seven and a half such streaks before you halve the account. At 2% it spends 26% — thirty-five straight losses would be needed to halve the account. At 5% it spends 67%: a single routine bad run puts you two-thirds of the way to a hole you probably will not climb out of.
And at 10%, the arithmetic runs out. Seven consecutive losses halve the account and the ordinary streak is nine, so the routine losing run is longer than the entire budget. There is no unlucky event in that sentence, no leverage mistake, no market crash. The setting itself is the failure, and it fails on a completely normal year.
This is what separates the rule from a preference. Below roughly 2%, an ordinary streak is an inconvenience you trade through. Above 5%, an ordinary streak is a career event. The boundary between those two worlds sits inside the range people casually argue about.
So where does the 1–2% band actually come from?
From reversing the arithmetic. You now know the streak your method produces — call it L. Decide the drawdown you would genuinely sit through without changing the plan — call it D. Every risk setting maps to a depth, so the map runs backwards:
f = 1 − (1 − D)1/L
That is the whole lesson in one line. Here it is filled in. Each column is one cell of the streak table in section 2 — read the sub-heading, because the same win rate gives a different L at a different number of trades, and it is the number of trades that decides which column is yours. The rows are tolerances.
| Drawdown you can sit through | L = 6 50% win, 100 trades |
L = 9 40% win, 200 trades |
L = 12 30% win, 200 trades |
L = 15 30% win, 500 trades |
|---|---|---|---|---|
| 10% | 1.74% | 1.16% | 0.87% | 0.70% |
| 15% | 2.67% | 1.79% | 1.35% | 1.08% |
| 20% | 3.65% | 2.45% | 1.84% | 1.48% |
| 25% | 4.68% | 3.15% | 2.37% | 1.90% |
| 30% | 5.77% | 3.89% | 2.93% | 2.35% |
| 50% | 10.91% | 7.41% | 5.61% | 4.52% |
Look at the four bold cells. They are the most ordinary inputs a real trader has — a method winning 30–40% of the time, and a willingness to sit through a 15–20% fall. They produce 1.35% to 2.45%.
That is the 1–2% band. It does not come from tradition or from a book everyone copied; it is the solution of this equation for ordinary human inputs. Which also means the band is not sacred: a trader who honestly sits through 30% with a 40% win rate should be at 3.89%, and a trader who abandons plans at 10% down should be near 1.16% even though the “rule” would let them double it.
Only step 4 is a choice. Steps 1 to 3 are counted from your own records, and the last line is arithmetic. If you have never run this and you use 1% because a book said so, you may well land on the same number — but you will hold it differently, because you will know what it is protecting you from.
PRACTICE CORNER
Twenty minutes, and you leave with a number that is yours. One: open your trade history and find your actual longest run of consecutive losses. Most people have never looked, and most are surprised. Two: compare it with the row for your win rate in section 2 — if yours is longer, that is normal, and use yours. Three: decide D away from any open position — never while a trade is running, when you are negotiating rather than measuring. Four: compute f = 1 − (1 − D)1/L, round it down, and write it somewhere you will see before you trade. Five: work out what nine losses at that setting compound to — not nine times f, but 1 − (1 − f)9 — and look at it, because that is the ordinary year you have just signed up for.
Step one needs an exchange that exports a complete fill history, and step four needs a platform where you can enter a position by value rather than by guessing a quantity — otherwise your careful number gets lost in rounding at the order ticket. These are the three exchanges this site uses for its own worked examples.
We may earn a commission if you open an account through these links, at no cost to you. It does not change what is written above.
Once you have f, the position size calculator turns it into a quantity in one step.
Why does our own course print four different numbers?
Because the four figures do four different jobs, and the course never claims they are the same instruction. Laid side by side they also run in one direction, which is worth following rather than hiding.
| Where it appears | The number | What it is |
|---|---|---|
| Part 1, “How to work out position size”, step 1 | 5% | An arithmetic illustration of the multiplication — “risk % × capital (e.g. 5% × capital)”. Not a recommendation. |
| Part 2, the worked sizing example | 2% | An operating rule: “each stop loses at most 2% of the account”. |
| Part 10, the summary | 1–2% | The stated recommendation: “cap the loss at 1% or 2% of total capital”. |
| The handwritten journal, 21 May 2023 | 0.5–1% | What the course's author held himself to, in his own hand: “I only have to follow the rule: risk 0.5% to 1% of the account per trade.” |
That is a ladder, and section 2 explains why it descends. On the same journal page, one line above the 0.5–1%, sits the acceptance that a consistent trader wins only 30–35% of the time. A 30% win rate means a routine streak of twelve. Twelve losses at 1% costs 11.36%; at 5% it would cost 45.96%. Once you have accepted the win rate, the small number stops looking like modesty: it is what that win rate forces as soon as you also name a fall you are willing to hold through.
The other page is dated 16 July 2023 and begins “the account blew up”. It lists four causes in the author's own hand. The second is “position size far too large” and the third is “stop loss set far too wide” — which are the same failure counted twice, because both mean the real loss per trade exceeded the number that had been set in advance. The first is “overtrading” — too many trades — which the next section shows this rule does not defend against at all.
How do people break this rule while still calling it 1%?
Three ways, and all three pass a casual self-audit because every individual ticket really does risk 1%.
Several positions, one event. Five altcoin longs at 1% each look like five separate 1% risks. They are not, if one bitcoin fall would stop out all five. Combined, they are 1 − 0.995 = 4.90% riding on a single move. Our course is blunt about the correlation involved: on a bitcoin down-leg, altcoins usually fall harder, which is exactly why five tickets can be one risk. The rule has to be applied to the event that can go against you, not to the ticket.
Several trades, one day. The same formula, different question. Five trades in a day at 1% each is 4.90% of the account on that day; ten is 9.56%. At 2% per trade, five trades is 9.61% and ten is 18.29%. A per-trade rule silently becomes a per-day rule as soon as you take more than one trade, which is why the course pairs it with a separate daily loss cap.
| Trades on the same event or the same day | At 1% each | At 2% each |
|---|---|---|
| 1 | 1.00% | 2.00% |
| 3 | 2.97% | 5.88% |
| 5 | 4.90% | 9.61% |
| 10 | 9.56% | 18.29% |
Costs, which the rule does not cover at all. If your round-trip trading cost is c of position value each way and your stop sits s away from entry, the cost eats 2c ÷ s of your risk budget — and that fraction is the same whatever your account size and whatever f you chose. With costs of 0.05% a side and a 2% stop it is 5% of the budget, which is nothing. With the same costs and a 0.5% stop it is 20%: a fifth of every risk budget is gone before the market has an opinion. Fill in your own exchange's current fee schedule, because published rates change and tier down with volume.
| Your one-way cost | Stop 5% away | Stop 2% away | Stop 0.5% away |
|---|---|---|---|
| 0.02% | 0.8% | 2.0% | 8.0% |
| 0.05% | 2.0% | 5.0% | 20.0% |
| 0.10% | 4.0% | 10.0% | 40.0% |
There is a fourth version worth naming because it is dressed as discipline: funding the account with a tiny fraction of savings and then using extreme leverage on it, so the “1% at risk” is technically true of the deposit. The course is direct about the damage — what breaks is not the balance but the habit of reading markets properly, because reaching a large multiple on a small deposit forces you to take the unclear setups along with the clear ones.
The same logic applies to a whole portfolio, not just one trade. Charlie Munger ran one of the best partnership records on file, 19.8% a year over fourteen years, and two bad years in a row still took it down 53.4%. If one holding is a third of your account, a 50% fall in it costs the account 16.7%; if it is a twentieth, 2.5%. How concentration shaped his record.
What do people get wrong about this?
Treating a long losing streak as evidence the system broke. Nine in a row is the median for a 40% win rate. Changing method at that point replaces a system whose behaviour you now understand with one you have never seen lose.
Confusing the fall with the recovery. A 36.98% fall and a 58.67% recovery are two descriptions of one event, and only the second tells you what the work ahead looks like.
Reading 1% as a limit on position size. It is a limit on loss. A tight stop buys a large position on the same budget, which is entirely consistent with the rule and a genuine surprise to people meeting it for the first time.
Assuming a tighter stop is simply better. It buys a larger position on the same budget and a bigger reward-to-risk ratio at the same time, which is why it feels free. It is not: Lesson 41 prices what the tighter stop sells in exchange, because a stop the market reaches more often is a win rate you no longer have.
Setting the number while a position is open. At that moment you are not measuring what you can lose; you are negotiating with a trade you want to work.
Applying it per ticket instead of per event. Covered above, and it is the version most likely to be happening to a careful reader right now.
When is this lesson wrong?
When your trades are not independent — which is always, a bit. The streak table assumes independence. Clustered losses make real streaks longer, so every f in this lesson is slightly too generous. Round down.
When the account is small enough that percentages stop being the binding constraint. 1% of $500 is $5. Minimum order sizes, fee minimums and the spread all take a fixed bite that does not scale down, so the honest reading is not “use a bigger percentage” but “this account is too small for this style, so trade a style with wider stops or fewer trades”.
When you have no win rate yet. The whole derivation needs an L, and L needs a measured win rate. If you have fewer than about fifty of your own trades on record, use the 30% row: it is conservative, and it is the figure our own course expects of a consistent trader.
When D is dishonest. Everyone can sit through 30% in a spreadsheet. The number that belongs in the formula is the one you will still be honouring in month six, and Lesson 39's days-of-income conversion exists because that number is easier to feel than to guess.
When the rule is doing a job it cannot do. It caps one loss. It does not cap correlated losses, daily losses, trading costs, or the damage of trading a strategy you do not understand. It is one constraint, not a safety system.
Frequently asked questions
What is the 1% rule in trading?
It is the practice of fixing, before you look at any chart, the most a single trade may take from you — 1% of your trading capital, so a $20,000 account risks $200 a trade. It is a cap on the loss, not a cap on the position — turning that budget into a quantity is a separate step, covered in Lesson 42. The widely quoted band is 1–2%, and this lesson shows the band is not tradition — it is what falls out of an ordinary losing streak and a tolerable drawdown.
Is risking 2% per trade too much?
It depends entirely on how long your losing streaks run. A system winning 40% of the time over 200 trades produces a nine-loss streak as its median outcome, and nine losses at 2% costs 16.63% of the account — which many traders find they can sit through, though only you can say whether you can. The same streak at a 30% win rate runs to twelve losses and costs 21.53%. Take the streak your own method produces, compound it at 2%, and ask whether you would still be following the plan at the bottom. If the honest answer is no, 2% is too much for you.
What happens if I risk 5% or 10% per trade?
Nine losses in a row cost 36.98% at 5% per trade and 61.26% at 10%, against 8.65% at 1%. The recovery is where it turns: those holes need gains of 58.67% and 158.12% to get back to level, against 9.47%. Going from 1% to 10% multiplies the risk by ten, the hole by 7.08, and the climb out by 16.70. At 10% the ordinary nine-loss streak is longer than the seven consecutive losses that halve the account, so a routine bad run — not a disaster — takes more than half the money.
How do I work out my own risk per trade instead of copying 1%?
Two inputs. First L, the longest losing streak you will routinely meet: 9 for a 40% win rate over 200 trades, 12 at 30%. Second D, the drawdown you would genuinely sit through without changing the plan — the only personal number in the calculation. Then f = 1 − (1 − D)^(1/L). L = 9 with D = 20% gives 2.45%; L = 12 with D = 15% gives 1.35%. Round down, because the streak table assumes independent trades and real losses arrive in clusters, which makes real streaks longer than the table.
Does the 1% rule protect me if I hold several positions at once?
No, and this is the most common way the rule is broken by people who believe they are following it. Five positions risking 1% each that would all be stopped out by the same move — five altcoin longs during one bitcoin fall, for instance — are a single 4.90% risk, not five 1% risks. The same arithmetic applies to trade frequency: five trades in one day at 1% each puts 4.90% of the account on that day. The rule has to be applied to the event that can go against you, not to the ticket.
The other kind of loss. Everything above is about losses you chose in advance. Lesson 52 is about the one you did not — a single position whose cap was removed while it was open, which no streak arithmetic can price.
The course this lesson works from
Ten free PDF parts, taught on real charts — including the risk management material and the journal pages quoted above.