Candlesticks — what one candle can and cannot tell you
Almost every candlestick guide is a catalogue: here is a hammer, here is a doji, here is what each one means. That approach fails in practice for a reason nobody mentions — a candle is a compression of thousands of trades into four numbers, and compression throws information away. Two completely different eight-hour sessions can produce the identical candle. This lesson does the opposite of a catalogue. It shows you what survives the compression, gives you one number to score a candle instead of a name to argue about, and then demonstrates with the same tape cut two ways that an intraday pattern is partly an invention of the exchange clock.

KEY TAKEAWAYS
- A candle is four numbers — open, high, low, close. It contains no information about the sequence in which those prices occurred, which is the single most misunderstood thing about candlesticks.
- Score a candle instead of naming it. Close location value = ((close − low) − (high − close)) ÷ (high − low), a number from −1 to +1 that is comparable across every instrument.
- The same eight hours of trading, cut on a boundary two hours earlier, turns a hammer with CLV +0.71 into a bearish candle with CLV −0.43. Not one trade changed.
- A candle whose range is under 1.5× the recent average range carries no information, whatever shape it happens to be. On a pure random walk the range filter passes 9% of candles; the CLV threshold alone passes 62%.
- Location beats shape: the same hammer at a level that was defended before, and in the middle of a range, are not the same event.
What is a candlestick actually recording?
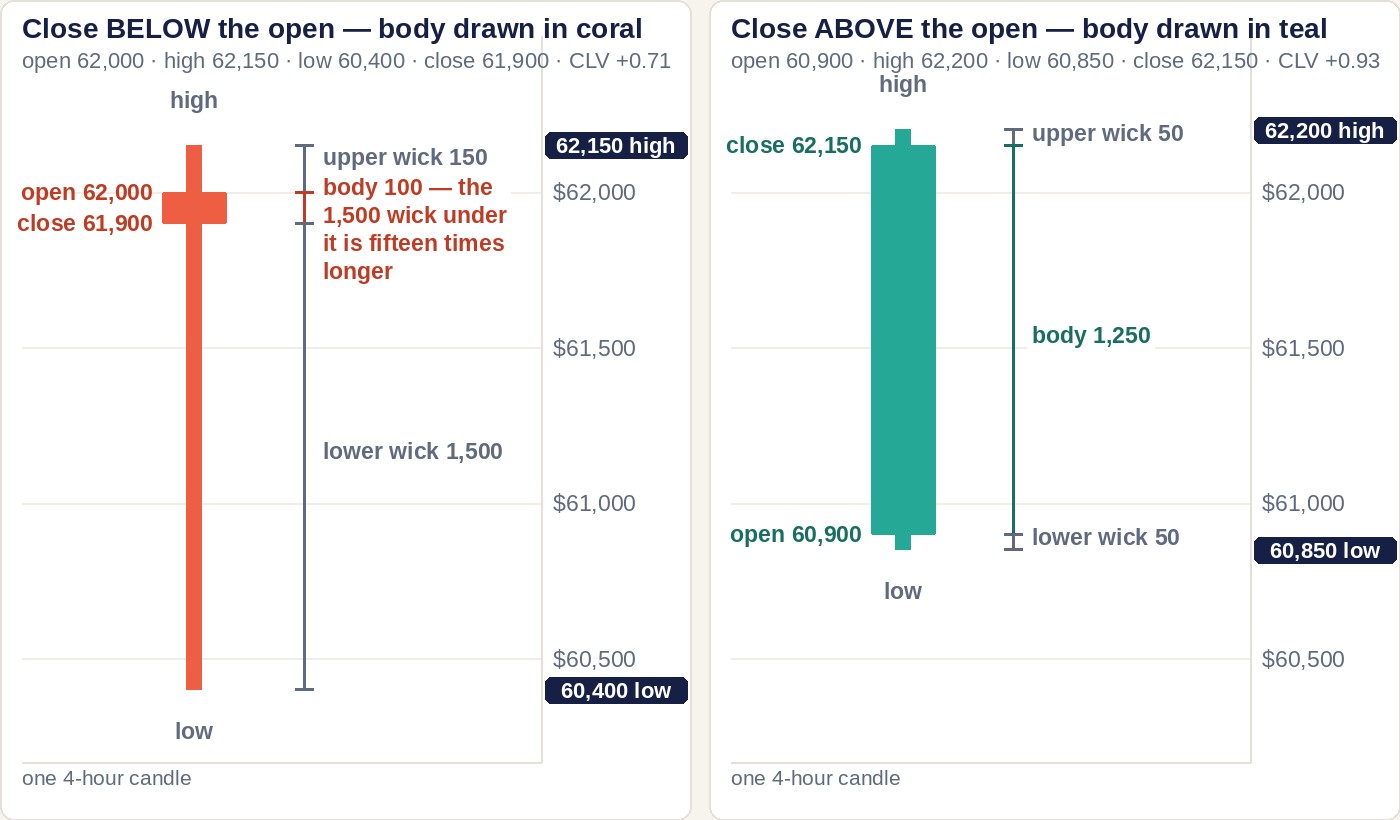
Four prices, for one fixed slice of time. Nothing else. Choose a four-hour candle and the exchange records where the first trade of those four hours happened, the highest and lowest prices touched at any point inside them, and where the last trade landed.
Those four numbers get drawn as a shape. The body is the rectangle between the open and the close. The wicks — also called shadows — are the thin lines running from the body out to the high and the low. Colour is a convention: the body is usually green or hollow when the close is above the open, red or filled when it is below.
| The number | What it is | The question it answers |
|---|---|---|
| Open | First traded price of the period | Where did this slice of time start? |
| High | Highest price touched at any moment | How far up did buyers get, even briefly? |
| Low | Lowest price touched at any moment | How far down did sellers get, even briefly? |
| Close | Last traded price of the period | Where did it settle when the clock ran out? |
Volume is not part of a candle. It is a separate series that most charting software draws underneath, and it is the missing half of every candlestick read.
Here is the part that matters and that catalogues skip. The close is the only one of the four numbers that had to survive a whole period of trading. A high or a low can be printed by one order, in one second, and abandoned immediately. The close is where price was standing when the period ended, after everyone who disagreed had the whole period to do something about it. That asymmetry is the reason the next section scores a candle by where the close sits, and largely ignores whether the body is red or green.
How do you turn a candle into a number instead of a name?
Use close location value, usually shortened to CLV. It asks one question: out of the whole distance the candle travelled, where did it end up?
CLV = ((close − low) − (high − close)) ÷ (high − low)
It returns a number between −1 and +1. A close exactly at the high gives +1. A close exactly at the low gives −1. A close at the midpoint gives 0. That is the whole calculation, and you can do it on a phone in ten seconds.
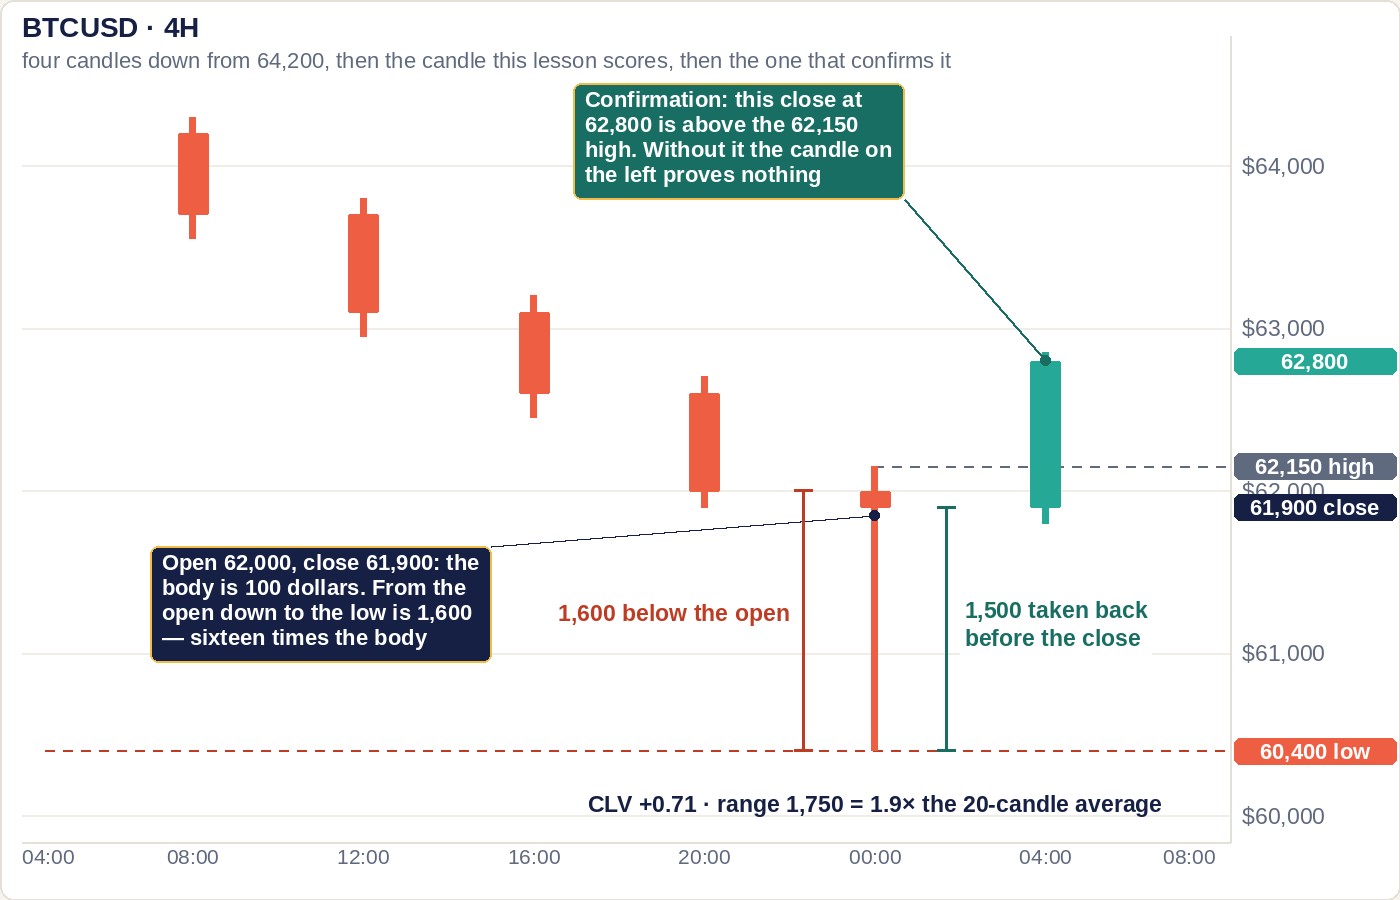
Run it on a real-looking example. A four-hour candle opens at $62,000, spikes up only as far as $62,150, gets driven down to $60,400, then closes at $61,900:
CLV = (($61,900 − $60,400) − ($62,150 − $61,900)) ÷ $1,750 = ($1,500 − $250) ÷ $1,750 = +0.71
Notice what just happened. The body of that candle is red — the close is $100 below the open. A beginner reading colour sees a down candle. But price was pushed $1,600 below the open and $1,500 of that was taken back before the clock ran out, and the CLV of +0.71 says so in one number. The body tells you about two arbitrary instants; the CLV tells you about the whole period.
Here is that scoring applied to the five shapes you will actually meet. Every row is computed from the prices shown — substitute your own and the arithmetic is the same:
| Shape | Open / High / Low / Close | Range | CLV | What it says |
|---|---|---|---|---|
| Hammer | 62,000 / 62,150 / 60,400 / 61,900 | $1,750 | +0.71 | Driven down hard, closed back near the top |
| Bullish marubozu | 60,900 / 62,200 / 60,850 / 62,150 | $1,350 | +0.93 | Up all period, no meaningful pushback |
| Doji | 62,000 / 62,700 / 61,300 / 62,010 | $1,400 | +0.01 | Wide travel, settled dead centre — genuine indecision |
| Closes near low | 61,850 / 62,150 / 60,400 / 60,900 | $1,750 | −0.43 | Bounced, but sellers had the last word |
| Shooting star | 62,000 / 63,650 / 61,750 / 61,900 | $1,900 | −0.84 | Rallied hard, gave all of it back |
Illustrative prices constructed for this lesson, not a market snapshot. The point is the arithmetic, which holds for any instrument at any price.
The practical threshold: below roughly ±0.5, a candle is not saying anything. Be careful with the converse, though. Past ±0.5 is a direction, not a filter: on a pure random walk six candles in ten clear it (the test is further down), which is why size has to be checked first. What CLV does that a pattern name cannot is settle which way a big candle leaned, in one number, without an argument. And CLV has a property that pattern names do not — it is comparable. A +0.71 on Bitcoin and a +0.71 on a small-cap describe the same thing about how each period ended, which means you can rank candles instead of debating whether something is "really" a hammer.
Why can the exact same candle mean two opposite things?
Because the four numbers do not record the order events happened in. This is the compression loss, and it is the reason single-candle reading fails so often.
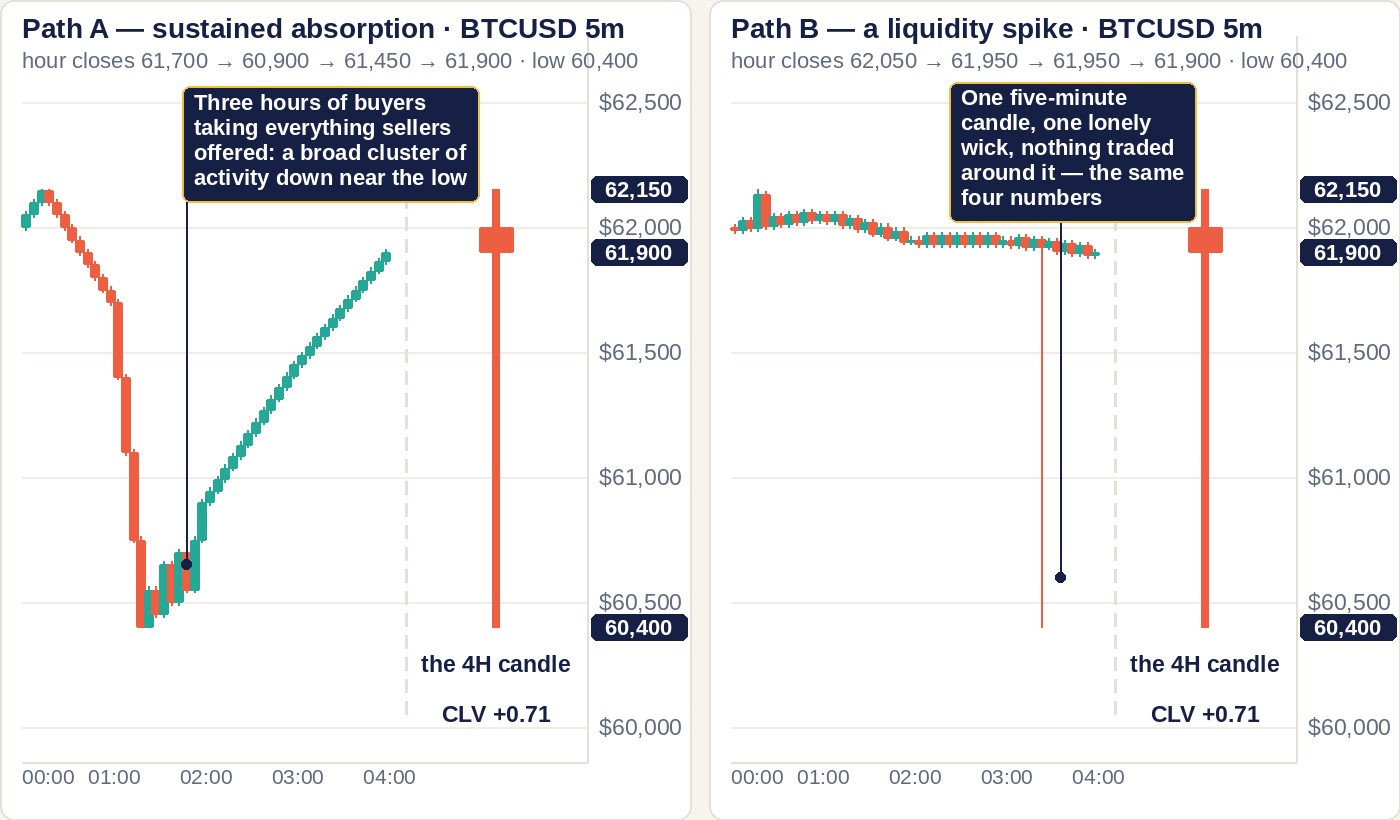
Take the hammer above — open $62,000, high $62,150, low $60,400, close $61,900. Here are two four-hour sessions that both produce it exactly, hour by hour:
| Hour | Path A — sustained absorption | Path B — a liquidity spike |
|---|---|---|
| 1st | Drifts down to $61,700 | Flat, closes $62,050 |
| 2nd | Flushes to $60,400, closes $60,900 | Flat, closes $61,950 |
| 3rd | Grinds back up, closes $61,450 | Flat, closes $61,950 |
| 4th | Continues up, closes $61,900 | One five-minute spike to $60,400, instantly recovers, closes $61,900 |
| Both aggregate to O $62,000 / H $62,150 / L $60,400 / C $61,900 — the identical candle. | ||
Path A is three hours of buyers steadily taking everything sellers offered. Path B is one order eating through a thin book at a quiet hour, with essentially nobody buying on the way back — the price simply returned to where it had been all along because there was never any real selling. Path A is meaningful. Path B is a liquidity artefact, and on a thin pair it happens constantly. Traders have a name for the trade Path B invites: a bear trap — a flush under a level that recruits sellers, then reverses on them. The mirror image, a spike above a level that pulls buyers in before dropping back, is a bull trap. Both are Path B with a position attached, and the series that most reliably tells Path B from Path A before you are in the trade is volume, which is Lesson 14.
The candle cannot distinguish them. You can, in about five seconds: drop to a lower timeframe and look at the same window. Path A shows a broad cluster of activity down near the low; Path B shows one lonely spike surrounded by nothing. This is the single highest-value habit in this lesson, and it costs one click.
Does the candle exist, or did the exchange clock invent it?
This is the part that should change how much weight you put on intraday patterns, and it is almost never taught.
A candle boundary is a decision, not a fact. Crypto trades continuously — there is no bell. When your chart shows four-hour candles, some software decided they start at 00:00, 04:00, 08:00 UTC and so on. That choice is a convention. Move it, and every candle on the screen changes shape while the trades stay exactly the same.
Here is the demonstration, using eight hours of hourly candles:
| Hour (UTC) | Open | High | Low | Close |
|---|---|---|---|---|
| 22:00 | 61,850 | 62,050 | 61,800 | 62,000 |
| 23:00 | 62,000 | 62,100 | 61,900 | 62,000 |
| 00:00 | 62,000 | 62,150 | 61,600 | 61,700 |
| 01:00 | 61,700 | 61,750 | 60,400 | 60,900 |
| 02:00 | 60,900 | 61,500 | 60,850 | 61,450 |
| 03:00 | 61,450 | 61,950 | 61,400 | 61,900 |
| 04:00 | 61,900 | 62,100 | 61,800 | 62,050 |
| 05:00 | 62,050 | 62,200 | 61,950 | 62,150 |
Group hours 00:00–04:00 into one four-hour candle and you get the open of the first hour ($62,000), the highest high ($62,150), the lowest low ($60,400) and the close of the last hour ($61,900). That is our hammer, CLV +0.71. Textbook bullish reversal.
Now group the same tape starting two hours earlier, 22:00–02:00: open $61,850, high $62,150, low $60,400, close $60,900. CLV −0.43. A candle closing in the lower third of its range — textbook bearish continuation. And the candle after it, 02:00–06:00, comes out at open $60,900, high $62,200, low $60,850, close $62,150 — CLV +0.93, a near-marubozu.
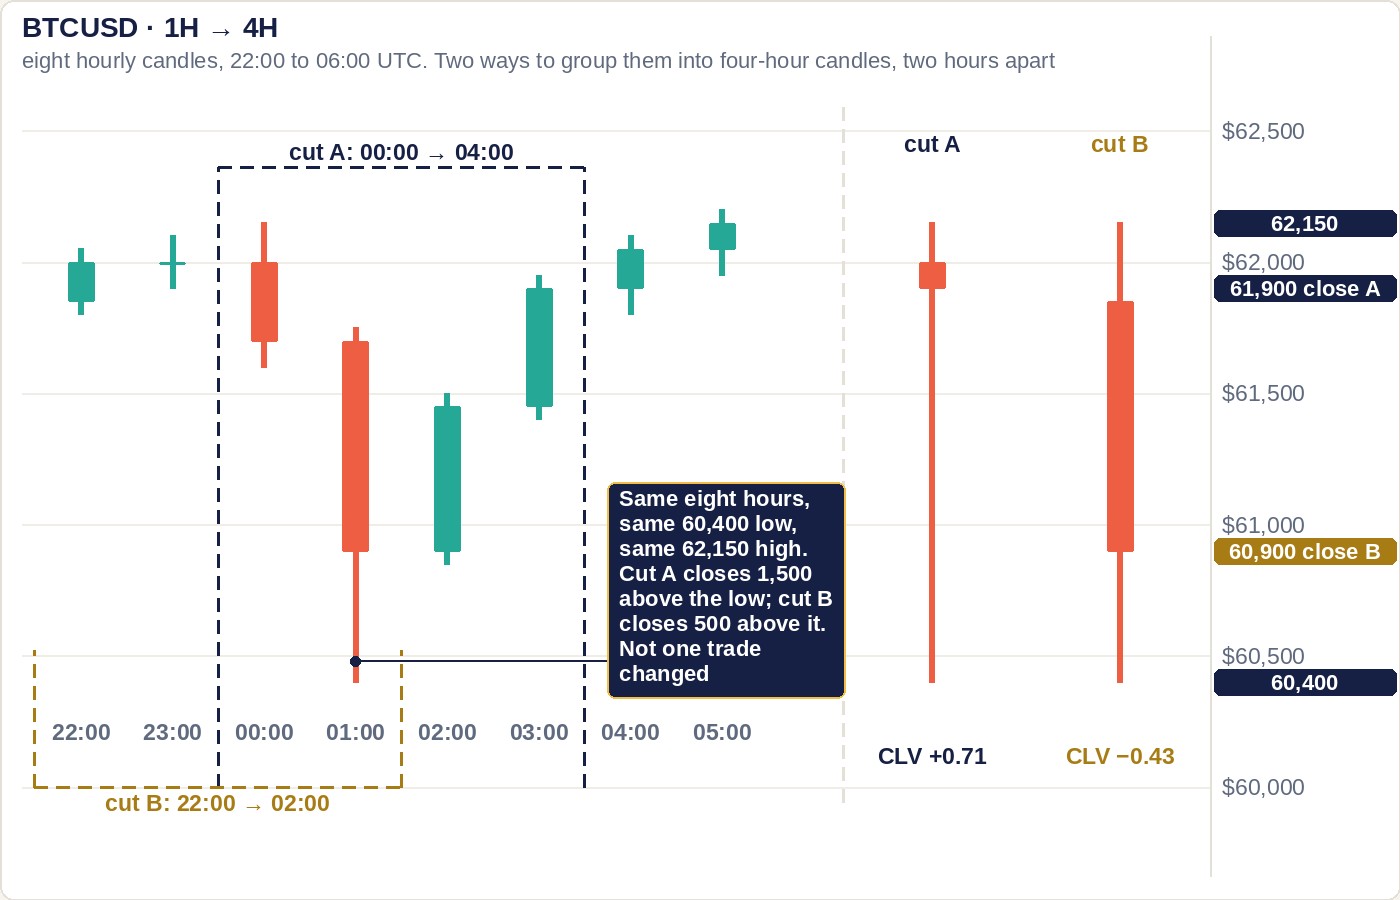
So the same eight hours are either "a hammer, then follow-through" or "a bearish close, then a violent reversal". Both are true. Neither is the market's opinion; both are the clock's. The pattern is partly a property of where somebody decided to start counting.
Two consequences worth carrying:
- The higher the timeframe, the less this bites. A daily candle boundary is at least shared — funding settles on it, exchanges report on it, and a great many participants look at the same one. A 15-minute boundary is shared by nobody in particular. This is a concrete reason daily and weekly candle patterns hold up better than intraday ones, and it has nothing to do with "more data".
- If a pattern only appears on one boundary, it is not a pattern. A genuinely significant candle — one built on a real event, a real flush, a real level — leaves a mark whichever way you slice it. If nudging the boundary makes it vanish, you found an artefact, not a signal.
So how should you actually read a candle?
In four questions, asked in this order. The order matters, because the first and third throw out most candles before you have wasted any thought on naming them. A fifth question — how much trading it took to print that close — is answered in Lesson 14 on volume.
Question 1 — is it even unusual? Take the candle's range (high minus low) and divide by the average range of the last twenty candles on that timeframe. Suppose the average is $900. Our hammer has a range of $1,750, so it scores 1.9× — genuinely large. A textbook-shaped hammer with a $620 range on the same chart scores 0.7×, which means it is an ordinary candle that happens to look like something. Under about 1.5×, stop here. This one filter removes more bad trades than any pattern knowledge ever will.
Question 2 — where did it close in its own range? That is the CLV. Past ±0.5, keep going. Between them, it is indecision however dramatic the wicks look.
Question 3 — where on the chart did it happen? A high-CLV candle in the middle of a three-week range is a big candle in a place nobody cares about. The same candle at a level price has turned at before is somebody defending something. Shape without location is decoration.
Question 4 — what did the next candle do? A hammer that is followed by a candle closing above its high has been confirmed by other people acting on it. A hammer followed by a close below its low was a failed bounce, and the failure is often a stronger signal than the original pattern. Waiting one candle costs you a little entry price and removes a large fraction of false reads.
How many noise candles get past each question?
We checked, because a filter that lets most random candles through is not a filter. We generated 20,000 four-hour candles from a pure random walk — each candle built from 48 five-minute Gaussian steps, no drift, no levels, no news — and ran questions 1, 2 and 4 on every one of them. Question 3 cannot be tested this way: a random walk has no memory, so it has no levels. That is exactly why question 3 is the one that separates a candle from noise.
| Filter | Random candles that pass | What it tells you |
|---|---|---|
| Question 2 alone: |CLV| > 0.5 | 61.9% | Six noise candles in ten close in their outer quarters. On its own the CLV threshold removes almost nothing. |
| Question 1 alone: range ≥ 1.5× the 20-candle average | 9.1% | Nine candles in ten are ordinary-sized. This is where most of the filtering happens. |
| Questions 1 and 2 together | 7.7% | Big candles usually close near an extreme anyway, so CLV barely thins the survivors of question 1. |
| Bullish candidate: question 1 passed and CLV > +0.5 | 3.8% | One candle in 26 — one or two a week on a four-hour chart — looks like our example for no reason at all. |
| Question 4: next candle closes above the candidate's high | 45.9% of candidates | Noise "confirms" itself almost half the time, against a 27.2% base rate for any candle. Confirmation halves the false reads; it does not remove them. |
Conditions, so you can repeat it: Python random.Random(10), price starts at 62,000, each five-minute step drawn from a normal distribution with mean 0 and standard deviation 45, 48 steps per candle, 20,000 candles, the first 20 skipped for the average. Three other seeds gave 8.9–9.1%, 61.9–62.9%, 7.6–7.8%, 3.8–4.1% and 43.1–45.9%. The percentages barely move with 16 or 240 steps per candle, so they are not an artefact of the step size.
Two things fall out of that table. The CLV threshold is a direction, not a filter — it tells you which way a big candle leans, and it sits second because on its own it passes six candles in ten. And confirmation is necessary but weak: nearly half of random candidates get "confirmed" by the next close. Questions 1 and 4 together still let roughly 1.7% of pure noise through, one candle every ten days or so on a four-hour chart. The only thing that stops a noise candle is that it has nowhere meaningful to happen — question 3.
Applied to our example: 1.9× range, CLV +0.71, at the low of a four-candle decline, and the following candle closed at $62,800 — above the hammer's high of $62,150. Four for four. That is what a candle actually being worth something looks like, and note that at no point did we need the word "hammer".
One thing a single candle can never give you is context: whether the price it printed matters because the market has turned there before. That comes from marking the areas where reactions repeat — see Lesson 12 on support and resistance, which uses the same closes you just learned to read to build a band rather than a line.
Once you can score a single candle, the named shapes become checkable rather than decorative. Lesson 24 takes the classic patterns — hammer, engulfing, doji — converts each shape rule into the same kind of number used here, and then prices the trade, which is where most of them quietly fail.
When is everything above the wrong lens?
Candle anatomy also decides something you will need two lessons later: whether you anchor a diagonal line to wick extremes or to body edges. Mixing the two is how a trendline ends up unable to be wrong — see Lesson 13 on trendlines and channels.
Three situations, and knowing them stops you over-applying this.
On daily and weekly candles, the boundary objection largely dissolves. The daily close is a genuine reference point that a huge number of participants and systems key off. A weekly close is even more so. If you trade higher timeframes, treat the boundary criticism as minor and weight the candle more heavily than this lesson otherwise implies.
If you trade a system with fixed entry rules, single-candle reading may be a distraction. Candles are a lens for discretionary reading. A tested rule set that does not reference candle shape does not become better by having candle opinions bolted onto it — it becomes harder to evaluate, because you can no longer tell which part produced the result.
Confirmation, on its own, is weaker than it feels. In the random-walk test above, 45.9% of bullish candidates were "confirmed" by the next close for no reason at all. The confirmation step earns its place by removing the other 54%, not by proving anything — which is why question 3, location, has to be answered before question 4 counts for much. A confirmed candle in the middle of nowhere is still, more often than not, nothing.
And CLV is a summary, which means it hides things. A CLV of +0.71 says nothing about whether the range was $50 or $5,000, which is exactly why question 1 exists and must come first. Read on its own, CLV will happily tell you that a nothing candle is bullish. It is a scoring tool inside a process, not the process.
Common mistakes
Reading colour instead of position. Our hammer has a red body and is one of the more bullish candles on the chart; the body is two instants, the CLV is the whole period. Naming the pattern first. Once you have said "hammer" out loud you are looking for reasons to keep it, not testing it. Score it, then name it if you must. Trading a pattern in the middle of nowhere. Location is doing most of the work in every candle read that ever worked. Treating a long wick as proof of buying. On a thin pair it is often proof of the opposite — that there was nothing there to trade against. Ignoring volume. It is the missing half of the candle: the same shape on twice the volume is a different event. Taking intraday patterns as seriously as daily ones. The boundary that produced them was arbitrary. Skipping the confirmation candle to get a better entry. The price you save is small and the reads you avoid are not. Assuming a wick low is the wick low. It is one venue's, and the next venue's may be materially different.
FAQ
What does a candlestick actually tell you? It tells you four prices for a fixed slice of time: where trading opened, the highest price reached, the lowest price reached, and where it closed. The body is the distance between open and close; the wicks are the distance from the body out to the extremes. That is the whole content. It does not tell you the order in which those prices happened, how much money changed hands, or who was buying — which is why a candle read on its own, without volume, level and the candle that follows, is a guess with a Japanese name attached.
Is a hammer candle a reliable buy signal? Not by itself. A hammer is only a shape: a small body sitting on a long lower wick, which means price was pushed well below the open and recovered before the close. That shape can be produced by genuine sustained buying, or by a single thin-liquidity spike that snapped back in seconds. Those are opposite situations and they print the same candle. A hammer becomes evidence when its range is unusual against recent candles, it forms at a level that was defended before, and the next candle follows through. Without those three, it is noise.
What is close location value and how do you calculate it? Close location value, or CLV, turns a candle's shape into a single number between -1 and +1. The formula is ((close - low) - (high - close)) divided by (high - low). A close right at the high gives +1, a close right at the low gives -1, and a close at the midpoint gives 0. For a candle that opened at 62,000 dollars, reached 62,150, fell to 60,400 and closed at 61,900, the CLV is (1,500 - 250) / 1,750 = +0.71. It is more useful than a pattern name because it is comparable across instruments and cannot be argued about.
Do candlestick patterns still work in crypto? The shapes still form, but two things make them weaker in crypto than in the markets they were designed for. Crypto trades continuously, so there is no daily open and close that a whole market has agreed on — the boundary of every intraday candle is an arbitrary choice by the exchange, and shifting it by two hours can turn a bullish hammer into a bearish candle from identical trades. And thin books mean a single large order can print a long wick that represents almost no real trading. Patterns on daily and weekly candles hold up better, because the boundary is at least shared.
See these patterns on a live chart
Candles only teach you anything once you are watching them form in real time. Any exchange chart will do — what matters is that the timeframe and the pair are ones you actually care about.
Compare the three exchanges we use →
That page carries referral links and says so up front — including what each venue does badly.
Keep the whole course next to your charts
The whole slide course — ten free PDF parts, 351 pages.