Doji and indecision — gravestone, dragonfly and spinning tops
Most guides give the doji one line: open and close nearly equal, indecision, wait for confirmation. That line hides three quite different events under one word, leaves the key term undefined, and never mentions that the prettiest version of the pattern hands you the widest stop on the chart. This lesson fixes all three. It turns “almost equal” into a number you can check, separates the gravestone, the dragonfly and the spinning top into the three different fights they actually record, and measures how often each one shows up in a market where nothing at all is happening — which turns out to be the most useful number in the whole subject.
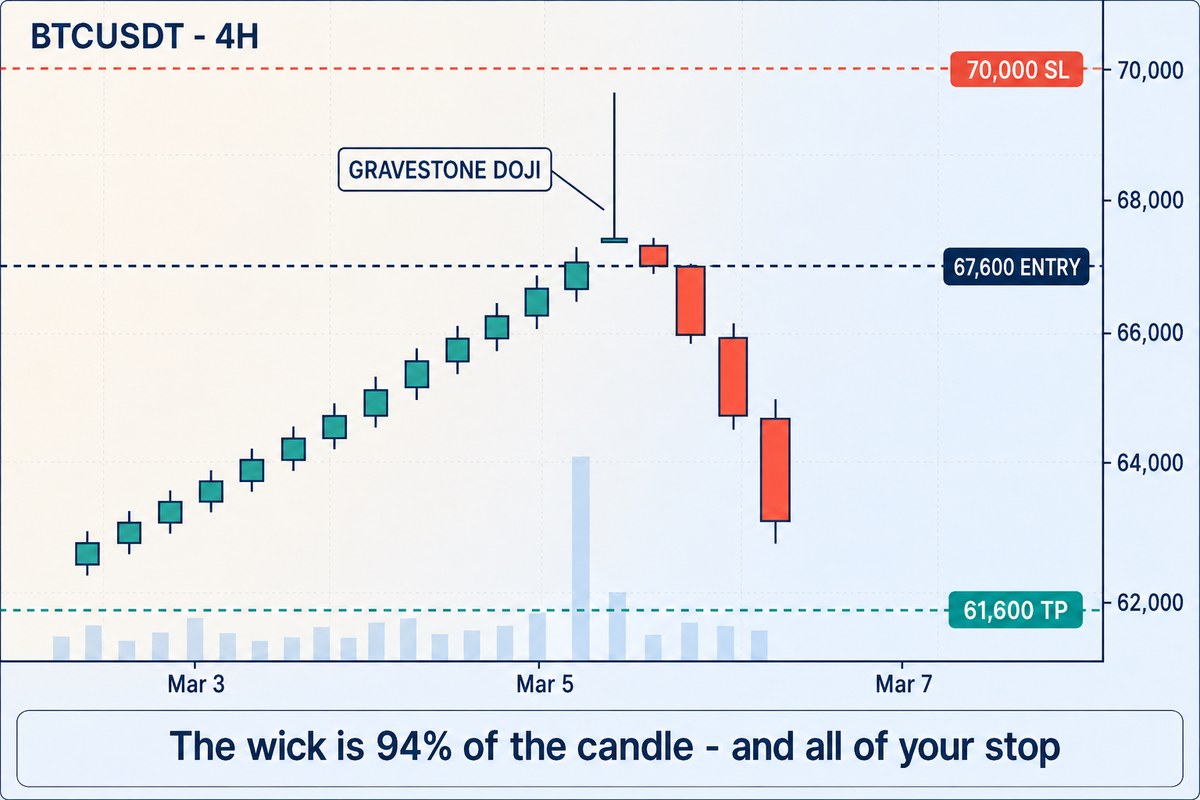
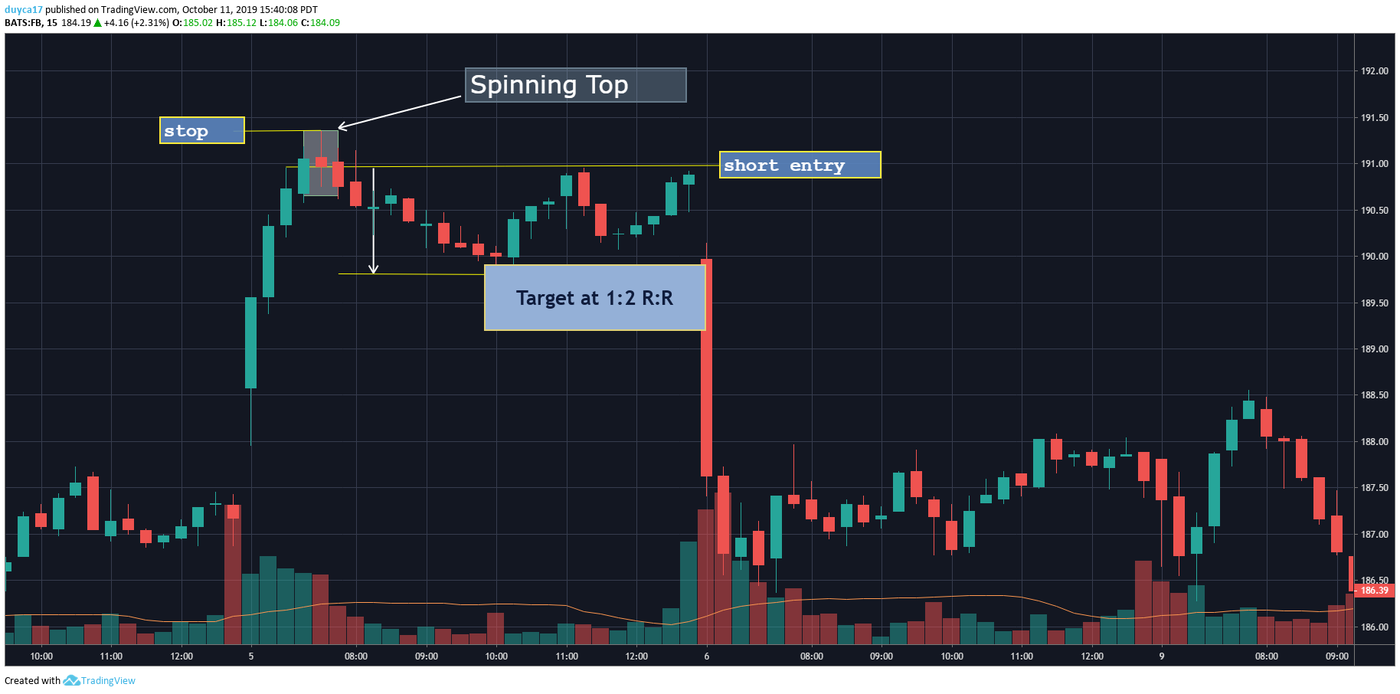
Illustrative example with hypothetical numbers. The levels are labelled against the price scale, but the drawing is not to exact scale — the traded distances are in the table under “Where do the entry and the stop actually go?”
KEY TAKEAWAYS
- “Almost equal” needs a number, and the number is the whole system. Body ≤ 2% of range fires on 1.74% of candles; body ≤ 20% fires on 17.99%. Same word, 10.3× the trades.
- Location does 6.59× more filtering than shape. Spinning tops are 11.86% of all candles; spinning tops at a 20-candle extreme are 1.80%.
- Indecision candles avoid the extremes. The shape-plus-location pair is only 0.59× as common as independence predicts — a tiny body rarely drags price to a new extreme.
- The textbook-perfect dragonfly closes at its high, so your stop is the whole candle. 97.29% of range versus 84.68% for an ordinary hammer — 4.20 points of break-even win rate.
- A spinning top appears 11.4 times a day on a 15-minute chart. Trends do not end 11 times a day, so on fast charts the shape cannot be the signal.
What is a doji actually telling you?
That a whole session was fought and finished level. Everyone who bought is where they started, everyone who sold is where they started, and the market has told you nothing about direction — only that the argument is unresolved.
Lesson 24 put the doji in one row of a table: open and close nearly equal, both sides showed up, neither won. That row is where this lesson begins, because it hides three completely different fights inside one name.
A gravestone doji is not indecision at all. Price ran to a new high and was thrown back the whole way before the candle closed. Somebody was waiting up there with size. That is a defeat at a specific price, and the price is on your screen.
A dragonfly doji is the same defeat pointing the other way: sellers dragged price down, and by the close the entire decline had been erased.
A spinning top is the only one of the three that really is indecision. Both wicks are long and roughly equal, so both sides went somewhere and both were pushed back. Our course notes are careful about the claim it makes: at the top or bottom of a trend, a spinning top says the side that had been controlling price no longer has enough to keep the trend going. That is running out of fuel. It is not a reversal, and calling it one is the first mistake in this lesson.
So one name, three fights, three different trades. Before any of that can be used, though, there is a word to deal with.
How small does the body have to be before it counts as a doji?
Nobody tells you, and that omission is the single most expensive thing about this pattern. “Open and close almost equal” is not a definition. It is a definition shaped hole that every trader quietly fills with whatever number lets them take the trade they already wanted.
Make it a number and the hole closes. Write the candle's height as its range R = high − low and its body as B = |close − open|, then a doji is simply B ≤ t × R for some threshold t you have to choose. Everything downstream depends on that one choice, so it is worth seeing what it does.
To measure that we need a baseline — how often each shape turns up when nobody is doing anything at all. So we simulated a driftless random walk: 400,000 candles, each built from 60 sub-steps so the open, high, low and close come from a real price path rather than being made up, volatility set to 0.4% per candle, seed 20260903. There is no trend in this data, no news, no participants and no memory. Whatever shows up is an accident. That is exactly what makes it useful: it is the floor. Anything that appears this often by accident cannot, on its own, be evidence that somebody meant something.
| Threshold you pick | Candles that qualify | In plain terms |
|---|---|---|
| Body ≤ 2% of range | 1.74% | 1 in 57 — genuinely rare |
| Body ≤ 5% of range | 4.41% | 1 in 23 — the threshold this lesson uses |
| Body ≤ 10% of range | 8.90% | 1 in 11 |
| Body ≤ 20% of range | 17.99% | 1 in 5.6 |
| Body ≤ 30% of range | 27.51% | 1 in 3.6 — a quarter of every chart |
Moving from 2% to 20% multiplies your signal count by 10.3. Two people can both say they “trade doji candles”, both be telling the truth, and be running systems that fire an order of magnitude apart. Neither has said anything false. Neither has said anything useful either.
The practical instruction is short. Pick your t, write it down, and never adjust it on a day when you want a trade. If you find yourself wondering whether a body is small enough, it is not — and that hesitation is worth more than the trade.
What is the difference between a gravestone, a dragonfly and a spinning top?
Where the wick is. That is the whole distinction, and it is the reason the three trade completely differently despite sharing a name.
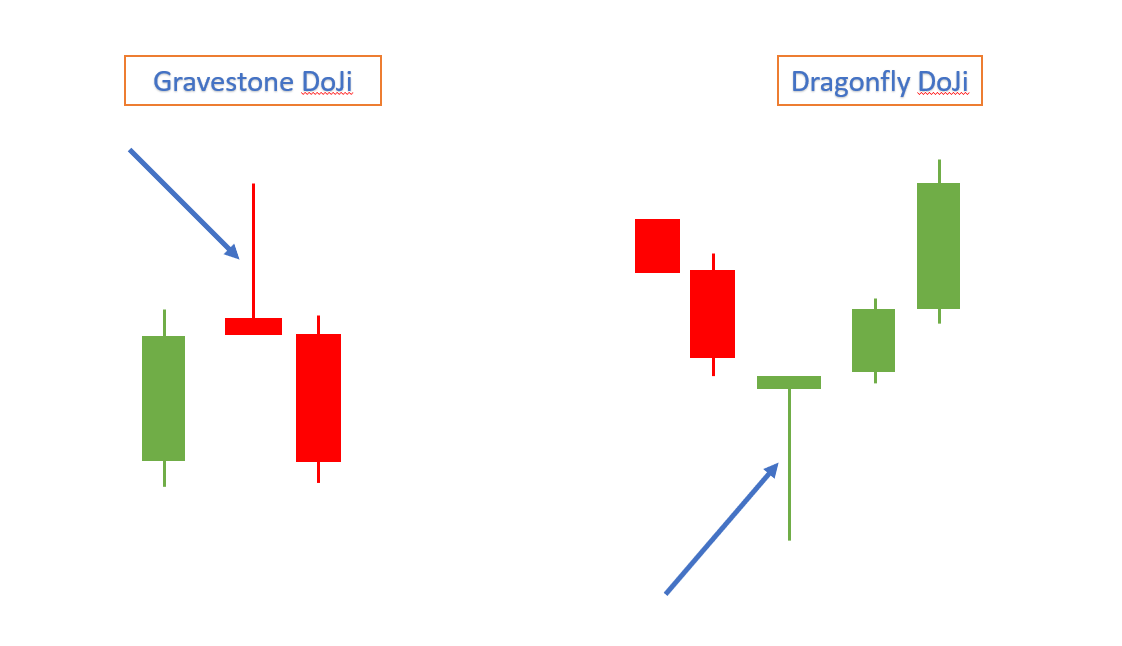
Put the same three rules in numbers, using U for the upper wick and W for the lower wick, both measured as a share of the candle's range:
| Shape | Rule in numbers | Where it must stand | What it claims | Random-walk rate |
|---|---|---|---|---|
| Gravestone doji | B ≤ 5%R and W ≤ 5%R, so U ≥ 90%R | Top of a rise | Buyers reached a new high and were sent all the way back | 0.193% — 1 in 519 |
| Dragonfly doji | B ≤ 5%R and U ≤ 5%R, so W ≥ 90%R | Bottom of a fall | Sellers reached a new low and the whole decline was erased | 0.183% — 1 in 546 |
| Spinning top | B ≤ 30%R, U ≥ 25%R, W ≥ 25%R | Top or bottom | Whoever was in control no longer has enough to continue | 11.86% — 1 in 8.4 |
| Long-legged doji | Spinning top rules, but B ≤ 5%R | Top or bottom | A spinning top with the body squeezed six times tighter | 2.53% |
Two details in that table save real money.
The colour of the body is not a rule. Our course material says it plainly for all three shapes: green or red, it does not matter. If the body is 2% of the range, the difference between a green one and a red one is a rounding error that the chart happens to paint in a strong colour. Reading meaning into it is reading meaning into a pixel.
The last column is not a win rate. It is how often the shape appears in a market with nobody in it. A dragonfly doji is not “right 0.183% of the time”; that number says the shape is rare enough to be worth noticing, and nothing more.
There is also a family resemblance worth naming. A dragonfly doji is geometrically almost a hammer — long lower wick, small body, little upper wick. The difference is only how strict you are. Of every candle in our data that qualifies as a hammer shape, just 2.59% are strict enough to also be a dragonfly doji. The dragonfly is the top two and a half percent of hammers. That is genuinely useful information, and it comes with a bill attached, which is the next section but one.
Where do the entry and the stop actually go?
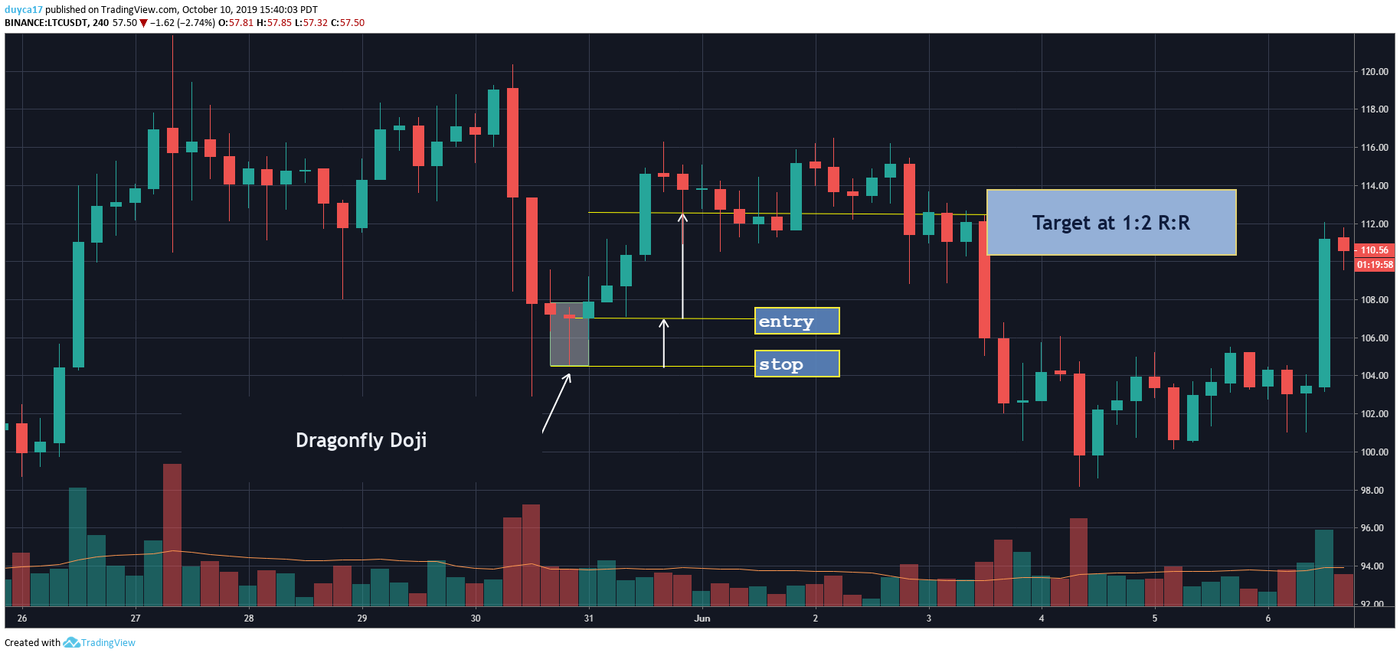
Entry on the candle after the doji; stop on the far side of the long wick. That is the whole placement, and our course teaches it the same way for every single-candle signal: the doji is the event, the next candle is the confirmation, and the wick is the level that has to be wrong for you to be wrong.
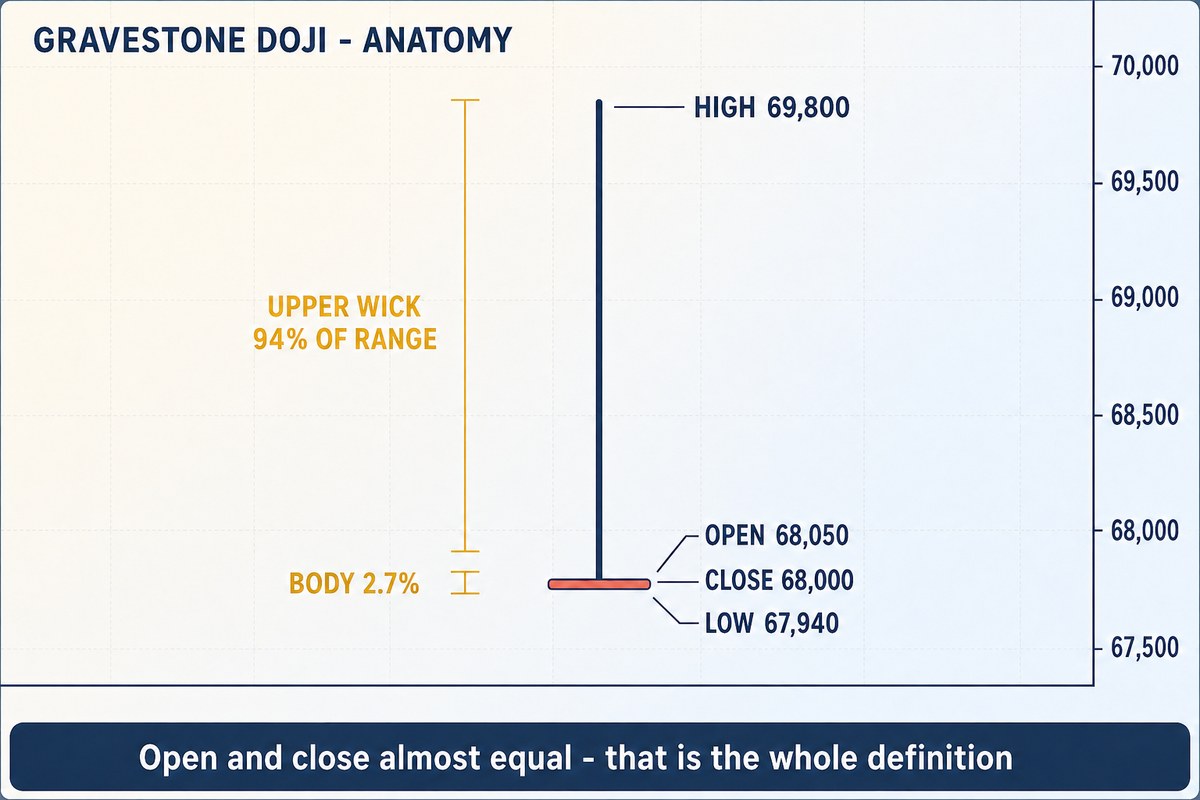
Take a worked gravestone (illustrative numbers, chosen so you can check every step). A 4-hour candle prints open 68,050 · high 69,800 · low 67,940 · close 68,000 at the top of a rise. Run the rules:
- Range R = 69,800 − 67,940 = 1,860
- Body = |68,000 − 68,050| = 50, which is 2.7% of range — inside the 5% threshold ✓
- Lower wick = 68,000 − 67,940 = 60, or 3.2% — effectively absent ✓
- Upper wick = 69,800 − 68,050 = 1,750, or 94.1% of the candle ✓
It qualifies. Now price it. The next candle closes at 67,600 and that is your short entry. The stop has to sit above the wick, so call it 70,000. The nearest support below is 61,600 and that is the target.
| Level | Price | Distance |
|---|---|---|
| Stop | 70,000 | Risk h = 2,400 |
| Entry | 67,600 | — |
| Target | 61,600 | Reward = 6,000 |
| Reward-to-risk | 2.50R — break-even win rate 28.6% | |
Using the identity from Lesson 24, where D is the stop-to-target distance: R:R = D ÷ h − 1 = 8,400 ÷ 2,400 − 1 = 2.50. Same answer, four seconds of arithmetic, and you can do it before the confirmation candle closes.
Now notice the number nobody quotes. The doji's own range was 1,860, but your risk is 2,400 — 129% of the candle you are trading. Waiting one candle for confirmation moved the entry down and widened the stop, taking this trade from 3.20R to 2.50R. Whether that is worth paying is priced in Lesson 24; the point here is that the doji does not set your risk, the doji plus the wait does.
Why does the textbook-perfect doji give you the worst reward-to-risk?
Because the thing that makes it perfect is the thing that puts your entry at the worst possible point on the candle.
Read the definition of a dragonfly doji closely. Our course notes say the open, the close and the high are all almost identical. That is not decoration — it means the close sits at the very top of the candle. And if you enter near the close and put your stop under the low, your stop is the entire range of the candle. There is nowhere further from the low that you could possibly have entered.
We measured it. Taking the entry at the close and the stop just under the low, the stop distance as a share of the candle's range comes out at:
| Candle | Stop as % of the candle's range | R:R with a target 3× the range away | Break-even win rate |
|---|---|---|---|
| Ordinary hammer | 84.68% | 2.54R | 28.23% |
| Dragonfly doji | 97.29% | 2.08R | 32.43% |
| Any candle at all | 50.01% | — | — |
The prettier candle costs 4.20 percentage points of win rate. You have to be right 32.4% of the time instead of 28.2% to end up in the same place, and you are paying that purely for geometry — before the market has done anything.
The penalty depends on how far away your target is, which is the useful part. With a target only twice the candle's range away the gap widens to 6.30 points; push the target out to four times the range and it narrows to 3.15. If you are going to trade the strict shape, give it room, because a tight target on a wide stop is the one combination where the geometry really bites.
It is worth keeping this in proportion. Compared with the other costs this course has measured — waiting for confirmation on an engulfing at 12.3 points, or stacking three agreeing indicators at 33.3 points — 4.20 points is the cheapest tax in the series. The strict shape is a real filter and it is not expensive. It is just not free, and the textbooks that recommend it never mention the bill.
If a spinning top means the trend is ending, why does it appear eleven times a day?
Because on its own it does not mean the trend is ending. It is the most common shape in this lesson by a wide margin, and once you see how common, the claim collapses under its own weight.
At 11.86% of all candles, here is how often a spinning top turns up in a market where absolutely nothing is happening:
| Your chart | Spinning tops per day | Strict doji (body ≤ 5%) per day |
|---|---|---|
| 15-minute | 11.4 | 4.2 |
| 1-hour | 2.9 | 1.1 |
| 4-hour | 0.7 | 0.3 |
| Daily | 0.1 | 0.04 |
A trend does not end eleven times a day. So on a 15-minute chart the spinning top cannot be a signal — there are not enough real turning points in a day to go round. On the daily it fires roughly once a fortnight, which is at least the right order of magnitude for something that claims a trend is out of fuel.
This is not an argument against short timeframes; Lesson 11 covers what each chart is for. It is an argument about arithmetic. The same shape carries different information on different charts because the supply of it is different, and the supply is something you can count.
One more clause from the course material tightens things usefully. A spinning top is supposed to have upper and lower wicks that are almost equal — neither side in control. Enforce that as |U − W| ≤ 20% of range and the population drops from 11.86% to 6.98%. That single clause removes 41% of the candidates, and it costs you nothing to apply.
Why are indecision candles rarer at the extremes than chance predicts?
Because to make a new extreme, a candle has to travel — and travelling means having a body. The shape and the location are mechanically at odds, and this is the most counter-intuitive number in the lesson.
In our data, 25.52% of candles set a new high or low for the trailing 20 candles. Spinning tops are 11.86% of candles. If shape and location had nothing to do with each other, spinning tops sitting at a 20-candle extreme would be 11.86% × 25.52% = 3.03% of the chart.
The measured figure is 1.80%. That is 0.59× what independence predicts — indecision candles are 41% less likely to sit at an extreme than chance. Put the other way round: a randomly chosen candle has a 25.52% chance of being a 20-candle extreme, but a spinning top has only a 15.18% chance.
The mechanism is obvious once stated, which is what makes it worth stating. The median spinning top has a body of just 12.6% of its range, against 51.6% for an ordinary candle. A candle that finishes where it started rarely drags price to a level it has not seen in 20 bars. The very thing that makes an indecision candle readable — standing at an extreme, where there is a trend to run out of — is fighting its own shape.
Three consequences follow, and they matter more than the number itself.
Location is doing most of the work. Adding one condition — the candle must sit at a 20-candle extreme — cuts spinning tops from 11.86% to 1.80%, a 6.59× reduction. Lesson 24 said position matters more than shape. This is that claim with a number on it.
The complete setup is properly rare. A gravestone doji standing at a 20-candle high occurs on 0.012% of candles — one in 8,163. A dragonfly at a 20-candle low: one in 7,407. On a 4-hour chart that is roughly one every three and a half years per instrument. This is a pattern you scan for across many charts, or wait for patiently, or both. It is not a daily routine.
And that rarity is precisely why people wreck it. Nobody sits still for one in 8,000. So they relax the shape rule — and from the second section of this lesson we know exactly what relaxing does: 2% to 20% is ten times the signals. The trader who widens the threshold to find setups has not found more setups. They have found ordinary candles and given them a Japanese name.
How do you run the check, in order?
Order matters, because each step is cheaper than the one after it and three of the five can end the check before you have looked at a single price.
- Is there a trend for it to interrupt? No prior move, no signal — the shape claims someone ran out, and nobody can run out of something they never started. Diagnose trend or range first.
- Is the candle at an extreme of that move? Not near it, at it. This is the step doing 6.59× of your filtering.
- Does it pass your written threshold? Body ÷ range, compared against the number you wrote down before today. If you are squinting, it fails.
- Which of the three is it? Wick on top → gravestone, expect down. Wick below → dragonfly, expect up. Both wicks → spinning top, expect the trend to stall, which is not the same as reverse.
- Price it before you decide. Stop beyond the wick, entry on the next candle's close, target at the nearest real level. R:R = D ÷ h − 1. Below your floor, the setup is a no, however textbook it looks.
And one optional sixth step from Lesson 14: look at the volume bar under the candle. Lesson 24 covers what heavy versus light volume does to a doji's meaning, and it is the difference between absorption and an empty hour.
A small body on its own says the two sides finished level. Put one between two decisive candles and it becomes the middle beat of a morning star, which is a different claim altogether. Lesson 27 measures what that middle candle is worth: at a threshold of 30% of candle 1’s body it removes 72.6% of the sequences that would otherwise qualify, so it is doing real filtering rather than decorating the drawing.
When is everything above wrong?
The measured numbers in this lesson come from a simulation, and it is important to be exact about what that does and does not buy you.
A random walk has no trends, no participants and no memory. Every figure here is an accident rate — how often a shape appears when nothing is being decided. None of them is a win rate, and anyone quoting them as one has misread the lesson. What they establish is a floor: a shape that turns up on 11.86% of candles by accident cannot be self-evidently meaningful.
Volatility was fixed at 0.4% per candle. A thin altcoin, a one-minute chart, or the ten minutes after an unexpected headline will have a different wick-to-body distribution, so the base rates move. The direction of every conclusion survives; the specific decimals do not travel.
The thresholds are choices, not constants. 5% of range, 30% of range, 20-candle extreme — all picked for this lesson. Change them and the numbers change. That is not a flaw in the measurement; it is the finding.
And crypto has no closing bell. As covered in Lesson 24, a “daily” candle in crypto ends whenever your software says it does. A doji on your screen can be an ordinary green candle on someone else's chart with a different timezone setting. Fix your timezone, leave it fixed, and treat single-candle patterns on the exact daily boundary with a little suspicion.
One last note on thresholds, because the same hole turns up next door. A doji needs a number for “almost equal”; a tweezer needs one for “the same level”, and there the threshold is your stop. Lesson 26 measures it on this same simulation: loosening “same level” from 0.05% to 0.20% of price finds 2.84× as many tweezers, and at the loose setting one candle pair in five qualifies.
What are the most common mistakes here?
Calling a spinning top a reversal. The course material says the controlling side no longer has enough to continue. Running out of fuel and turning round are different events, and one of them happens far more often than the other.
Trading the shape without a written threshold. Without a number, “small body” expands on days you are bored. The 10.3× range between a 2% and a 20% rule is entirely inside your own discretion.
Reading the body's colour. On a 2%-of-range body, green versus red is noise the chart happens to paint loudly.
Taking the doji in the middle of a range. With no trend to interrupt, the candle is a candle. This is the step that ends most checks and it is free.
Assuming the strict shape is strictly better. The dragonfly's perfect close-at-the-high costs 4.20 points of break-even win rate against an ordinary hammer, purely from stop width. Worth paying, often. Worth knowing you paid it, always.
Widening the rules because nothing is setting up. One in 8,163 is genuinely rare. The honest responses are to watch more instruments or to wait. Loosening the definition is neither.
PRACTICE CORNER
This one takes about ten minutes and it is the only way the lesson sticks. Open a 4-hour chart of any liquid pair on the exchange you already use, and scroll back through the last three months. Every time you spot a candle whose body looks tiny, do three things in this order: measure body ÷ range against a 5% rule, check whether the candle sits at a 20-candle high or low, and only then look at what happened next. Count how many pass all three. If you find more than a handful in three months, your threshold has quietly widened — go back and measure again.
Affiliate disclosure: the links below are partner links. We may earn a commission at no cost to you. It does not change what this lesson says. Full disclosure.
What else do people ask about doji candles?
Is a doji bullish or bearish?
Neither, until you say where it is standing. That is not a dodge — it is the mechanism. The claim a doji makes is “one side reached a price and could not hold it”, and which side that is depends entirely on the move that came before. The identical candle is a gravestone at the top of a rise and a hopeful pause in the middle of a range. If someone tells you a doji is bullish without asking what preceded it, they are describing a picture rather than a trade. This is also why the location test does 6.59× more filtering than tightening the shape does.
Is a dragonfly doji just a hammer?
Close enough that you should treat what you already know about hammers as applying, and different enough to matter at the margin. Both have a long lower wick, a small body and little upper wick; the dragonfly is simply the strict end of that family. In our data only 2.59% of hammer-shaped candles are strict enough to qualify as dragonflies. The practical difference is the close: a dragonfly closes at the very top of its range, which is the most expensive place to enter, and that shows up as a stop 97.29% of the candle's range wide versus 84.68% for an ordinary hammer — 4.20 points of break-even win rate.
What timeframe are doji candles most reliable on?
Higher ones, and the reason is supply rather than anything mystical. A spinning top appears on 11.86% of candles regardless of timeframe, which is 11.4 a day on a 15-minute chart and about one a fortnight on the daily. Real turning points do not arrive eleven times a day, so on fast charts the signal is swamped by shapes that mean nothing. On the daily the frequency is at least in the same range as the thing being claimed. If you trade intraday, keep the shape but lean much harder on the location test.
Do doji candles work in crypto?
The mechanism does; the candle boundary is the weak point. A doji records a fight that finished level, and crypto has no shortage of fights. What crypto lacks is a session close, so where one candle ends and the next begins is decided by your charting software — commonly midnight UTC as of September 2026, but it shifts with your timezone setting. Two traders on the same pair can see a doji and an ordinary candle at the same moment. Fix your timezone once, and prefer the shapes whose meaning does not hinge on exactly where a boundary landed.