Trend or range — diagnosing the market before you trade it
Almost every losing streak a new trader has is a correct playbook run in the wrong market. The breakout rules were fine; they were applied inside a range that had no intention of breaking. The mean-reversion rules were fine too; they were applied inside a trend that never came back. So before any of the tools from this stage are useful, one question has to be answered out loud: is this market travelling, or is it oscillating? This lesson gives you a test that takes five seconds, the arithmetic that shows why getting the answer wrong is expensive in a very specific way, and a six-step order for making the call before you have money on it.
KEY TAKEAWAYS
- The first read is the RSI wave (Lesson 19): a valid cross from under 40 or over 60 is a trend; RSI inside 40–60 with no clean cross is a range. The structure check comes last: in a trend each pullback stops higher than the last; in a range it does not.
- A range fixes your reward and lets your risk grow. In a 100–110 box, 102 is the last entry that still pays 2R — the whole buying zone is the bottom fifth.
- Being six points late in a ten-point box costs 93% of the reward-to-risk. Being seven points late in a trend costs 41%.
- Two ranges of identical height are different trades. A 1.5-point stop is 1.67 average bars of buffer in a quiet range and 0.47 in a contested one.
- Do not wait for confirmation inside a range: by the time two frames agree the floor held, price is 3–4 points off it and the trade pays 1.33R at best, 0.91R at 104. The entry is the edge or nothing.
- “The market is ranging” is an unfinished sentence. Name the frame, then look one frame up — the box almost always belongs to the smaller frame.
What actually separates a trend from a range?
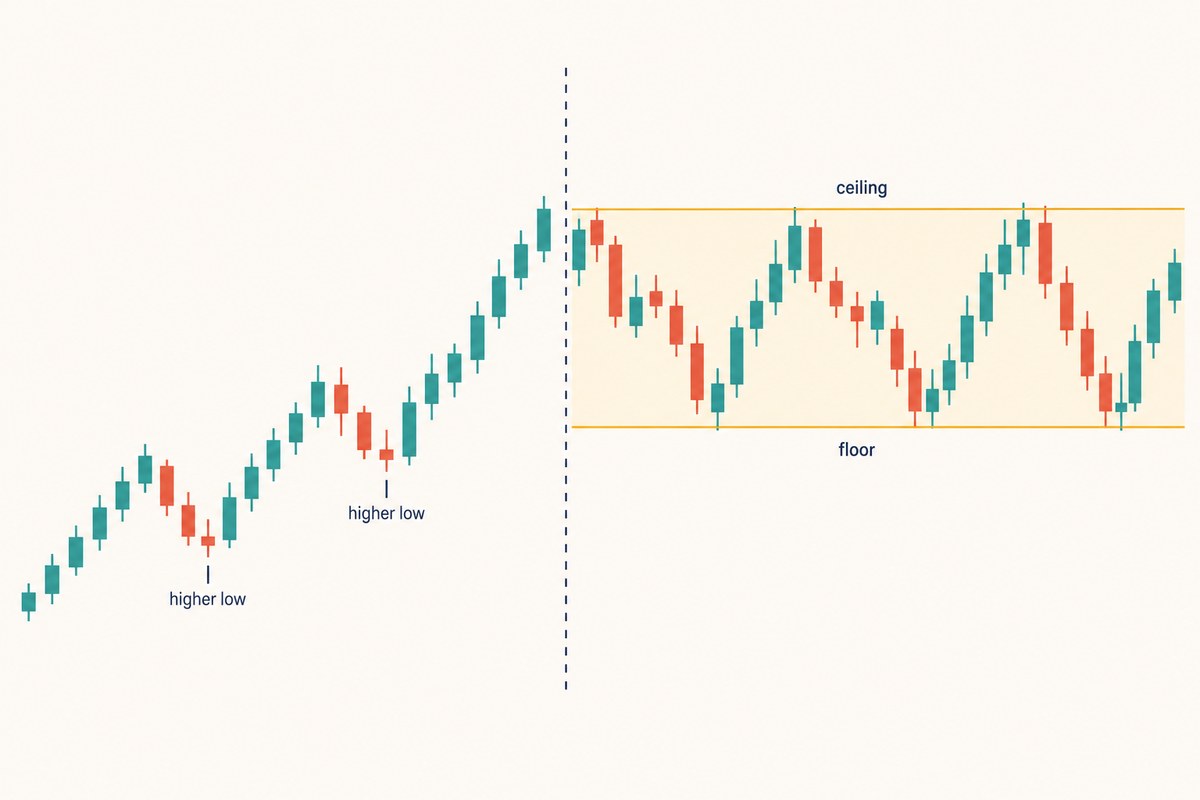
Whether the market is willing to keep paying more — and on this site that is read in a fixed order. First the RSI wave from Lesson 19: RSI crossing above both its EMA 9 and WMA 45 after coming from under 40, confirmed by the EMA 9 crossing above the WMA 45, is an up wave; the mirror from over 60 is a down wave; and RSI with no clean cross drifting inside 40–60 is sideways. A wave ends only when RSI is back inside 40–60, crosses the other way and the two averages cross back too — RSI crossing back on its own is a pullback inside the wave. Second the moving-average bundle on price, read on its own to confirm. Last, and least clear, the price structure this section describes: in a trend, each pullback stops at a better price than the last one. In a range, it does not. That five-second test is the check on the RSI call, not the call itself; the pattern names and the words “bullish” and “choppy” are commentary on top of it.
That test has a name and a notation, and they are worth learning because everything later in the path uses them: a pullback stopping higher is a higher low, and a push beyond the last peak is a higher high. Lesson 15 covers the full vocabulary — including the two arrangements where the highs and the lows disagree, which are exactly the cases this five-second test can misread.
Notice what the test does not ask. It does not ask whether price went up. Price can rise for a week and still be ranging, if every one of those rises came off the same floor and died at the same ceiling. It does not ask whether the candles look strong. It asks only whether the market is willing to keep paying more — and the evidence for that is where the pullbacks stop.

Read the left side of that chart and you can say something specific: buyers accepted 92.5, then refused to wait that long and accepted 97.5. Each time sellers pushed, they got less. Read the right side and you can say something equally specific and completely different: four separate attempts to get above 110 failed, and four separate attempts to break 100 failed too. Nobody is paying more. Nobody is accepting less. The same two prices keep working.
This is why “the trend is your friend” is such a dangerous half-sentence for a beginner. It is good advice inside a trend and it is the most expensive advice on the internet inside a range, because a range punishes precisely the behaviour a trend rewards: buying strength, adding to a winner, holding for more.

Why does the diagnosis matter more than the entry?
Because a range does something to your arithmetic that a trend does not: it puts a fixed ceiling on your reward while your risk keeps growing. Those two things move in opposite directions, so the cost of being a little bit late is not proportional. It is brutal.
Here is the calculation, with the box from the chart above. The floor is 100, the ceiling is 110. You are buying the floor with a stop at 98.5, just under it, and taking profit at 109, just under the ceiling. Now watch what happens as your entry slides higher while the stop and the target stay exactly where they are.
| Entry | Risk (entry − 98.5) | Reward (109 − entry) | Reward-to-risk |
|---|---|---|---|
| 100.5 | 2.0 | 8.5 | 4.25R |
| 101.0 | 2.5 | 8.0 | 3.20R |
| 102.0 | 3.5 | 7.0 | 2.00R |
| 103.0 | 4.5 | 6.0 | 1.33R |
| 104.0 | 5.5 | 5.0 | 0.91R |
| 105.0 | 6.5 | 4.0 | 0.62R |
| 107.0 | 8.5 | 2.0 | 0.24R |
Three numbers in that table are worth memorising.
102 is the last entry that still pays two to one. Solve (109 − e) ÷ (e − 98.5) = 2 and you get e = 102 exactly. The box is ten points tall, so if your minimum standard is 2R, your entire buying zone is the bottom fifth of the range. Not “the lower half”. The bottom fifth.
Past 104 you are risking more than the trade can pay. At 104 the reward-to-risk is 0.91 — below one. Just past the middle of the box, a mean-reversion long is a bet that loses more when it is wrong than it makes when it is right, and it is right nothing like often enough to survive that.
Six points of chase costs 93% of the edge, not 60%. Entering at 107 instead of 101 means paying six points into a ten-point box — 60% of its width. The reward-to-risk falls from 3.20 to 0.24, which is a loss of 92.6%. It compounds because each point you pay is added to the risk and subtracted from the reward at the same time.
That table is also why you cannot wait for confirmation inside a range. The instinct every other lesson in this stage trains — wait until the 4-hour and the 1-hour agree, wait for the higher low to print, wait for the close back above the floor — is exactly the instinct that walks you from 101 to 104. By the time two or three frames agree that the floor has held, price is typically three or four points off it, and the table prices that delay: 103 pays 1.33R, 104 pays 0.91R. Inside a range the entry is the edge or nothing, and the job confirmation would have done is done instead by the invalidation you write in advance (step 6 below). Confirmation belongs in trends, where the stop travels with the entry and waiting costs you 41%, not 93%.
Now do the same experiment in a trend, where the target is not a fixed price. Suppose you buy the first pullback at 101 with the stop under the last higher low at 98.5, and you are working toward a structural objective at 118. That is 17.0 of reward against 2.5 of risk: 6.8R. Miss it, wait for the next pullback, and buy at 108 — but the higher low has moved up with price, so the stop is now 105.5. Risk 2.5 again; reward 10.0. That is 4.0R.
Seven points late in the trend cost 41% of the reward-to-risk. Six points late in the range cost 93%. Same trader, same discipline problem, more than double the punishment — and the reason is structural rather than psychological. In a trend the stop travels with the entry, so risk stays roughly constant and only the distance to target shrinks. In a range the stop is nailed to the floor while the target is nailed to the ceiling, so being late attacks both sides of the fraction at once.
What does it actually cost to run the wrong playbook?
Enough to matter, but not in the way most people expect. Let us price it out with a $10,000 account and the same box, as an illustrative scenario rather than a historical record.
The trend playbook, run inside a range. You are a breakout trader, so you buy each break of 110 at 110.5 with a stop back inside at 108.5 — 2.0 points of risk — targeting a measured move to 120. Risking 1% is $100 per attempt, and a completed run to 120 pays 9.5 ÷ 2.0 = 4.75R = $475. Say the ceiling produces three false starts before the fourth break holds. Three losses of $100, then one win of $475: net +$175, or +1.75%.
The range playbook, run in the same range. Both directions, edges only, and risk cut from 1% to 0.5% = $50. The cut is a rule of the playbook, not a mood: the target is capped at the far edge, so the same risk buys less reward than it does in a trend, and one of your edge trades will eventually be the one the box breaks through. Some range traders go further, to 0.3%. Two longs at 101 pay 3.20R = $160 each. One short at 109 gets caught by the eventual breakout and loses $50. Net +$270, or +2.70%.
The right playbook made 54% more money on half the risk per trade. But look at the shape of the two equity curves, because that is the real lesson: the breakout trader was −3.0% at his worst point before the win arrived, while the range trader never went below −0.5%. Same market, same week, six times the drawdown.

And here is the part that is genuinely uncomfortable. The breakout playbook did not lose money in this range. It made 1.75%. Run this scenario once and you would conclude your method works fine. The break-even point is $475 ÷ $100 = 4.75 false starts, so at five failed breaks the same playbook turns negative. The number of times a ceiling gets poked before it gives way is the one input you cannot know in advance — which is why the honest reason to diagnose the state is not that the wrong playbook always loses. It is that the wrong playbook makes your result depend on a number nobody can forecast.
How many false starts does a real ceiling produce? We counted. Take BTCUSDT daily candles on Binance spot from March 2023 to September 2026 — 1,298 bars, as of September 2026 — and call a bar a breakout attempt whenever its high pushes above the highest high of the previous twenty closed bars. Then apply this lesson’s own acceptance rule: the attempt held if that bar closed above the level and the next bar closed above it too; otherwise it failed. That gives 173 attempts, of which 64 held (37%) and 109 failed. Counting the failures that piled up before each hold gives the number the breakout playbook lives on:
| Failed attempts before the one that held | 0 | 1 | 2 | 3 | 4 | 5 or more |
|---|---|---|---|---|---|---|
| Share of the 64 sequences (BTC daily, 2023–2026) | 45% | 8% | 20% | 11% | 8% | 8% |
The median sequence is one false start, the average is 1.64 and the longest was eight. Two things follow. First, on this chart the playbook would have been profitable on average — 1.64 losses of $100 against one win — if every held break went on to pay the full 4.75R of the model, which the count does not check; that is exactly why people keep running it inside ranges. Second, 7.8% of the sequences ran to five or more false starts, the point past which the same playbook is negative, and nothing visible at the first failed poke tells you which sequence you are in. The 45% with zero false starts are mostly trends: the “ceiling” was last week’s high in a rising market and it went on the first try — the trend playbook in a trend, working as designed. On the 4-hour chart the shape is the same and slightly worse: 595 attempts since March 2024, 35% held, 11% of sequences ran to five or more, the longest to fourteen. Same lookback, same acceptance rule, reproducible from public candle data.
Are all ranges the same kind of range?
No, and this is the distinction that separates people who trade ranges well from people who merely survive them. Two markets can print the same flat box for the same number of bars for opposite reasons.
A quiet range is a market nobody is pressing. Both sides have stopped pushing, so the bars get small and the box gets crossed slowly. A contested range is a market both sides are pressing hard, in opposite directions, with neither winning. The bars stay large or grow, and price crosses the whole box in a handful of candles.

You can tell them apart with one measurement that needs no indicator: compare the average bar range inside the box with the average bar range in the twenty bars before it. Smaller means quiet. The same or bigger means contested. That takes about a minute on any chart and it changes the trade completely.
Here is why it changes the trade. Take our ten-point box and a stop 1.5 points beyond the edge.
| Quiet range | Contested range | |
|---|---|---|
| Average bar range | 0.9 | 3.2 |
| Bars needed to cross the box | 11.1 | 3.1 |
| A 1.5-point stop is worth… | 1.67 average bars | 0.47 average bars |
| Stop needed for a 1.67-bar buffer | 1.5 | 5.33 |
| Reward-to-risk from an entry at 101 | 3.20R | 1.26R |
The identical setup — same box, same entry, same target — is a 3.20R trade in one range and a 1.26R trade in the other, a 60.5% reduction, purely because of how violently the box is being crossed. Do the last line yourself, because the trap is in the risk: keeping the 1.67-bar buffer in the contested range puts the stop at 100 − 5.33 = 94.67, so an entry at 101 now risks 6.33 points (the point down to the floor plus the 5.33 beyond it) against the same 8.0 of reward — 8.0 ÷ 6.33 = 1.26. Divide by the buffer alone and you get 1.50R, which flatters the contested trade by 19%; the point from your entry to the edge is risk too. And a stop that sits less than half an average bar beyond the edge, as the 1.5-point stop does in the contested case, is not a stop. It is a fee you pay for entering.
There is a second way to make this distinction, and it is the one this site reads first. Put RSI 14 on the box with its own EMA 9 and WMA 45: if the reading spends the whole box drifting inside 40 to 60 with no clean cross of its averages, that is the quiet case, because neither side is generating larger moves than the other; whereas if RSI still runs a wave while price goes nowhere, that is the contested case. The bar-size measurement above is the cross-check, and it earns its keep on very small frames of thin coins, where a 14-period RSI is noisier than on the daily chart of a large-cap. The wave rules are only reliable on liquid coins — roughly $5M or more traded per day; on thinner coins a single order can push RSI across its averages.
Which timeframe is the range on?
This is the question almost nobody asks, and it is the one that resolves most arguments about whether a market is trending. “The market is ranging” is an unfinished sentence. Ranging on the 4-hour? Ranging on the daily? Those are different claims about different charts, and they are routinely both true at once.
A range lives on a specific frame, and it is usually created by a disagreement between two frames. The pattern looks like this: your frame wants to turn, the frame above it is still pushing the old way, and neither wins. Price stops travelling and starts oscillating. The box that appears belongs to your frame, not to the frame above — the frame above is still inside its own move, and from up there your entire box is one candle of consolidation.
That has a direct practical consequence, and it is the most useful thing in this lesson: inside a box that belongs to your frame, you can only harvest swings from the frames below it. A daily range does not contain daily trends. It contains 1-hour and 4-hour swings, and those are what you trade. Trying to find a daily trend inside a daily range is looking for something the structure has ruled out.
It also tells you when to stop. If the box belongs to the 4-hour chart, the swings inside it belong to the 15-minute chart — and a 15-minute swing inside a 4-hour box is usually too small to be worth the screen time after costs. Lesson 11 made the general version of this point; here is the specific one: the smallest range worth trading is the one whose internal swings are still big enough to pay for the spread twice.
How do you make the diagnosis, in order?
In a fixed order, before the first trade, and written down. The RSI wave gives the label; these six steps turn the label into a trade. The order matters because the answer to step 1 changes the answer to everything after it.
Step 3 is the one that catches beginners. Two touches do not make a boundary — two points define a line through any two points, which is why a box drawn after two candles always looks convincing and usually is not. Let a third swing confirm both edges before you treat them as real. This is the same discipline the support and resistance lesson applies to individual levels, and the same one the trendline lesson applies to sloping ones.
Step 6 is the one that catches everyone else. Traders write a stop for the trade and forget to write a stop for the opinion. Give the diagnosis an invalidation in advance: “this stops being a range the moment a bar closes above 110 and the next bar holds above it”, or “this stops being a trend the moment a pullback breaks 97.5”. Without that sentence you will keep the label long after the market has dropped it, and you will keep running the playbook that goes with it.
This lesson diagnoses one chart at a time. Widen the question to several charts at once and the answer changes shape: a market can be a clean trend on the frame you are watching and a range at the level of your whole set, because the frames disagree. Bull, bear and sideways takes that view and prices it — including why a changeover between a bull and a bear phase has a hard floor you can calculate in advance (14 days for one weekly swing to confirm) and why the five real flips on BTC took 32 to 135 days.
When is this advice wrong?
Four situations, and they are worth more to you than the six steps.
When the diagnosis arrives after the fact. Everything above assumes you can name the state while you still have decisions to make. Labelling a box after price has left it is bookkeeping, not analysis. If you find that your ranges only become obvious in hindsight, the honest conclusion is not that you need a better indicator — it is that you should be flat until you can name the state in advance.
When a scheduled event is about to resolve the balance. A contested range is two sides pushing evenly. An unlock, an exchange listing, an index inclusion or a macro release can end that in one candle, with no bar-size warning beforehand, because the information arrives all at once rather than through trading. No amount of structure reading sees that coming. Know what is on the calendar for what you are trading.
When the box is thin enough to be moved. The whole model assumes the edges are made of real resting orders. In a market with little depth, a single sized order walks through the entire box, and what looked like a breakout was one participant and no acceptance. Lesson 9 covers how to check whether the depth is there; if it is not, treat both edges as suggestions.
When the “halve your size” rule cannot be executed. Cutting risk from 1% to 0.5% is sound in principle and impossible in practice if half your normal position is below the venue’s minimum order size, or if the resulting position is so small that fees eat the 3.20R down to something not worth taking. On a small account the correct range playbook is often to sit out rather than to trade a size you cannot control. Use the position size calculator to find out which case you are in before you decide.
What are the most common mistakes here?
| Mistake | Why it fails | Do this instead |
|---|---|---|
| Calling it a trend because price went up | Price rises inside ranges too — off the same floor, into the same ceiling | Check where the pullbacks stopped |
| Saying “the market is ranging” with no timeframe | It is an unfinished sentence; two frames can disagree and both be right | Name the frame, then look one frame up |
| Drawing the box after two touches | Any two points define a line; the box looks convincing and is a guess | Wait for a third swing to confirm both edges |
| Buying the middle of a range | Past 104 in a 100–110 box the trade pays under 1R even when it works | Bottom fifth only, or no trade |
| Using the same stop width in every range | 1.5 points is 1.67 bars of buffer in one range and 0.47 in another | Set stop width from the bar size inside the box |
| Keeping normal size in a range | Targets are capped, so the same risk buys much less reward | Halve it — or sit out if halving is not executable |
| Trading breakouts of every edge touch | Break-even needs the ceiling to hold fewer than 4.75 times; you cannot know that, and 63% of 20-bar-high breaks on BTC daily failed acceptance | Require a close outside plus acceptance |
| Writing a stop for the trade but not for the diagnosis | You keep the label, and the playbook, after the market drops it | Write the price that ends the label, in advance |
Six of those eight are errors of naming rather than errors of execution, which is the pattern this stage of the course keeps running into. Most bad trades are not badly executed. They are correctly executed versions of a plan built for a market that was not there.
What else do people ask about trends and ranges?
How long does a range usually last?
There is no reliable number, and any article that gives you one is quoting a statistic it cannot support across assets and timeframes. The useful reframe is that duration is the wrong variable. What you actually need is the box’s height and the bar size inside it, because together those decide whether there is enough room between the edges to pay for a trade after costs. A two-day range with a 10% height is worth trading; a three-week range with a 1% height is not, however patient you are.
Can a market be trending and ranging at the same time?
Yes, and it usually is. Those are statements about different timeframes, not contradictory statements about one. A weekly uptrend routinely contains a daily range, and that daily range routinely contains 4-hour trends running in both directions. This is why step 1 of the diagnosis is naming the frame: without it, two traders can look at the same chart, give opposite answers, and both be describing something real.
Should I use an indicator to tell trends from ranges?
Yes — on this site the RSI wave is the first read, not a second opinion. RSI 14 with an EMA 9 and a WMA 45 on the RSI: a cross above both from under 40, confirmed by the EMA 9 itself crossing above the WMA 45, is an up trend; the mirror from over 60 is a down trend; and RSI inside 40–60 with no clean cross is a range. The moving-average bundle on price is read separately to confirm, and the pullback structure in this lesson is checked last, because it is the least clear of the three. ADX and Bollinger Band width are not part of the method, and each adds a lookback setting that has to be chosen. Lesson 18 covers what the lag in any average actually costs you.
What if the box breaks and immediately comes back inside?
Then the diagnosis has not changed and the range is still the range — that is what a failed break is. It matters because it is the moment most traders switch playbooks in the wrong direction: they see the break, mentally promote the market to a trend, and then buy again higher when price returns to the edge. The rule that protects you is the one from step 6: define acceptance in advance — a close outside plus a following bar that holds outside — and until you get it, keep running the range playbook and keep the halved size. Treat the failed break as the base case, not the exception: on BTC daily candles from 2023 to 2026, 63% of pushes above a 20-bar high failed that acceptance test (the count is in the playbook section above).
Where does this sit in the course?
Lesson 20 follows Lesson 19 on RSI and sits in the middle of Stage 4. Stages 2 to 4 taught you individual tools — levels, trendlines, volume, structure, averages, RSI — and this lesson is the one that decides which of them apply today. Next comes Lesson 21 on multi-timeframe analysis, which takes the “look one frame up” step here and makes a full method out of it.
Keep the whole course next to your charts
The whole slide course — ten free PDF parts, 351 pages, taught on real charts.