Moving averages — smoothing has a price, and the price is delay
Almost every chart you open has a moving average on it, and almost every explanation stops at “it smooths price and shows you the trend”. That sentence is true and useless. The interesting questions all have exact answers: how far behind is the line, is an EMA genuinely faster than an SMA, and why does the average sometimes turn down on a day price closed higher? This lesson answers all three with arithmetic you can reproduce in a spreadsheet in about ten minutes — and one of the answers contradicts what almost every guide tells you.
KEY TAKEAWAYS
- A moving average lags price by exactly (N − 1) ÷ 2 bars on average. A 200-period line is 99.5 bars behind — on a daily chart, roughly 99.5 days.
- An EMA of the same length is not faster. A 200-EMA and a 200-SMA both carry 99.5 bars of average lag, because the standard smoothing factor 2 ÷ (N + 1) is chosen to make them match.
- What the EMA does differently is weight the newest bar 0.995% against the SMA’s 0.500% — almost exactly double — then decay instead of cutting off.
- In a trend of $50 a bar the 200-SMA sits a permanent $4,975 below price. “Waiting for a pullback to the 200” is waiting for a 9.95% correction, not for a better entry.
- A simple average moves by (today’s close − the close N bars ago) ÷ N, so it can turn down on a day price closed up. The bar leaving the window did it.
What does a moving average actually calculate?
It calculates the average of the last N closing prices, and then does it again when the next bar closes. That is the whole idea. A 20-period simple moving average on a four-hour chart is the mean of the last twenty four-hour closes; when bar 21 arrives, bar 1 drops out and the mean is recomputed.
Two words are worth pinning down before anything else. The length (or period) is N, the number of bars in the window. The weighting is how much each of those bars counts. Those two choices are the entire design space, and they produce the two families you will meet:
- A simple moving average (SMA) gives every bar in the window the same weight, 1 ÷ N, and gives bars outside the window a weight of exactly zero.
- An exponential moving average (EMA) gives the newest bar a weight of α = 2 ÷ (N + 1) and every older bar a share that shrinks by a constant factor as it ages. Written as a recipe: EMAtoday = α × closetoday + (1 − α) × EMAyesterday.
Notice what is absent from both definitions. Neither one contains any information that was not already on the chart, and neither refers to the future in any way. A moving average is a filter: it takes the price series in and returns a smoother version of the same series. Everything a moving average “says” is a restatement of prices you could already see.
That is not a criticism. A filter is genuinely useful, because raw price contains a great deal of movement that means nothing and it is hard to ignore by willpower alone. But a filter has a cost, it is always the same cost, and it is measurable. The rest of this lesson measures it.
How far behind price does a moving average sit?
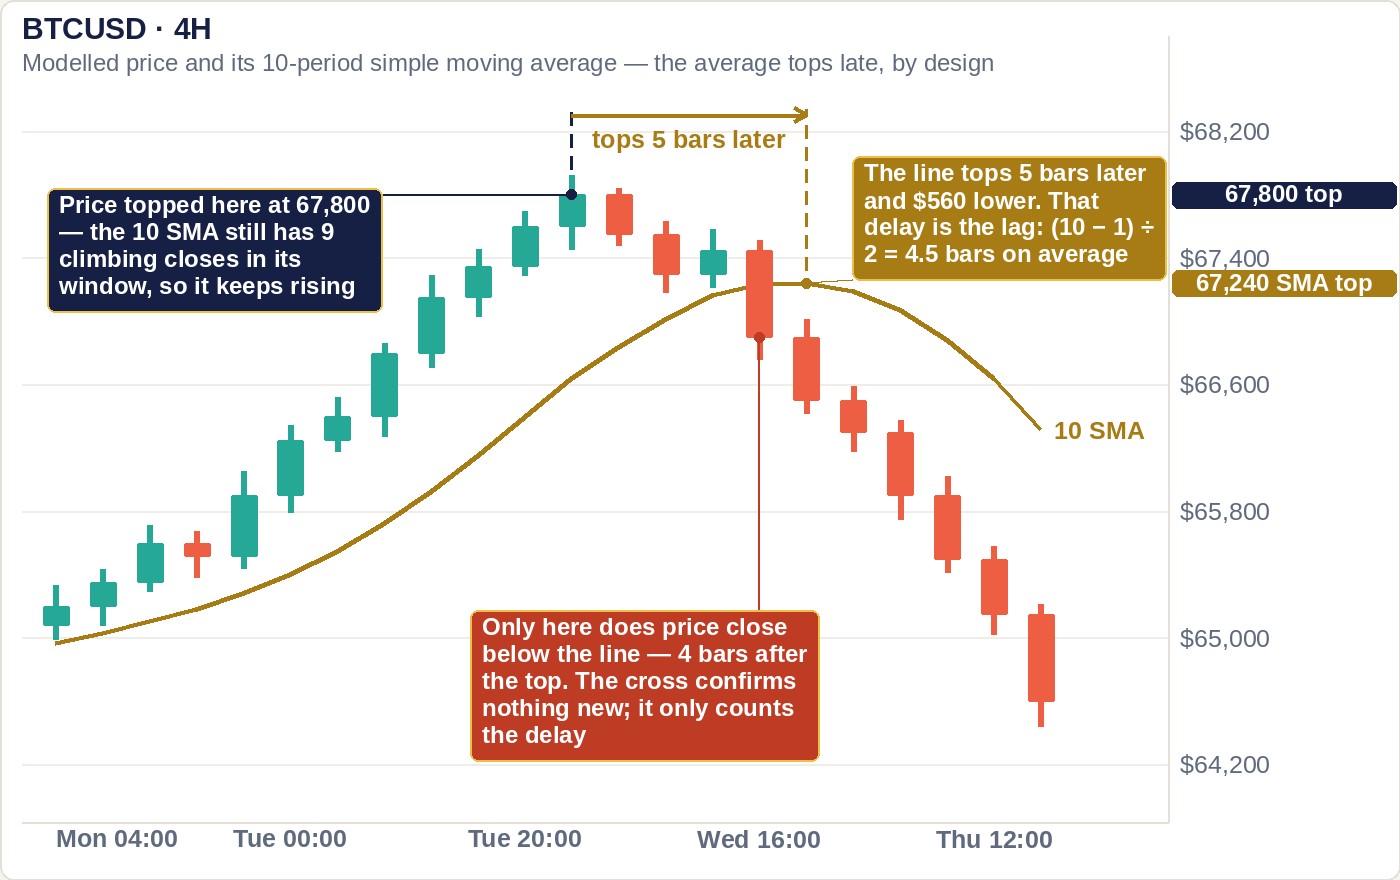
By exactly (N − 1) ÷ 2 bars, on average. That is not an estimate or a rule of thumb; it falls straight out of the definition, and it is the single most useful number in this lesson.
Here is the reasoning in one line. An N-bar simple average is the mean of bars whose ages are 0, 1, 2, … up to N − 1 bars old, each counted equally. The mean of those ages is (N − 1) ÷ 2. So the line is reporting, on average, where price was that many bars ago.
Read that ladder as a menu of delays rather than a menu of settings. Choosing 200 instead of 50 is not choosing a “better” average; it is choosing to accept 99.5 bars of delay instead of 24.5 in exchange for a steadier line. Neither is free, and no combination of settings makes the delay go away, because the delay is the smoothing.
Now the part that changes how you use the line. In a trend, that delay converts into a distance, and the distance is constant.
Take a deliberately simple model: price rises by exactly $50 every bar. Because the trend is steady, the average is always the same fixed amount below price — the lag in bars multiplied by the movement per bar.
| Average | Lag in bars | Gap = lag × $50 | Value when price is $50,000 | Gap as % of price |
|---|---|---|---|---|
| 20-period | 9.5 | $475 | $49,525 | 0.95% |
| 50-period | 24.5 | $1,225 | $48,775 | 2.45% |
| 200-period | 99.5 | $4,975 | $45,025 | 9.95% |
| Our own worked model, price rising exactly $50 per bar. Reproduce any row by multiplying the lag by $50 and subtracting from $50,000. | ||||
The consequence is worth saying slowly, because it quietly wrecks one of the most repeated pieces of chart advice. While that trend continues at that pace, price never reaches the 200-period average. It cannot: the two lines are parallel, separated by a permanent $4,975. “Wait for a pullback to the 200 MA and buy there” is therefore not a patient entry technique. It is a request for a roughly 10% correction — that is, for the trend you wanted to join to be interrupted first.
Where this reasoning has limits: real trends are not linear, so the gap breathes rather than staying pinned at one number, and in a market that accelerates the gap widens further while a stalling market lets price drift back to the line without any reversal at all. The exact $4,975 belongs to the model. The direction of the effect — longer average, larger permanent gap, deeper pullback required to touch it — holds on every chart you will ever open.
Is an EMA really faster than an SMA of the same length?
No — not in average lag, which is the sense in which almost everyone means it. A 200-period EMA and a 200-period SMA are both 99.5 bars behind price on average. They are not approximately equal. They are equal.
This surprises people, so here is why it is true rather than a coincidence. In an EMA, a bar that is k periods old carries a weight of α(1 − α)k. Average the ages under those weights and the sum collapses neatly to (1 − α) ÷ α. Now substitute the standard smoothing factor α = 2 ÷ (N + 1):
(1 − α) ÷ α = (1 ÷ α) − 1 = (N + 1) ÷ 2 − 1 = (N − 1) ÷ 2
Which is the SMA’s lag exactly. The 2 ÷ (N + 1) formula that every platform ships is not arbitrary — it was chosen to make an EMA of length N carry the same average delay as an SMA of length N, so that the two are comparable. The convention people cite as proof that the EMA is faster is the very convention that makes it equally slow.
So what does differ? The shape of the weighting, and it differs in two ways that matter.
The newest bar counts about twice as much. A 200-period SMA gives today 1 ÷ 200 = 0.500% of the total weight. A 200-period EMA gives today α = 2 ÷ 201 = 0.995%, a ratio of 1.99. If one shock bar prints, the EMA moves roughly twice as far on that first bar. That is the grain of truth inside “the EMA is faster”, and it is a statement about one bar, not about the average position of the line.
The EMA never forgets. An SMA has a hard edge: data 201 bars old counts for exactly nothing. An EMA’s weights shrink towards zero but never reach it, so a spike from a year ago is still in there, faintly. How faintly is computable: a 200-period EMA still holds 13.53% of its total weight in bars older than 200, and its weight halves every 69.3 bars (the half-life is ln 0.5 ÷ ln(1 − α)). Whether that is a feature or a bug depends entirely on whether you think a year-old bar should still be voting.
The figure is the whole result in one picture. Twenty equal blocks and a tapering staircase are obviously different arrangements, and they balance at exactly the same point. The SMA and the EMA of one length share that balance point while looking nothing alike — which is why every backtest that finds “the EMA gets me in earlier” is measuring the first bar after a shock, not the position of the line.
The practical read: swapping an SMA for an EMA of the same length is a change of texture, not a change of speed. If a rule only works after that swap, you have found a coincidence, not an improvement. If you genuinely want less delay, shorten the length — and pay for it with a line that changes its mind more often.
Why did my moving average turn down on a day price went up?
Because a simple moving average does not respond to today’s bar alone. It responds to the difference between the bar arriving and the bar leaving. Written exactly:
SMAtoday − SMAyesterday = (closetoday − closeN bars ago) ÷ N
Every term on the right is knowable in advance except today’s close. If the price that is about to fall out of the window is higher than today’s price, the average falls — whatever today’s candle did.
| Average | Today’s close | Close leaving the window | Change in the line | What it looks like |
|---|---|---|---|---|
| 50-period | $50,000 | $52,500 | −$50.00 | “The 50 has rolled over” |
| 50-period | $50,000 | $51,000 | −$20.00 | Line drifting down |
| 20-period | $50,000 | $51,200 | −$60.00 | Sharp-looking turn |
| 200-period | $50,000 | $44,000 | +$30.00 | “The 200 is turning up” |
| Our own arithmetic from (today − the bar leaving) ÷ N. In every row today’s close is the same $50,000; only the departing bar changes. | ||||
Look at the last row in particular. Nothing happened today at all — and the 200-period average ticks up $30, purely because a cheap bar from two hundred bars ago has just stopped counting. Commentary will describe this as the 200-day turning up. It is a fact about the calendar, not about the market.

This is usually called the drop-off effect, and it is the cleanest available example of the general principle from Lesson 14: an indicator is a measuring instrument, and most bad readings come from not knowing what the instrument is measuring. Two things follow.
First, before you accept “the 50 just turned down” as news, look at what price was 50 bars ago. If it was much higher than today, the turn was arithmetic that was scheduled to happen. Second, this is a genuine structural difference between the two families: an EMA has no window, so nothing ever drops out of it and it cannot produce this artefact. That is a real point in the EMA’s favour — and note that it has nothing to do with speed.
One more consequence of the slope depending on just two closes, worth knowing before you pair a moving average with anything else. Because the line rises exactly when the arriving close beats the departing one, “the average is rising” turns out to be the same statement as “RSI of the same length is above 50” — not a correlation, an identity. Lesson 23 proves it in two lines and measures what it costs to keep both conditions on the same checklist.
Does price really find support at a moving average?
Nothing rests on a moving average. It is a number computed from prices that have already happened, and there is no resting order at it, no queue, and no participant obliged to defend it — unlike the visible depth in an order book, which Lesson 9 measures directly. Whatever a bounce off the 50-day is, it is not the same kind of object as a level where size is actually sitting.
So why does it so often look like support? Two honest reasons, and it is worth being able to tell them apart.
Selection effect, which is the big one. In an uptrend, price spends nearly all its time above the average by roughly the equilibrium gap computed earlier. A pullback deep enough to touch the 50-period line but no deeper is, by construction, a shallow pullback inside an ongoing uptrend. Shallow pullbacks inside ongoing uptrends mostly resolve upward — that is close to the definition of an ongoing uptrend. The average gets the credit for an outcome the trend produced. Meanwhile the touches that kept going straight through the line are not remembered as “the moving average failed”; they are remembered as the day the trend ended.
Crowding, which is real but smaller and different in kind. Because so many people watch the same handful of lengths, orders and commentary genuinely cluster near them, and a level that many participants act on can become self-fulfilling for a while. That is a claim about other traders, not about the arithmetic, and it is strongest exactly where attention is highest and weakest on thin pairs where the crowd is a handful of accounts. Traders who call the line “dynamic support” or “the value zone the crowd accepts” are describing this second effect; the description is fine as long as you remember that the mechanism is other people, which is exactly why it fades when the crowd does.
There is a two-minute test that settles this for your own chart better than any article can. Scroll back a year, mark every bar that touched your chosen average, and count how many held versus how many went straight through. Almost nobody who repeats “the 200 is strong support” has ever counted. The horizontal zones in Lesson 12 at least mark a price where trading demonstrably happened; a moving average marks a computed statistic that moves every single bar, which is also why “put your stop at the 50 MA” specifies a stop that quietly relocates overnight.
How late is a golden cross or a death cross?
Late by a specific, computable amount — and the delay does not shrink when the move is faster, which is the part almost nobody expects.
The mechanism first. In a steady trend, the 50-period and 200-period averages are not just both behind price, they are behind each other by a fixed amount: the difference in their lags, (199 − 49) ÷ 2 = 75 bars, multiplied by the movement per bar. In our $50-a-bar model that is a $3,750 spread. Before the two lines can cross, the reversal has to erase that entire spread first. The cross is not detecting the turn; it is reporting that the turn has already outrun a 75-bar head start.
So we modelled it. Price rises $50 a bar to exactly $50,000, then reverses cleanly and falls $50 a bar. Nothing noisy, nothing ambiguous — the sharpest reversal a market could physically make.
| Model | Cross fires | Price at the cross | Move already spent |
|---|---|---|---|
| Death cross after a $50,000 top | 78 bars after the top | $46,100 | 7.80% |
| Golden cross after a $50,000 bottom | 78 bars after the bottom | $53,900 | 7.80% |
| Same reversal at $10 a bar | 78 bars | $49,220 | 1.56% |
| Same reversal at $250 a bar | 78 bars | $30,500 | 39.00% |
| Our own simulation of 50/200 simple averages on a symmetric V reversal. Reproducible in a spreadsheet with two AVERAGE columns. | |||

The scale invariance is the finding worth carrying away. A steeper reversal covers ground faster — but it also built a proportionally wider spread between the two averages on the way up, and the two effects cancel exactly. Making the move more violent does not make the cross arrive any sooner in bar terms. It only means more of the move is spent by the time it does: the same 78 bars cost 1.56% of the move at $10 a bar and 39.00% at $250 a bar. The invariant is the bar count, never the percentage.
And be fair to the indicator about what this does and does not prove. A cross is a slow, stable label for which regime you are already in, and used that way — as a slow background label, checked once a week — it does no harm. It is not how this site reads the averages: the read here is the bundle tightening, then price breaking out of it and the lines fanning, and the cross itself carries no weight. Used as an entry trigger it is arriving 78 bars into a move in the best case a market can offer. Real tops are rounded rather than instant, which pushes the number further out, so treat 78 as close to a best case rather than as a constant.
How do you use a moving average without pretending it predicts?
Give it exactly one job, accept the delay that job costs, and write the rule down before the bar prints. A moving average is a reasonable filter, a reasonable piece of context and a poor trigger, and most damage comes from asking one line to be all three at once.
Step one deserves the most thought, because the three jobs are genuinely different. As a filter, the line answers a yes/no question asked before you look for a setup: only take longs while price sits above the bundle and the lines fan upward. As context, its slope answers “is this market going somewhere or not”. As a trigger, a cross tells you when to act — and that is where the 78-bar delay lands squarely on your entry price.
The failure mode to avoid is subtle and extremely common: using the same line for all three, then treating the result as three confirmations. Price above the 200, the 200 sloping up, and a golden cross are not three independent pieces of evidence. They are one number, read three ways. That kind of double counting feels like confidence and adds none.
On this site the averages are read as one bundle — EMA 12 and 26 with MA 20 and 50 on price — with three states. The bundle tightening means a move is being prepared; price breaking above it with the lines fanning upward is up; price breaking below with the lines fanning downward is down; price stuck inside it is sideways. It is the slow, second system: read on its own and used only to confirm the RSI wave of Lesson 19, never to vote alongside it. A 200-period line is context, and price above or below it is not counted as a signal.
Steps 1 to 3 all happen before the current bar exists, and that is the whole point of writing them down. A line chosen after seeing the chart will always be the length that would have worked. Whatever the average decides, it does not decide your position size — that comes from the distance to your invalidation point, which is a risk calculation rather than an indicator reading.
That last sentence is not our opinion, and it has an unusually well-documented author. In 1970 Ed Seykota built one of the first computerised trading systems on exactly these rules — exponential moving averages, tested on punched cards because he wanted to know whether the claim held up rather than argue about it. Twenty-three years later he published what he had concluded from all that testing, and it was not a better length setting. It was that how much you risk per trade matters “far and away more” than tuning the timing parameters at all. The man who automated this indicator ended up telling people the indicator was the small half of the problem.
When is a moving average simply the wrong tool?
Four situations where everything above stops helping, and one design flaw worth naming.
A range, which the average has no concept of. A single moving average always outputs a number and a slope, including when there is no trend to describe. In a sideways market price oscillates around the line, crosses fire constantly, and each one is late by the same lag — so you buy the top of the range and sell the bottom of it. The indicator gives you no warning, because “no trend” is not one of the answers it can return. Whether the market is trending at all is decided first from the RSI wave in Lesson 19 and then checked against the bundle, where price stuck inside a tight cluster of averages is the sideways state; the geometry in Lesson 13 is the last check, not the first.
Right after a structural break. A token migration, a chain halt, a delisting and relisting, or a venue change means the window still contains N bars of a market that no longer exists. A 200-period average will keep averaging the old regime for 200 bars, reporting a level with real confidence and no relevance.
When the bars themselves are not comparable. Crypto trades continuously, so there is no session close and a “daily” bar is whatever UTC cut-off a venue chooses. Two exchanges can therefore compute genuinely different 200-day averages for the same asset, and neither is wrong. Keep one venue and one instrument per average, for the same reason baselines only work inside one source in Lesson 14, and pick a venue whose data you have some reason to trust (Lesson 6).
Very short lengths, where you pay the cost and get nothing. A 5-period average lags by 2 bars and barely smooths anything: it is close enough to price to inherit most of the noise while still being late. If you find yourself shortening the length until the line hugs price, what you actually want is price — and the honest version of that decision is to read the candles, as in Lesson 10.
The design flaw, finally: a moving average is not a level, it is a curve that moves every bar. Any rule phrased as “my stop is at the 50 MA” is a rule whose stop relocates while you sleep, in a direction that depends on a bar from fifty periods ago. If you want a fixed line, use a fixed line.
What are the most common mistakes with moving averages?
| Mistake | Why it fails | Do this instead |
|---|---|---|
| Believing an EMA is faster than an SMA of the same length | Both lag by (N − 1) ÷ 2 — 99.5 bars at length 200 | Shorten the length if you want less delay |
| Reading “the 50 turned down” as news | The line moves by (today − the bar 50 back) ÷ 50 | Check what price was N bars ago first |
| Waiting to buy a pullback to the 200 | In a $50-a-bar trend that is a 9.95% correction away | Decide if you want the trend or the discount |
| Treating a cross as an entry trigger | 78 bars late in a best-case model reversal | Read the bundle instead: tightening, then price breaking out and the lines fanning |
| Placing a stop “at the moving average” | The average moves every bar; the stop moves with it | Set the stop at a fixed invalidation price |
| Counting price-above, slope-up and cross as three signals | One number read three ways is not three confirmations | Give the line one job, then look elsewhere |
| Changing the length after seeing the chart | You will always find the length that would have worked | Fix the setting for months and judge the rule |
| Entering when price is far above (or below) the average | The gap is widest exactly when the move is most extended — in the $50-a-bar model it is a fixed 9.95% for the 200, and anything wider than that is acceleration | One school’s rule: wait for price to come back near the line, or accept the wider stop and size for it |
Seven of those eight are mistakes about the instrument rather than about the market — which is the same conclusion the volume lesson reached, and probably not a coincidence. Indicators do not fail mysteriously. They report exactly what they were built to report, to people who never checked what that was.
What else do people ask about moving averages?
Which moving average length is best for crypto?
There is no best length, because length is not a quality setting — it is a delay budget. Average lag is (N − 1) ÷ 2, so a 20-period line is 9.5 bars behind and a 200-period line is 99.5. A shorter average sits closer to price and therefore changes direction more often, including when nothing has changed; a longer one is steadier and later. The useful question is how much delay the decision you are making can tolerate. For most beginners the honest answer is to pick one common length, keep it fixed for months, and judge the rule rather than the setting.
Is the 200-day moving average special?
Only in that many people watch it, which is a fact about crowds rather than about arithmetic. Mathematically it is one average among many, sitting 99.5 bars behind price. In a market rising $50 a bar it sits a permanent $4,975 below a $50,000 price — 9.95% — so a “pullback to the 200-day” is a request for a roughly ten percent correction rather than a shallow dip. Crypto adds a wrinkle: with 24/7 trading there is no session close, so what counts as a daily bar depends on each venue’s UTC cut-off, and two venues can compute slightly different 200-day averages for the same asset.
Should I use an EMA or an SMA?
It matters far less than people assume, because the two have identical average lag at the same length: 99.5 bars at length 200. The standard smoothing factor 2 ÷ (N + 1) is chosen precisely so they match. What differs is the shape of the weighting — the EMA puts 0.995% of its weight on the newest bar against the SMA’s 0.500%, so it responds sooner to a single shock bar, but it never fully forgets old data while the SMA cuts it off at exactly N bars. Prefer the EMA if your rule turns on the first bar after a shock; prefer the SMA if you want a window with a defined edge.
Does a golden cross mean I should buy?
It means two averages of past prices have changed places, which describes the recent past rather than forecasting anything. In our worked reversal a 50/200 cross fires 78 bars after the turn, with 7.80% of the move already spent — and that delay does not shrink if the move is steeper, because a faster move widens the spread the cross must first erase by the same factor. Treat a cross as a slow label for the regime you are already in, not as an entry, and size any trade from the distance to your invalidation rather than from the line. On this site the cross is not part of the method at all; what is read is the bundle tightening and then fanning out as price breaks from it.
Where does this sit in the course?
Lesson 18 opens Stage 4, the indicator stage, directly after Lesson 17 on market structure closed the market-structure stage (reading what price itself is doing, before any indicator); the first indicator is the one that only smooths price, so that its cost can be measured before anything more elaborate is added. It also leans on Lesson 14 on volume, which set the rule that an indicator is a measuring instrument. It leans on the zones in Lesson 12 and the geometry in Lesson 13, since a moving average is a poor substitute for either, and on the delay budget from Lesson 11, because lag in bars only becomes lag in hours once you have chosen a timeframe. Next comes Lesson 19 on RSI, which stops smoothing price and instead measures the ratio between the size of its up moves and its down moves.
Keep the whole course next to your charts
The whole slide course — ten free PDF parts, 351 pages, taught on real charts.