Combining moving averages, RSI and timeframes — the agreement rule
The rule this lesson is named after is one sentence long: we need the moving averages, RSI and the multiple timeframes to agree — only then is the conclusion trustworthy. Almost everyone reads that as a probability claim. Three green lights must be safer than one, the way three witnesses are better than one witness. This lesson takes the rule seriously enough to actually check it, and the check turns up something uncomfortable: in the most common way people set these tools up, two of the three lights are wired to the same switch. Then it puts a number on what the third one costs you.

Two indicators, two panes, two colours — and, at the same length, one condition. Both lines here are computed from the same closes rather than drawn, and the dashed line marks the candle where the average turns up; RSI crosses 50 on that candle because it cannot do otherwise.
KEY TAKEAWAYS
- Two of your three confirmations may be one. For a simple moving average and a simple-average RSI of the same length, "the MA is sloping up" and "RSI is above 50" are algebraically identical — both are just "today's close is above the close n bars ago".
- The proof is two lines and there is no approximation in it. Across 399,987 simulated bars the two conditions disagreed on exactly zero of them.
- Default RSI blurs the identity but does not break it. Wilder's smoothed version agreed with a rising 14-period SMA on 85.35% of bars. That is a second opinion the way your reflection is a second person.
- There is a number for how redundant a stack is. Divide how often all conditions are true together by the product of how often each is true alone. 1.00× means genuinely independent; higher means overlapping.
- A realistic three-way rule scored 2.47×. Naive arithmetic predicted it would fire on 5.62% of bars. It fired on 13.85%. The filter was 2.47 times weaker than its own arithmetic promised.
- Confirmation is paid for in entry price. On the worked example, demanding all three agree moved the entry from 65,000 to 69,000 — from 5.00R to 1.00R, and from a 16.7% break-even win rate to 50.0%. The fully-confirmed version of the same trade is a coin flip.
- A stack costs the maximum of its delays, not the sum — and that is worse than it sounds. The slowest single condition had a median delay of 14 bars. All three together: 27 bars — nearly double it, because the laggard is a different condition each time.
- Two fast conditions are not a fast pair. At a typical swing low the 4× frame average is already rising — a median of 0 bars, true at 50.6% of lows — and the trading-frame average takes 3. Required together the median wait is 11 bars, and with RSI added, 27.
- Design rule that falls out of the arithmetic: make your conditions ask different questions — different lengths, different frames, different quantities — and audit the stack for its slowest member, because that member sets the bill.
What does "the indicators agree" actually mean?
It means nothing you are looking at contradicts the conclusion. It does not mean the conclusion has been voted for three times. That distinction sounds like hair-splitting and it is the whole lesson, so it is worth spending a paragraph on before any arithmetic appears.
The course this site follows sets out a five-step routine, and step three is where the indicators show up. Read it in its own words: use what you know about RSI when it pulls back cleanly; check that the moving averages give the same conclusion; check that price is at a support, a resistance or a channel edge that backs up what RSI and the MAs say; check that the price patterns, candles and volume favour the decision. When all four of those agree, our analysis tends to be highly accurate.
Notice the shape of that. Each item after the first is described as backing up, favouring, agreeing with. None of them is described as adding a point to a score. And the routine that feeds into it is explicit about what happens to a chart that has nothing to say: you scan the frames one at a time from the largest down, and any frame without a clear pattern is simply set aside. The course's own phrasing for it is blunt — in a vote, the one with no opinion goes along with the majority who have one. A quiet frame is not a vote against you. It is not a vote at all.
So the agreement rule is a veto system: several independent chances for something to say no, not this, and a trade that survives all of them. It is not a scoring system in which three yeses beat two. This matters because the two systems fail in opposite ways. A veto system fails by being too strict — you sit out things you should have taken. A scoring system fails by being too confident — you count the same evidence twice and mistake the echo for a second witness.
The rest of this lesson is about the second failure, because it is the one nobody warns you about, and because it turns out to be measurable.
Why is a rising moving average the same statement as RSI above 50?
Because both of them are asking whether today's close is above the close n bars ago. That is not an analogy or an approximation. It is the same arithmetic reached by two different routes, and once you have seen it you cannot un-see it on a chart.
Start with the moving average. A simple moving average of length n is the mean of the last n closes. When a new bar arrives, one close joins the window and one drops out, so the change from yesterday's value to today's is:
SMAtoday − SMAyesterday = ( Ctoday − Cn bars ago ) ÷ n
Everything in the middle of the window cancels. So the moving average is rising if and only if the newest close is above the close that just fell out of the window. The average does not know or care what happened in between. Lesson 18 showed that smoothing costs you delay; this is the same fact from the other side — the smoothing is so complete that the entire interior of the window has no vote in the slope.
Now RSI. Lesson 19 established that RSI is a ratio: it compares the average size of up-closes to the average size of down-closes over the window. RSI sits above 50 exactly when the average gain exceeds the average loss. Both averages divide by the same n, so that is the same as saying the total of the gains exceeds the total of the losses. And the total of the gains minus the total of the losses is just the net distance price travelled over the window — every intermediate move cancels out with itself:
RSI > 50 ⇔ Σgains > Σlosses ⇔ Ctoday − Cn bars ago > 0 ⇔ SMA is rising
Two indicators, drawn in two different panes, in two different colours, on two different scales — and one condition. If you have ever set up a checklist that reads "trade only when the moving average is rising and RSI is above 50", you have written the same requirement down twice and felt twice as careful for it.
Does that survive contact with a real chart?
The algebra is exact, so the only interesting question is whether the versions of these tools people actually run still obey it. To check, we generated 400,000 bars of a random walk — no trend, no memory, just noise — and compared the conditions bar by bar. A random walk is not a market and cannot tell you anything about what price will do next. What it can do is settle a question about definitions, which is all we are asking of it here.
| Pair of conditions | Bars where they agreed | Reading |
|---|---|---|
| RSI(14) > 50 (simple-average version) vs SMA(14) rising | 100.0000% — zero disagreements in 399,987 bars | Identical, as the algebra says |
| RSI(14) > 50 (Wilder default) vs SMA(14) rising | 85.35% | The same statement with the window blurred |
| RSI(14) > 50 (Wilder) vs SMA(50) rising | 75.47% | Different lengths → genuinely different questions |
| RSI(14) > 50 (Wilder) vs SMA(200) rising | 62.04% | Furthest apart, most informative pairing |
The first row is the proof made visible. The second row is the caveat that matters in practice, and it is worth stating precisely, because getting it wrong in either direction would be misleading.
The exact identity holds for the version of RSI whose averages are simple averages over the last n bars — often called Cutler's RSI. The default on almost every platform is Wilder's, whose averages are smoothed: each new bar gets a weight of 1/n and everything before it keeps 1−1/n of its weight, so the window never truly ends, it only fades. That fading is why the agreement is 85.35% and not 100%. It is a real difference and you will see the two conditions flip on different bars. But 85.35% is not two witnesses. It is one witness and a slightly delayed recording of the same witness.
The third and fourth rows are the good news, and they contain the design rule for the whole lesson: the identity is a consequence of the two tools sharing a length. Break the length and you break the redundancy. RSI(14) against a rising 200-period average agreed on only 62.04% of bars, which is close enough to a coin flip that the second condition is genuinely telling you something the first did not.
The one-line version. Two indicators of the same length are one indicator. Two indicators of very different lengths are two indicators. Agreement is informative in exact proportion to how different the questions are — which is the opposite of how confirmation is usually sold.
How would you know if two of your tools are secretly one tool?
You measure it, and the measurement takes about five minutes on any chart you already have open. It works like this.
Suppose condition A is true on 50% of bars and condition B is true on 20% of bars. If the two were completely unrelated, the fraction of bars where both are true at once would be the product: 0.50 × 0.20 = 10%. That is what independence means — knowing A tells you nothing about B. Now go and count how often both are actually true. Divide what you counted by what the product predicted, and you have a number we will call the redundancy multiple:
redundancy multiple = (how often all conditions are true together) ÷ (the product of how often each is true alone)
It reads like this:
- 1.00× — the conditions are independent. Each one really is a second opinion, and the filter is as strict as its arithmetic suggests.
- Above 1.00× — they overlap. Your filter is easier to satisfy than you thought, because the conditions tend to come true together.
- At the ceiling — they are the same condition. The ceiling is not a fixed number: it is the rarest condition's own frequency divided by the product, because if the conditions are identical then "all true together" is just "the rarest one is true".
Here is the measurement on the pair from the last section, the one we already know is nearly the same condition twice:
| Condition | True on |
|---|---|
| SMA(14) rising | 50.25% of bars |
| RSI(14) above 50 (Wilder) | 50.19% of bars |
| If independent, both together would be | 25.22% of bars |
| Both together, measured | 42.89% of bars |
| Redundancy multiple | 1.70× — against a ceiling of 1.99× |
The ceiling here is 1.99×, so 1.70× puts this pair about 71% of the way from "two independent tests" to "one test written twice". And we know from the algebra that if you switched to the simple-average RSI it would go to the ceiling exactly. This is what a redundant confirmation looks like when you point a number at it: not obviously broken, just quietly not doing the job you hired it for.
How much of the chart does a three-way agreement rule really leave you?
Less than you want, and more than your arithmetic predicts — which is the awkward combination. The stack gets stricter than you would like and weaker than you believe, at the same time, and for the same reason.
We built a three-condition rule of the kind people actually run. The conditions were deliberately chosen to ask different questions: a trend question on the trading frame, a momentum question, and a permission question on a frame four times slower — the structure Lesson 21 describes, where the higher frame grants permission and the lower one supplies the catalyst.
| Condition | What it asks | True on |
|---|---|---|
| A. 50-period MA rising on the trading frame | Is the trend up here? | 50.86% |
| B. RSI(14) above 60 | Is buying pressure clearly on top? | 21.09% |
| C. 50-period MA rising on the 4× frame | Does the bigger frame permit it? | 52.36% |
| If the three were independent, all-true would be | 5.62% | |
| All three true together, measured | 13.85% | |
| Redundancy multiple | 2.47× | |
Two things fall out of that table, and they point in opposite directions.
The rule is strict. Condition A alone left just over half the chart available. Adding B cut what remained to 19.15%, and adding C cut it to 13.85% — so the full stack keeps only 27.2% of the opportunities that the trend condition alone would have allowed. Roughly seven out of every ten setups you would otherwise have looked at are gone. That is a real cost, and the next two sections are about whether it is worth paying.
And the rule is weaker than its own arithmetic. If you had reasoned "half the time, times a fifth of the time, times half the time — so this only fires on about one bar in eighteen", you would have been wrong by a factor of 2.47. It fires on about one bar in seven. The ceiling for this particular trio is 3.76×, so 2.47× sits roughly 53% of the way from three independent tests toward one test wearing three hats — and this is the good case, the one where we deliberately chose different lengths, different frames and different quantities.
The gap between 5.62% and 13.85% is not a flaw in the conditions. It is a measurement of how much they were already telling each other. It is worth being clear about what the number does and does not license: it is not a claim about a real market, since a random walk has no trend in it by construction. It is a claim about how much two definitions overlap when nothing else is going on. That is the floor, not the forecast — and it is exactly the quantity you want, because it isolates the overlap that comes from the formulas rather than from the market.
Where this sits next to Lesson 16. That lesson showed that on a neutral yardstick the chance of n timeframes all pointing the same way is 21−n — halving each time you add a frame. This lesson is the correction to the obvious next step. You may not multiply probabilities across different tools, because tools computed from the same closes are not independent events. Lesson 16 tells you what agreement between frames costs. This one tells you why you cannot just keep multiplying.
What does waiting for all three cost on a real trade?
Entry price, and it is easy to underestimate because the loss arrives twice on the same move. Every bar you wait for the last confirmation both widens the distance to your stop and shortens the distance to your target, so the reward-to-risk ratio falls from both ends at once.
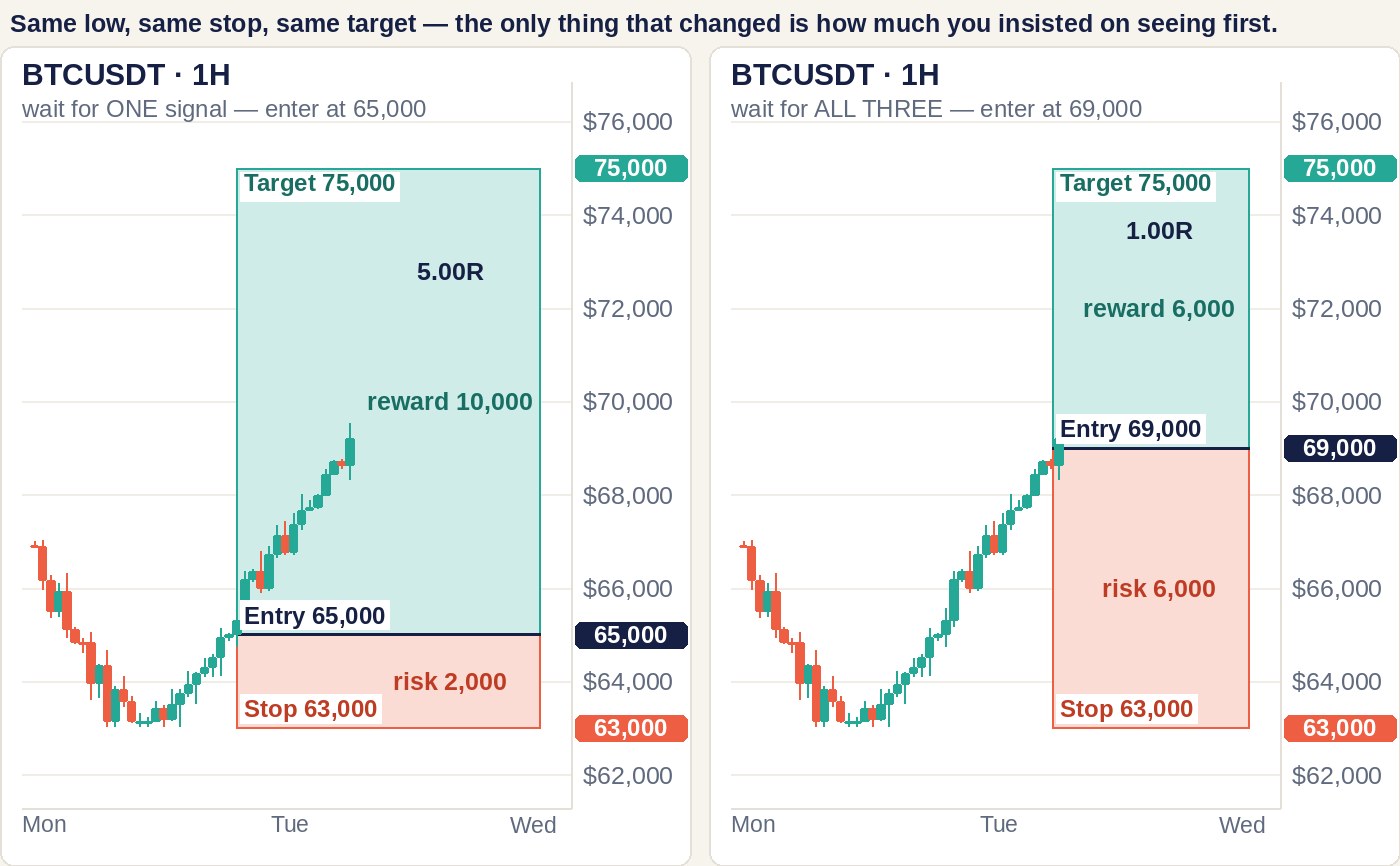
Take a concrete case. Price falls to 63,000 and turns, and you want to buy the recovery with the stop under that low and the target at 75,000. Nothing about the trade changes except how many things you insist on seeing before you press the button. One note on order: on this site the larger frame is read first, before the small-frame cross is even looked for, so the 4-hour condition is a precondition you check rather than a signal you wait for after the entry has arrived; the cost below is what you pay when you wait for slower conditions to turn after the cross.
| You wait for… | Entry | Risk | Reward | R:R | Break-even win rate |
|---|---|---|---|---|---|
| RSI to turn up off its fast average | 65,000 | 2,000 | 10,000 | 5.00R | 16.67% |
| …and price to close back above the 50-MA | 67,000 | 4,000 | 8,000 | 2.00R | 33.33% |
| …and the 4-hour 50-MA to turn up too | 69,000 | 6,000 | 6,000 | 1.00R | 50.00% |
Same low, same stop, same target, same idea about the market. The fully-confirmed version pays five times less than the early one, and it needs to be right on 33.3 percentage points more of its trades just to stand still. Look at where that lands: a 1.00R trade breaking even at 50.00% is, precisely and unarguably, a coin flip. The most carefully confirmed version of this trade is the one with no edge left in it.
The point of the number is not that confirmation is bad. It is that confirmation is a purchase, and now you know the price, so you can ask whether the goods are worth it. Waiting for the third condition has to remove enough losers to lift your win rate by more than 33.3 points. If it does, it is the best trade in your process. If it removes a few losers and a similar share of winners — which is what a redundant condition does, since it is largely just restating the first one — then you paid 22.5 points for a slower version of information you already had.
This site has been keeping a running tally of what "wait for confirmation" costs, computed the same way each time, and it is starting to look like a real range rather than a set of one-offs:
| Lesson | Confirmation being bought | Break-even win rate it adds |
|---|---|---|
| 24 | Waiting for the candle after a single-candle signal | +12.3 points |
| 17 | Waiting for the structural break to be confirmed | +18.3 points |
| 22 | Waiting for the momentum stage to complete | +24.5 points |
| 28 | Waiting for a double top's neckline to break | +29.4 points |
| 23 (this one) | Waiting for all three tools to agree | +33.3 points |
Nothing on that list is free, and nothing on it is obviously wrong to buy. What would be wrong is buying it without knowing the price, which is what "wait for confirmation" means when it is offered as advice with no number attached.
Why does adding a condition that is already true still make you late?
Because "already true" describes the median case, and a stack does not wait for the median — it waits for whichever member happens to be slowest on the day. This is the most counter-intuitive result in the lesson and the one with the most immediate practical use, so it is worth walking through carefully.
The obvious guess is that stacking conditions adds up their delays. That guess is wrong, and pleasantly so: the conditions are all evaluated on the same bar, so the moment they are all true is the moment the last one becomes true. The cost of a stack is the maximum of its delays, not the sum.
The less obvious part is that this does not save you nearly as much as it sounds. We measured it: 24,273 swing lows, and for each one, how many bars until each condition first turned true.
| What you require | Median bars after the low |
|---|---|
| A. 50-period MA rising on the trading frame | 3 — already true at 37.8% of lows |
| B. RSI(14) above 60 | 14 — already true at 2.3% of lows |
| C. 50-period MA rising on the 4× frame | 0 — already true at 50.6% of lows |
| A and C together (the two averages) | 11 |
| A and B together | 18 |
| B and C together | 24 |
| All three together | 27 |
Read the first three rows against the fourth, because that comparison is the whole point. Condition C costs nothing on its own — at a typical swing low it is already rising, a median of 0 bars. Condition A costs 3. Both look nearly free — at the typical swing low C is already satisfied 50.6% of the time and A 37.8% of the time. Now require them together: the median wait jumps to 11 bars, nearly four times the slower of the two. Neither condition became slower. What changed is that you now need them true on the same bar, and the occasions when one of them is lagging are exactly the occasions you now sit through.
And the bottom row is worse than the "maximum, not sum" rule makes it sound. The slowest single condition had a median delay of 14 bars. The three-way stack had a median of 27 — nearly double it. That is not a rounding artefact; it is what happens when no single condition is reliably the laggard. Across those 24,273 usable swing lows, the last condition to turn true was RSI 47.2% of the time, the 4× frame average 37.9% of the time, and the trading-frame average 14.9% of the time. There is no "slow one" to blame and no "fast one" you can safely add. You wait for a different straggler each time, and the waits compound into a distribution whose middle sits well beyond the worst individual median.
The practical rule. You cannot audit a checklist by asking which item is slowest, because on any given trade a different one is. You audit it by asking how many items there are at all. Every item you add hands the market one more chance to keep you waiting, and the ones that look free — the conditions already satisfied most of the time — are exactly the ones whose cost is invisible until you measure it.
So how should you actually combine them?
In a fixed order, one frame at a time, asking each chart to disqualify the trade rather than to endorse it. The routine below is the course's, and everything above is the reason it is built as a sequence rather than a scorecard.
- Scan the big frames first, one at a time, and stop to write a conclusion. Go from the largest frame downward and answer only two questions on each: is it up, down or sideways, and is the move strong or weak. Do not skim the whole ladder in thirty seconds — that is the single most common error, and it produces a conclusion you cannot repeat tomorrow. At the bottom of the big frames, commit to one of two verdicts: they agree, so a large trend exists and distant targets are legitimate; or they contradict each other, so the market is broadly sideways and you are hunting small-frame waves with modest expectations.
- Set aside every frame that has nothing to say. A chart with RSI drifting in the middle of its range and its averages flat is not evidence against your idea. It has no opinion, and it goes along with whichever frames do have one. Counting it as a "no" is the fastest way to talk yourself out of every trade you will ever see. The same goes for a frame whose wave has lost validity — RSI back inside 40–60 and crossed the other way, with the EMA 9 crossed back through the WMA 45: it no longer decides the trend, so step up to the nearest larger frame that still has a live wave.
- Find the frame that is actually running the wave, and read RSI together with price. A frame is running a wave only when RSI has crossed both its averages from the edge zone and the EMA 9 has crossed the WMA 45 the same way; RSI crossing back on its own is a pullback inside that wave, not its end. This is where the redundancy lesson earns its keep. RSI trending up while price goes sideways is not rising buying pressure — it is selling pressure taking a break, and the two are not the same trade. Neither line means anything alone; the reading comes from the pair.
- If two neighbouring frames are out of phase, wait. The 1-hour up while the 4-hour is still down is the signature of a sideways market, and the entry needs the larger frame trending with the smaller frame tightening and crossing the same way — RSI through both averages and the EMA 9 through the WMA 45. Let the larger frame finish its correction and line up; only if you are already in a position do you manage on the frame that has just entered its pattern and let the nearest support or resistance on that frame settle the argument.
- Only then, size and place the stop — and place the stop on the frame you entered on, not on a slower one; the target is the one price that comes from the frame above. Lesson 21 priced that mistake: borrowing the stop from a frame n times slower widens it by roughly √n and destroys the same fraction of your reward.
The design rule the arithmetic gives you
The routine above tells you how to read. The measurements in this lesson tell you what to put on the list in the first place, and the rule is short: every condition on your checklist should ask a question the others cannot answer. Three practical tests, in order of how much they buy you:
| Make them differ in… | Why it works | Example |
|---|---|---|
| Length | The identity in section 2 only holds when the lengths match. Break the length and the overlap drops immediately — 85.35% agreement at the same length, 62.04% against a 200-period average. | RSI 14 read against its own EMA 9 and WMA 45, with EMA 12/26 and MA 20/50 on price — the course's settings share no length |
| Frame | A slower chart is computed from different closes, so it is not a restatement of the faster one. This is the permission-and-catalyst structure of Lesson 21. | 4-hour trend as a gate on 1-hour entries |
| Quantity measured | Everything derived from closing prices is related to everything else derived from closing prices. Volume is not. Nor is the shape of a candle, which carries the open, high and low as well. | Volume confirming a break; a rejection wick at a level |
That third row is the reason the course's four-item version ends with patterns, candles and volume. Two of those four items are not computed from closes at all, which makes them the genuinely independent members of the set. On this site the three systems are fixed and never blended — the RSI wave first, the moving-average bundle to confirm, price structure last — and candles and volume enter only in the final mix; a confirmation from outside the closing-price family buys more than a second member of the same family ever will.
When is this advice wrong?
Four boundaries, and the first one is the most important because it protects you from over-correcting.
If your conditions already ask different questions, none of the redundancy warning applies to you. A rising 200-period average, a rejection wick at a weekly level, and a volume spike are three genuinely different measurements, and demanding all three is a real filter doing real work. The warning is specifically about tools of the same family and the same length. Do not go and delete a confirmation that was pulling its weight because of a table about a different setup.
The simulated numbers are a floor, not a forecast. The random walk has no trend in it, which is exactly why it is useful for isolating how much overlap comes from the formulas themselves. But a real trending market will push most trend-following conditions true at the same time, so in the periods you most want to trade, the redundancy multiple is likely to be higher than 2.47, not lower. We have not measured that on live data and will not quote a figure for it. Measure it on your own chart with the exercise above; that number is yours and it beats ours.
The exact identity is about simple moving averages and simple-average RSI. Exponential averages weight recent closes more heavily, so a rising EMA is not quite the statement "today's close beat the close n bars ago", and Wilder's RSI blurs its window rather than ending it. The identity becomes an approximation — a strong one at 85.35%, but an approximation. If you want the clean version to look at, put a simple 14-period average and a 14-period RSI on the same chart and watch them cross their thresholds on the same candle, over and over.
And the delay is only a cost when the trade would have worked. The whole purpose of a confirmation is to remove trades that were going to fail, and the 33.3-point figure is not an argument for entering earlier — it is the bar that the confirmation has to clear. A stack that lifts your win rate by 40 points is worth its 33.3-point price. The question is never "should I confirm?" but "does this confirmation earn more than it costs?", and you cannot answer that without both numbers.
One more caveat about the thresholds themselves. The 40 / 60 / 80 levels used in the momentum-style conditions above are the reading this site uses, set out in Lesson 22; the more common convention treats 30 and 70 as lines to fade, and that reading is not used here. This lesson does not need either convention to be correct. The arithmetic of overlap and delay works the same way whichever levels you pick; only the base rates change.
Common mistakes
| Mistake | What it costs | Do this instead |
|---|---|---|
| Multiplying probabilities across indicators computed from the same closes | You believe your setup is rare and high-conviction; the measured stack fired 2.47× more often than the arithmetic promised | Measure the joint frequency and divide by the product — the gap is your redundancy |
| Pairing an RSI and a moving average of the same length | Two slots on the checklist, one piece of information, and 100% overlap in the simple-average case | Keep the pairing but change one length — the course's RSI 14 against EMA 12/26 and MA 20/50 shares none, and RSI(14) against a 200-period average agreed only 62.04% of the time |
| Treating a quiet frame as a vote against the trade | You talk yourself out of everything; a chart with no pattern has no opinion, not a negative one | Set it aside and read the frames that do have something to say |
| Adding a condition because "it is almost always true anyway" | The 4× frame condition costs a median of 0 bars at a typical low, yet pairing it with a 3-bar condition produced an 11-bar wait | Count the items on the list, not their individual speeds — each one is another chance to be kept waiting |
| Reading RSI without price next to it | You call rising RSI over flat price "buying pressure" when it is only selling pressure resting | Require both lines to say the same thing before either counts |
| Adding a fourth and fifth confirmation after a losing run | Each one pushes the entry later; three already cost 33.3 points of break-even win rate on the worked trade | Fix the list in advance, and change it on evidence rather than after the last loss |
| Assuming confirmations delay you by the sum of their lags | You budget for the wrong number in both directions — the true cost is the maximum, but its median was nearly double the slowest single condition | Expect a different straggler every time; that is what the gap is |
Frequently asked questions
Is it wrong to use RSI and a moving average together?
No — it is wrong to use them at the same length and count them as two confirmations. At matching lengths they are algebraically the same test: both reduce to whether today's close is above the close n bars ago, and in the simple-average case they disagreed on zero of 399,987 simulated bars. Change one of the lengths and the pairing becomes genuinely useful. RSI(14) against a rising 200-period average agreed on only 62.04% of bars, which means the second condition is contributing information rather than echoing the first. The tools are fine; the settings were the problem. The course's own settings — RSI 14 read against an EMA 9 and WMA 45 plotted on the RSI, and EMA 12/26 with MA 20/50 on price — share no length, and are read as separate systems: RSI first, the bundle only to confirm.
How many confirmations should a setup require?
Few enough that you can still say what each one adds that the others do not. There is no universal number, but there is a test that will thin the list quickly: for each item, ask which question it answers that no other item on the list can. Anything that cannot survive that question is costing you entry price without buying accuracy. The measured cost is real — on the worked example, going from one confirmation to three moved the break-even win rate from 16.67% to 50.00% — a coin flip — and the median wait after a swing low from 3 bars to 27. Two conditions from genuinely different families, such as one price-based and one volume-based, will usually outperform four from the same family.
Does waiting for confirmation on a higher timeframe make a trade safer?
It makes it later, and whether later is safer depends on a number you can compute. A slower frame is a genuinely different measurement, so as a confirmation it is one of the better ones available — it is not just restating your entry chart. But it arrives on its own schedule. In the measurement here, the 4× frame condition was already satisfied at 50.6% of swing lows and cost a median of zero bars on its own, yet pairing it with a three-bar condition still produced an eleven-bar wait, because the occasions when one of them is lagging are precisely the ones you then have to wait through. Treat it as a purchase with a price, not as a free safety measure.
Why did my backtest of a three-indicator system take so many more trades than I expected?
Almost certainly because you estimated the trade count by multiplying the individual frequencies, and the conditions overlap. That is the redundancy multiple in action: in the three-condition rule measured here, multiplying predicted the rule would fire on 5.62% of bars and it actually fired on 13.85% — 2.47 times as often. The same effect explains the mirror-image surprise, where a stack of conditions you expected to be permissive turns out to allow almost nothing: overlap can run either way once the conditions include some that move opposite to each other. Either way, the fix is to measure the joint frequency directly rather than deriving it.
If two indicators are mathematically the same, why do they look different on my chart?
Because of the smoothing, and because you are almost certainly not running matched lengths. The default RSI on most platforms is Wilder's, whose averages fade rather than end, so its window has no hard edge — that alone dropped the agreement with a matched simple moving average from 100% to 85.35%. On top of that, the two are drawn on different scales in different panes, so a small difference in timing looks like a large difference in behaviour. They are not identical as pictures. The claim is narrower and more useful than that: as a yes-or-no test of direction at matched lengths, they answer the same question.
Keep the whole course next to your charts
The whole slide course — ten free PDF parts, 351 pages, taught on real charts.
How these numbers were produced. The identity is algebra, not measurement: RSI is above 50 exactly when the up moves over the window outweigh the down moves, which reduces to the latest close exceeding the close n bars ago — the same inequality that makes a simple moving average of length n rise. Everything else on this page is measured on one deliberately boring dataset: 400,000 bars of a Gaussian random walk (0.4% per bar, seed 20260902), of which 399,987 are usable after warm-up. A random walk has no trend and no memory, which is exactly why it is the right instrument here — it isolates how much two definitions overlap, with none of the overlap that a real trend would add. It says nothing about prices and is not used to. The agreement table compares RSI(14) above 50 against a rising simple average of length 14, 50 and 200 — the first row using the simple-average RSI, the rest Wilder’s default. The redundancy and delay studies use three conditions, stated so you can reproduce them: A = the 50-period average rising on the trading frame, B = RSI(14) above 60 (Wilder smoothing), C = the 50-period average rising on a 4× slower frame. Their individual frequencies were 50.86%, 21.09% and 52.36%, so independence predicts 5.62% for all three at once; the measured figure was 13.85%, giving the 2.47× redundancy multiple. The delay study takes the 24,273 swing lows in the series (a bar lower than the five before and five after it) and records how many bars pass before each condition, and each combination, first holds. All R and break-even figures elsewhere on the page are geometry from the stated entry, stop and target, before fees, funding and slippage. On a real market the redundancy multiple would be higher than 2.47, not lower, because a genuine trend pushes trend-following conditions true together; we have not measured that and do not quote a figure for it. Sources: our own arithmetic and simulation, stated inline. Published 2 Sep 2026; the redundancy and delay measurements were re-run on 3 Sep 2026 so that both studies use the same three conditions as the table above, and re-run again on 24 Sep 2026 from a script kept in our records (do-so-bai-23b.py) with the 4× frame defined exactly: groups of four trading bars, the higher-frame average read only at the close of a completed 4× bar. Numbers on this page are that script's output.