Reversal chart patterns — double top and head and shoulders, and what makes them fail
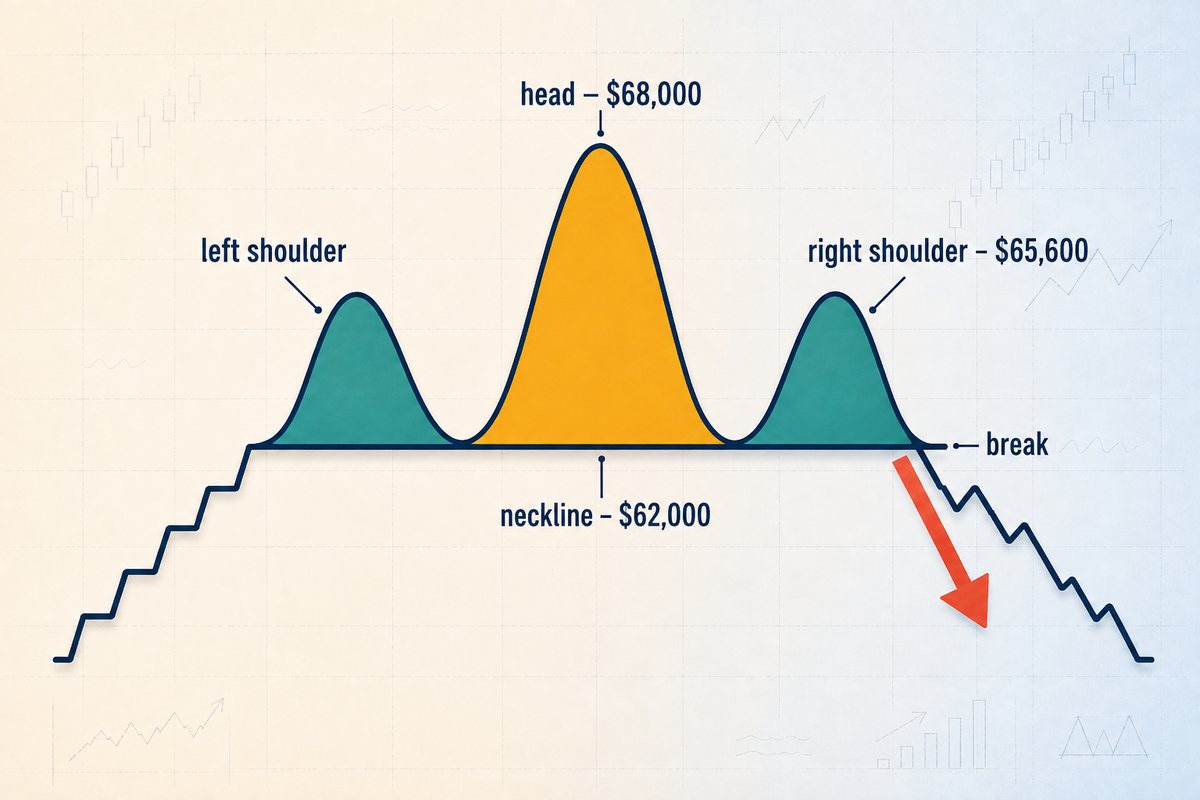
Every reversal-pattern guide teaches you to spot the shape and stop there. Three peaks, middle one highest, draw a line under the valleys, wait for the break. All true, all useless on its own — because recognising the shape tells you nothing about whether the trade is worth taking, and the two patterns everyone learns together turn out to be worth wildly different amounts of money for a reason nobody mentions. This lesson does the arithmetic. It puts the double top and the head and shoulders on a single scale, shows you exactly which measurement on the chart decides what you get paid, and gives you the four-step check that kills a bad one in about ten seconds.
KEY TAKEAWAYS
- The textbook double top is exactly 1.00R by construction. The measured target and the stop distance are the same number, always. Break-even win rate: 50%, before you pay a single fee.
- A head and shoulders pays R:R = 1 ÷ k, where k = shoulder height ÷ head height, both measured from the neckline. The famous “no shoulder above the head” rule only guarantees you clear 1.00R.
- Both patterns sit on one scale, and a double top is simply the k = 1.00 case. That is the whole difference between them in one number.
- Moving a right shoulder by 1.8% of price — $65,600 down to $64,400 — took the break-even win rate from 40.8% to 32.6%. 8.2 points from one candle’s high.
- A down-sloping neckline feels more bearish and prices worse: 1.67R collapses to 1.30R, a 22% cut, because the break lands lower while the stop stays put.
The same measuring habit runs into a different shape next. Both patterns in this lesson take their target from a height and their stop from a level, and both hand you a fixed reward-to-risk the moment the shape is drawn. A wedge does not: it keeps converging after you have identified it, so the reward stays fixed while the risk shrinks, and the trade is worth a different amount every bar you wait. Lesson 29 puts a number on that — and on the point at which waiting starts costing more than it earns.
What is a reversal pattern actually claiming?
That a level held twice, and that the second failure is the one that matters.
Strip away the names and both patterns on this page make the same argument. Price ran into a price area, could not get through, backed off, came back with more conviction — and got thrown back again. The classical teaching puts it plainly: when price returns to test an old high, it meets very heavy selling that was already built there the first time, and that supply is what makes the level hard to break. The pattern is a record of two attempts and two failures at the same address.
Two consequences follow immediately, and both of them decide trades.
A reversal pattern needs something to reverse. This sounds obvious and is the single most common way these setups are misused. Two peaks at the same height in the middle of a sideways range are not a double top — they are the range doing its job. The pattern is a claim that buyers who had been winning have now been stopped, and buyers cannot be stopped if they were never in control. That is why the classical material is specific about position: the head and shoulders belongs at the top of an uptrend, the inverted version at the bottom of a downtrend, and anywhere else the shape is just a shape. Diagnosing trend or range comes before pattern recognition, not after it, and the frame above has to agree that there was a trend at all.
The neckline is where the claim becomes a trade. Until price closes through the line joining the valleys, nothing has actually been decided — you have a shape and an opinion. The neckline break is the moment the level that held twice gives way, and it is also, conveniently, where your entry and your risk get defined. Everything measurable about these patterns is measured from that line.
What exactly makes a double top or a head and shoulders valid?
Four rules, and one of them voids the pattern outright.
Start with the shapes. A double top is two peaks at or near the same level with a pullback between them; the low of that pullback is the neckline. A head and shoulders is three peaks where the middle one is the highest, and the neckline joins the two intervening lows. The inverse versions — double bottom, inverted head and shoulders — are the same geometry upside down.
Now the rules that actually filter, taken from the classical definitions rather than invented here:
- No shoulder may rise above the head. If one does, the pattern is void — not weak, not marginal, void. A right shoulder above the head is a new high, and a market making new highs has not reversed.
- The two shoulders should be at or near the same level. Some unevenness is normal and expected. Unlimited unevenness makes the label meaningless, so write your tolerance down before you look at the chart, not after.
- Volume through both shoulder phases is usually low. That is the classical observation, and it makes sense: the shoulders are the market failing to commit. A right shoulder built on heavy volume is a different animal and deserves suspicion. Check it against the volume bar underneath before you trust the shape.
- The neckline does not have to be horizontal. Identifying it takes some flexibility, and the classical material says so explicitly. But flexibility has a price, and the fourth section of this lesson works out exactly what that price is.
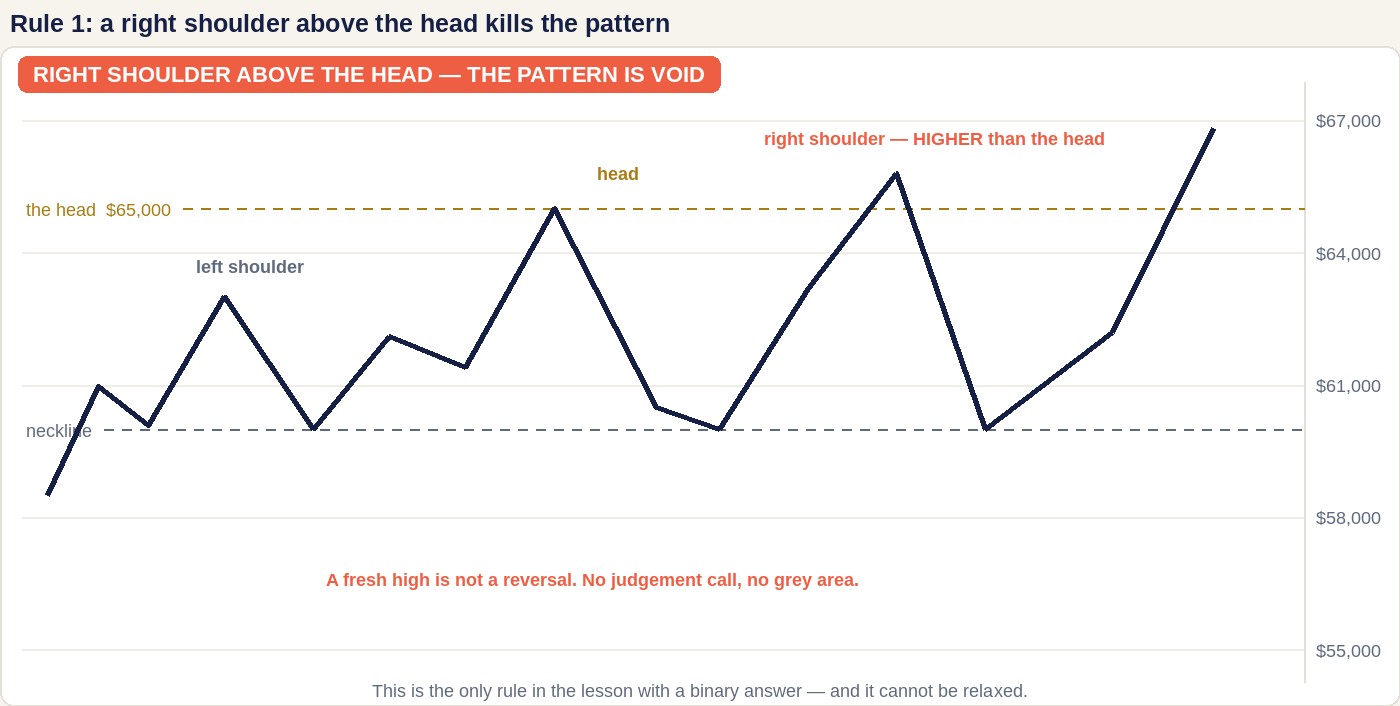
Rule 1 is worth dwelling on because it is the only part of chart-pattern analysis with a genuinely binary answer. Everything else here — how level is level, how much slope is too much, whether that fourth touch counts — is a judgement you can quietly relax when you want a trade. The head test cannot be relaxed. Use it first, because it is free.

Why is a textbook double top always a 1.00R trade?
Because the distance you are risking and the distance you are targeting are the same distance, by construction. This is not a tendency or a statistic. It is arithmetic, and it holds on every double top that has ever formed.
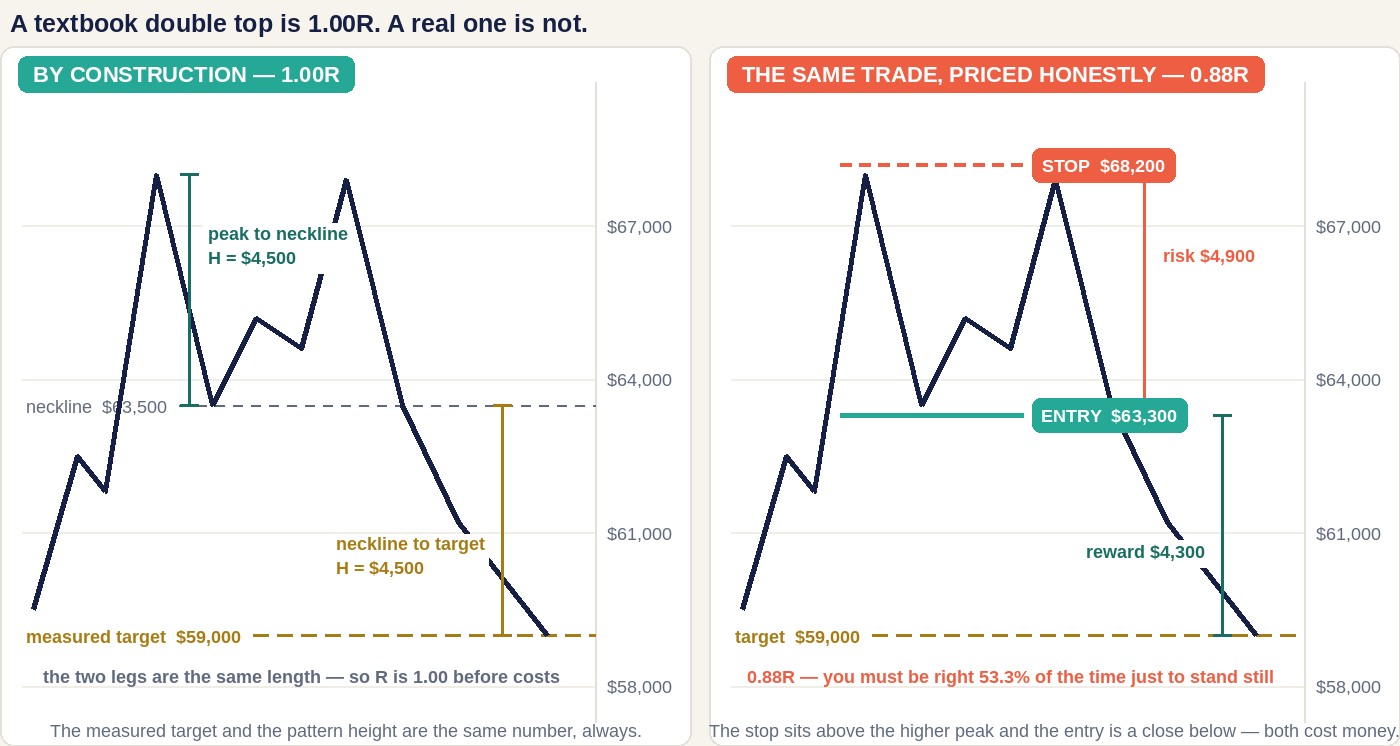
Follow the standard instructions. Call the peak P and the neckline N. The pattern height is H = P − N. The measured move projects that height down from the neckline, so the target is N − H. You enter on the neckline break at N, and you put the stop above the peak at P.
Now measure both legs:
- Risk = P − N = H
- Reward = N − (N − H) = H
They are the same number. Reward-to-risk = 1.00R exactly, before a single cost. A trade at 1.00R breaks even at a 50% win rate, and since your entry always slips a little past the neckline and your stop always sits a little above the peak, the real figure comes in under 1.00R every time.
Here is that with numbers. An illustrative model built for this lesson, hypothetical figures:
| Level | Price | Working |
|---|---|---|
| First peak | $68,000 | — |
| Neckline (the low between the peaks) | $63,500 | — |
| Second peak | $67,900 | near-identical, as required |
| Pattern height H | $4,500 | 68,000 − 63,500 |
| Measured target | $59,000 | 63,500 − 4,500 |
| Entry — close below the neckline | $63,300 | — |
| Stop — above the higher peak | $68,200 | — |
| Risk | $4,900 | 68,200 − 63,300 |
| Reward | $4,300 | 63,300 − 59,000 |
| Reward-to-risk | 0.88R | 4,300 ÷ 4,900 |
| Break-even win rate | 53.3% | 1 ÷ (1 + 0.88) |
So what do you do about it? There are only two honest answers, and neither is the one most guides give.
Answer one: take a different entry. The 1.00R identity is locked to entering at the neckline. Enter on the rejection at the second peak instead — say at $66,000 as price turns away from resistance — and the same stop at $68,200 with the same $59,000 target gives risk $2,200 against reward $7,000. That is 3.18R, break-even at 23.9%.
Answer two: be honest about what you just traded. That $66,000 entry is not a double top trade, because at $66,000 the pattern has not confirmed anything. You are trading the second test of a resistance level and hoping it becomes a double top. It is a perfectly reasonable trade — it is just a different one, with a different failure mode, and it belongs in a different row of your journal.
Look at what the choice costs, because the size of it is the real finding here. Confirmation takes you from 3.18R to 0.88R and lifts the break-even win rate from 23.9% to 53.3% — a gap of 29.4 percentage points. For comparison, waiting for the confirmation candle on the engulfing pattern in the previous lesson cost 12.3 points. Confirmation on a double top is more than twice as expensive, and almost nobody prices it.
What is a head and shoulders actually worth, and what decides it?
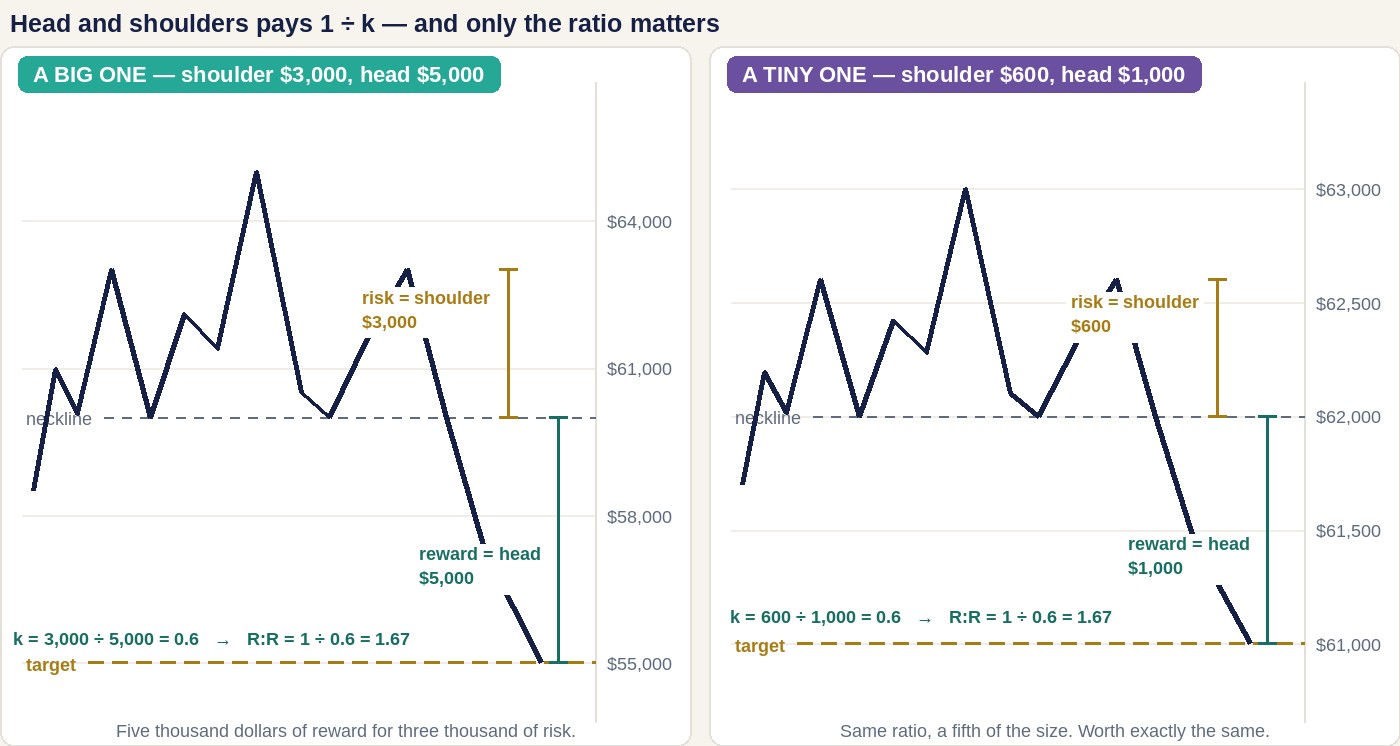
One measurement decides it, and it is not the one you have been looking at. Call it k:
k = shoulder height ÷ head height, both measured up from the neckline
Run the same construction as before. The head sits H above the neckline; the measured target is H below it, so the reward is H. But the stop does not go above the head — it goes above the right shoulder, which is only kH above the neckline. So:
- Risk = kH
- Reward = H
- Reward-to-risk = H ÷ kH = 1 ÷ k
The pattern height cancels out completely. It does not matter whether the head is $600 tall or $6,000 tall — only the ratio matters. And now the two patterns join up: in a double top the peaks are the head, so k = 1.00, and 1 ÷ 1.00 = 1.00R. A double top is a head and shoulders with k = 1. The head’s entire job is to push k below 1 so you can put the stop somewhere cheaper than the extreme.
That also explains what the “no shoulder above the head” rule is really doing. It is a rule that k < 1 — in other words, the validity test guarantees you clear 1.00R and nothing more. Every bit of reward beyond break-even comes from how far below 1 you managed to get.
| k — shoulder ÷ head | Reward-to-risk | Break-even win rate | What it is in practice |
|---|---|---|---|
| 0.30 | 3.33R | 23.1% | A stubby shoulder under a towering head — rare and worth waiting for |
| 0.40 | 2.50R | 28.6% | A very good head and shoulders |
| 0.50 | 2.00R | 33.3% | The practical floor — shoulders half the head |
| 0.60 | 1.67R | 37.5% | Textbook-looking, already below a 2R filter |
| 0.70 | 1.43R | 41.2% | Shoulders nearly as tall as the head |
| 0.80 | 1.25R | 44.4% | Technically valid, barely worth the screen time |
| 0.95 | 1.05R | 48.7% | Still passes the validity rule |
| 1.00 | 1.00R | 50.0% | This is a double top |
Now the worked version, so you can see how much execution eats. Illustrative figures again:
| Shoulders at k = 0.60 | Shoulders at k = 0.40 | |
|---|---|---|
| Neckline | $62,000 | $62,000 |
| Head high | $68,000 — so H = $6,000 | $68,000 — so H = $6,000 |
| Right shoulder high | $65,600 | $64,400 |
| Entry — close below neckline | $61,800 | $61,800 |
| Stop — above right shoulder | $65,800 | $64,600 |
| Target — neckline − H | $56,000 | $56,000 |
| Risk | $4,000 | $2,800 |
| Reward | $5,800 | $5,800 |
| Reward-to-risk | 1.45R | 2.07R |
| Break-even win rate | 40.8% | 32.6% |
Read the two right-hand columns against each other, because this is the part worth keeping. The only thing that changed is where one candle stopped: $65,600 became $64,400. That is $1,200 — about 1.8% of price, a difference you would barely register glancing at the chart. It moved the break-even win rate by 8.2 percentage points.
Eight points of win rate is more than most traders' entire edge. It came from a measurement almost nobody takes, on a part of the pattern everybody treats as scenery. When you are choosing between two head and shoulders setups, the low-shouldered one wins, and it is not close.
What does a sloping neckline cost you?
About a fifth of your reward-to-risk for a modest slope — and the direction that feels most bearish is the one that costs the most.
The classical material is right that the neckline needs flexibility; real markets rarely put the two valleys at the same price. But a neckline that slopes down means the break happens at a lower price than a flat one would, so your entry is lower — while the right shoulder, and therefore your stop, has not moved. You pay for the slope on the risk side and get nothing back on the reward side.
Take the k = 0.60 pattern above: H = $6,000, shoulder $3,600 above the neckline, ideal reward-to-risk 1.67R. Let the neckline slope down so that at the point of the break it sits $1,000 below where the left valley sat — a slope of one sixth of the pattern height, which looks perfectly ordinary on a chart.
- Risk becomes shoulder + slope = $3,600 + $1,000 = $4,600
- Reward is still the measured height = $6,000
- Reward-to-risk: 6,000 ÷ 4,600 = 1.30R, down from 1.67R
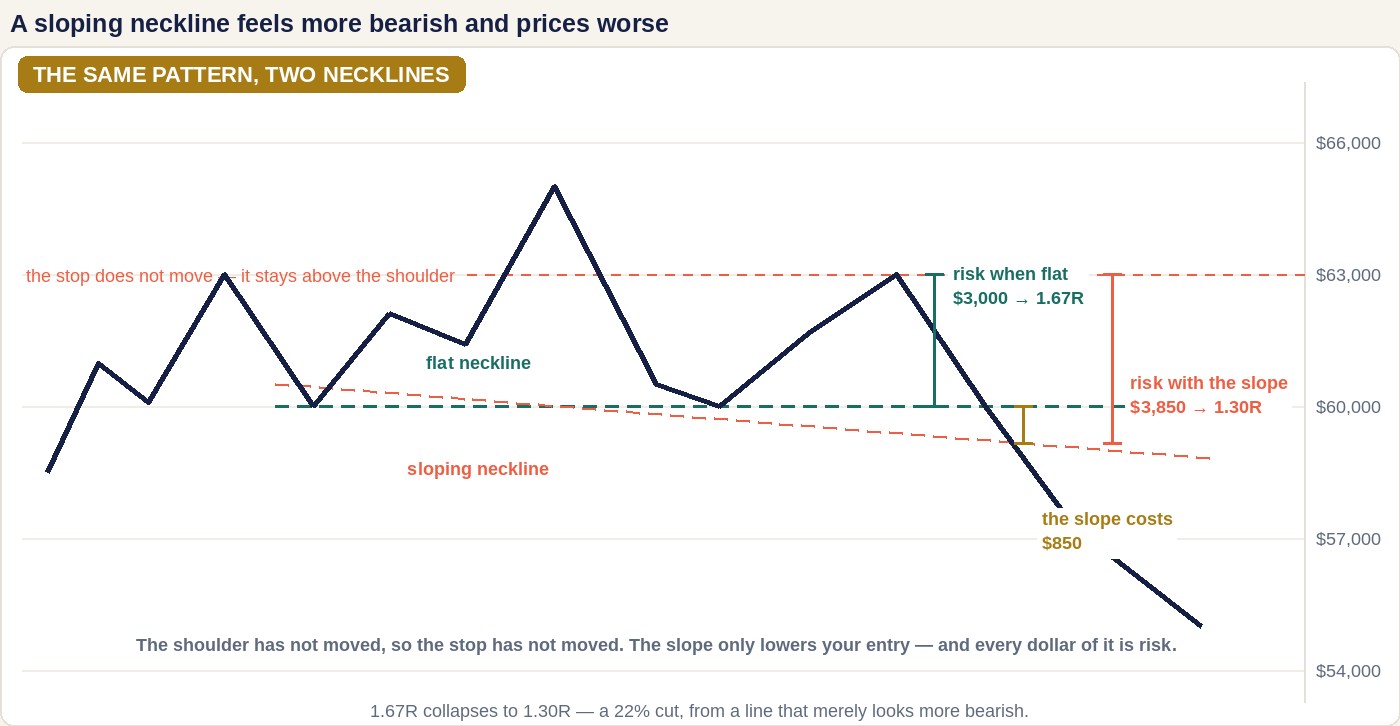
That is a 22% cut in reward-to-risk, lifting the break-even win rate from 37.5% to 43.4% — roughly six points. And here is the trap: a down-sloping neckline on a head and shoulders top reads as more bearish to most eyes, because the market is already making lower lows between the shoulders. The chart looks better and the trade prices worse. Both things are true at once, and only one of them is on your P&L.
The practical rule is short. Measure the slope in units of pattern height before you get excited. A slope of a sixth costs you a fifth of your R. A slope of a third roughly halves it.
How do you check one of these in four steps?
Same order every time, cheapest test first, because each step can kill the setup and there is no point measuring a pattern you are about to discard.
- Scroll left. Was there a trend to reverse? If the market was ranging into this shape, stop here — you have a range boundary, not a reversal pattern. This step costs three seconds and eliminates more bad trades than the other three combined.
- Run the void test. Does either shoulder exceed the head? Then there is no pattern, and no amount of redrawing changes that. On a double top, is the second peak meaningfully above the first? Then it is a higher high, not a double top.
- Measure k. Right shoulder height divided by head height, both from the neckline. You now know your reward-to-risk before drawing anything else: it is 1 ÷ k. Above k = 0.5 you are under 2R and should probably be looking elsewhere.
- Price it with the real levels. Entry where a candle actually closes past the neckline, stop above the actual shoulder high, target at neckline minus head height — then check the target is reachable, because a major support sitting above it will stop price before you get paid. Divide reward by risk. Under 2R, decline.
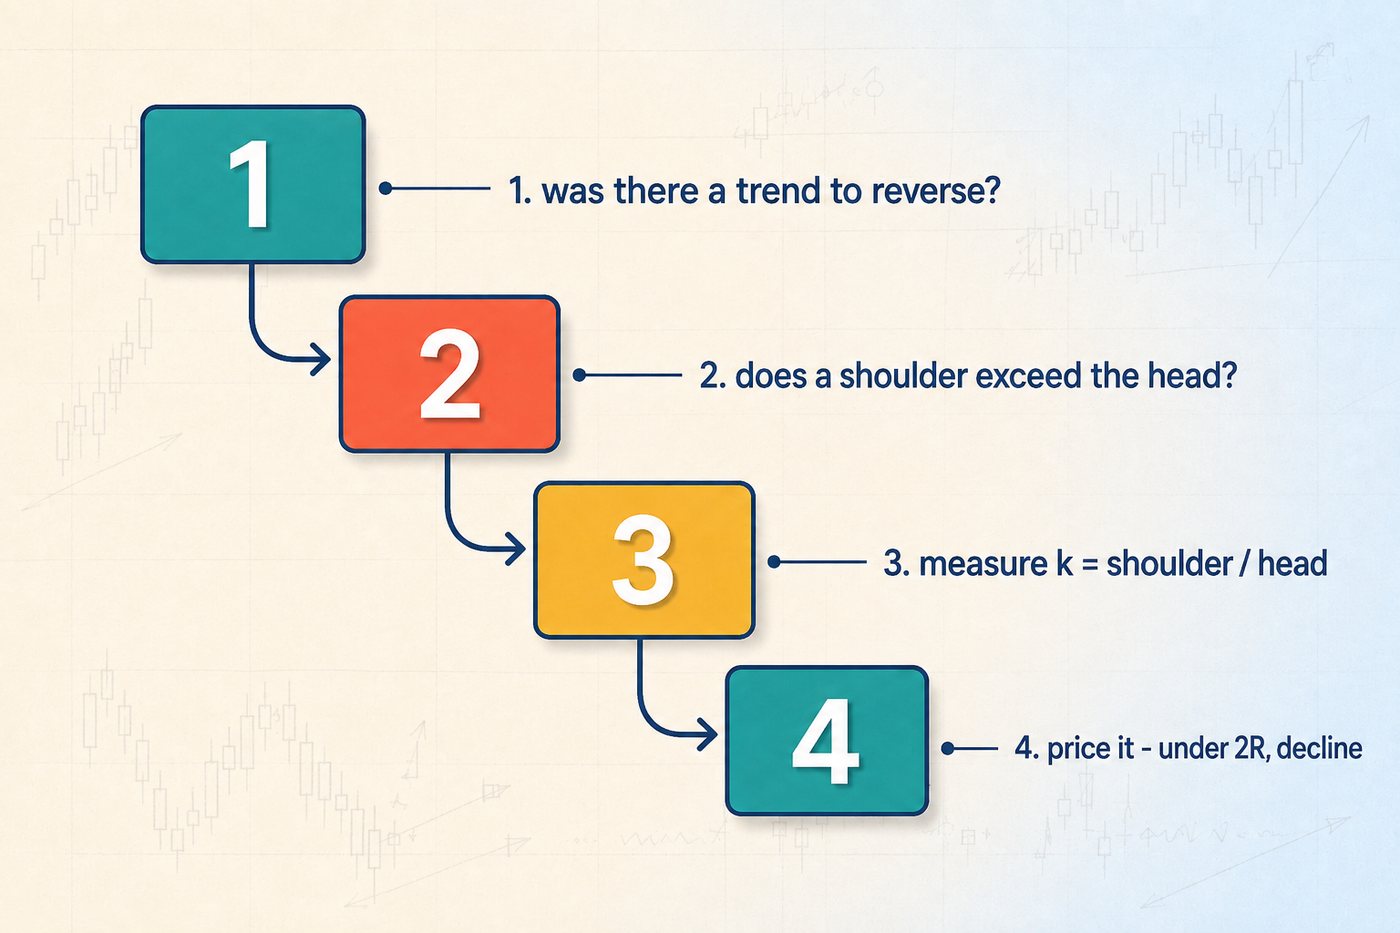
Step 3 is the one that is new, and it is the one that does the work. Steps 1 and 2 tell you whether a pattern exists; step 3 tells you what it is worth, in about four seconds, before you have committed to anything. Most traders go straight from “that is a head and shoulders” to placing an order, and skip the only measurement that determines what they get paid.
When is everything above wrong?
Four situations, and you will meet all of them.
When the frame above is still pushing the other way. A head and shoulders on the four-hour inside a daily uptrend that has not broken anything is a pattern arguing with a bigger pool of money than it can see. The shape is real; the reversal claim is not. Checking the frame above is what separates a reversal from a pause, and it is the single most common reason a textbook pattern fails without doing anything wrong.
When the measured target is unreachable. The measured move is a geometric convention, not a forecast, and it has no idea what is between here and there. If a major support zone sits above your target, price will very likely stop at the support, and the 2.07R you calculated becomes something closer to 1.1R in practice. Always check the road before you trust the destination.
When price is being moved by forced orders rather than decisions. A cascade of leveraged liquidations can drive price straight through a neckline, or straight through the second low of a double bottom, without any trader deciding anything. The pattern was not wrong; it was simply not what was in charge for those few minutes. Liquidation cascades explains the mechanism, and it matters more in crypto than in any other market retail traders touch.
When you have quietly changed the stop. Everything in this lesson assumes the textbook stop — above the shoulder for a head and shoulders, above the peak for a double top. A trader who puts the stop above the right peak’s local swing on a double top instead of the absolute high is running a genuinely different strategy with a different invalidation and a different reward-to-risk. That is allowed. What is not allowed is calling it a double top trade and then comparing its results to everyone else’s.
What are the most common mistakes here?
- Redrawing the neckline until the trade works. If a boundary needs a different slope every time you touch it, the exceptions have eaten the definition. “No pattern” is a valid conclusion and a free one.
- Trading a double top at the neckline and expecting head-and-shoulders money. It is fixed at 1.00R by geometry. If you want more than that from a double top, you have to enter at the second peak and accept that you are trading without confirmation.
- Never measuring the shoulder. It is the only number that decides your reward-to-risk, and it takes four seconds. A $1,200 difference in one candle’s high was worth 8.2 points of win rate in the worked example.
- Treating a bigger pattern as a stronger signal. Pattern height cancels out of the R:R entirely. What a taller pattern actually gives you is a wider stop and a smaller position.
- Calling a range top a double top. No trend in, no reversal out. The shape is identical and the meaning is absent.
- Letting a shoulder above the head slide as “close enough”. It is the one rule with a yes-or-no answer. Use it.
- Liking a down-sloping neckline because it looks bearish. A slope of one sixth of pattern height costs 22% of your reward-to-risk. The prettier chart is the worse trade.
What else do people ask about reversal chart patterns?
Is the head and shoulders really the most reliable chart pattern?
It is the best-priced of the reversal patterns, which is a different claim and a more useful one. Published reliability rankings are close to meaningless, because every study defines the pattern differently, tests a different market over a different period, and counts a win differently. What is not a matter of opinion is the arithmetic: a head and shoulders lets you put the stop above a shoulder while measuring the target from the head, so its reward-to-risk is 1 ÷ k. A double top gives you no such gap, so it is fixed at 1.00R. That structural difference holds in every market and every period, and it is a far better reason to prefer the head and shoulders than any hit rate you have been shown.
What timeframe do double tops and head and shoulders work best on?
The one-hour and four-hour, which is where the classical course material puts them, and the reason is structural rather than mystical. A reversal pattern is a record of a crowd arriving at a level, failing there, and failing there again — that takes time and participants. On a five-minute chart the same shape forms out of a handful of orders and records nothing. Go much higher than the daily and you meet the opposite problem: the pattern gets so tall that the stop above the shoulder is a large fraction of price, so position size shrinks to almost nothing. In crypto the four-hour is the sweet spot, with the one-hour usable if you have the patience to skip most of what forms there.
Do I have to wait for the neckline to break before entering?
You have to choose, and on a double top the choice is much more expensive than most traders realise. In the worked example on this page, entering on the confirmed neckline break gave 0.88R and needed a 53.3% win rate to break even. Entering on the rejection at the second peak, with no confirmation at all, gave 3.18R and needed 23.9%. That is a 29.4 percentage point gap — confirmation has to be worth nearly thirty points of win rate to pay for itself, which is a very high bar indeed. On a head and shoulders the gap is far smaller, because the stop above the shoulder already sits close to the neckline. So: wait for confirmation on a head and shoulders, and if you trade double tops at all, be honest that you are trading the resistance test rather than the pattern.
Does all this apply to the double bottom and inverted head and shoulders?
The geometry is identical, mirrored. A double bottom is fixed at 1.00R for exactly the same reason, and an inverted head and shoulders pays 1 ÷ k the same way. What changes is the market around them. Falls are usually faster and more violent than rises, so bottoming patterns tend to form on wider candles and give you a worse fill against the same stop, while topping patterns form during distribution and tend to be tidier. There is also a positioning asymmetry in crypto: leveraged long liquidations can drive price straight through a double bottom’s second low without anyone deciding anything. Treat the arithmetic as portable and the execution assumptions as not.
Keep the whole course next to your charts
The whole slide course — ten free PDF parts, 351 pages, taught on real charts.
The mirror image of all this — the patterns that say the move is resting rather than turning — runs on completely different arithmetic. A flag pays 1 divided by how deep it pulled back, and the flagpole cancels out of the sum entirely. Continuation and bilateral patterns works through it.