Continuation and bilateral patterns — flags, pennants, wedges, triangles and cup and handle
Every guide to these patterns is a catalogue. Here is a flag, here is a pennant, here is an ascending triangle, here is a cup and handle — nine shapes, nine names, and the strong implication that learning the names is the skill. It is not. Two of those nine shapes are the same trade with different stories, four of them share one formula, and one of them will pay you seven and a half times more or less depending on nothing but which of two names you gave it. This lesson replaces the catalogue with two formulas and shows you exactly which measurement on your chart decides what you get paid.
KEY TAKEAWAYS
- A flag pays R:R = 1 ÷ r, where r is the fraction of the pole the flag gave back. The pole height cancels out entirely — a $6,000 pole and a $60 pole with the same retracement are the same trade.
- The old rule “a flag should not give back more than half the pole” is literally the sentence “keep it at 2.00R or better”. Break-even win rate is r ÷ (1 + r) — and at the 0.618 retracement it lands on exactly 38.2%.
- Pennant or symmetrical triangle changed the target by 7.50× off an identical entry and stop: 6.67R against 0.89R. The ratio is just pole height ÷ pattern height, and the whole decision is one yes-or-no question.
- A converging triangle’s reward-to-risk looks better the longer you wait, but is capped at pattern height ÷ average candle range — 6.67R in the worked example. Past 85% of the way to the apex, the entire pattern is one candle wide.
- The cup and handle is a flag. Same formula, same 1 ÷ r, and the classic “handle no deeper than a third of the cup” rule is the 3.00R line in disguise.
What is a continuation pattern actually claiming?
That the move is resting, not finished — and that the rest has a size.
Strip the names away and every pattern on this page makes one argument: buyers were in control, they have stopped pushing for a while, and nothing has appeared to suggest the other side has taken over. The classical framing is worth quoting because it is more precise than the usual “the trend continues”: the run before the pattern tells you buying pressure was overwhelming, and the pattern itself is that buying pressure taking a break — not selling pressure arriving. Those are different claims with different evidence, and the difference is the whole lesson.
Two consequences follow, and both of them decide trades.
A continuation pattern needs something to continue. This is the mirror of the rule from reversal patterns, and it fails the same way. A small sideways box in the middle of a range is not a flag — it is a range doing its job. A flag is a claim about a crowd that was winning and has paused; there is no pause without a push. Diagnosing trend or range first is not optional preparation, it is the thing that decides whether the shape means anything at all.
The pattern is where your stop lives, so its size is a cost. This is the point that carried through candlestick patterns and reversal patterns, and it does all the work again here. Whatever shape you found, your invalidation sits on the far side of it. That means the pattern’s dimensions are not a curiosity for the chart-appreciation society. They are the denominator of your reward-to-risk, and they are measurable in four seconds.
So the useful question is never what is this pattern called. It is: where does this shape put my stop, and where does it put my target? Ask it that way and the nine shapes collapse into two families.
How much a wedge pays, and when, is its own lesson. The rule above — reward from the pattern’s own height, risk from its current width — is right, and it is also missing a term. Your stop needs a noise buffer, and the buffer does not shrink as the wedge converges, so the honest figure is 1 ÷ (c + β) rather than plain width over width left. The difference is small while the pattern is wide and enormous once it is narrow: at a tenth of the opening width the textbook says 10.00R and the trade is 5.00R. Lesson 29 works the whole family through — including why an expanding wedge is a sub-1R trade by construction, and why an ascending triangle that converges by exactly the same amount is a buy.
What are the two families, and why does the split matter?
One family gets its target from the move before the pattern. The other gets it from the pattern itself.
Here is the split, and it is the most useful thing on this page:
| Family | Members | Where the target comes from | Reward-to-risk formula |
|---|---|---|---|
| Pole family (continuation) | Bull & bear flag, pennant, cup and handle | The run before the pattern, projected from the breakout | 1 ÷ r r = pause depth ÷ run height |
| No-pole family (bilateral) | Symmetrical, ascending & descending triangles; rising & falling wedges; rectangles | The pattern’s own height at its widest | H ÷ w capped at H ÷ ATR |
Why this matters more than the names: the two families answer the question “how far might this go?” from completely different evidence. The pole family says as far as it just went. The no-pole family says as far as the disagreement was wide. Those can be wildly different numbers on the same chart, and the third section of this lesson prices exactly how different.
The classical course material draws the same line, using the word bilateral for the second family — two-way — because a triangle can resolve in either direction. That is not a hedge. It is the honest description of a shape that records two sides squeezing each other rather than one side resting. A pennant, by contrast, is filed as continuation because the pole already told you who was winning.

Why does a flag’s reward-to-risk depend only on how deep it pulls back?
Because the flagpole appears in both the reward and the risk, and cancels.
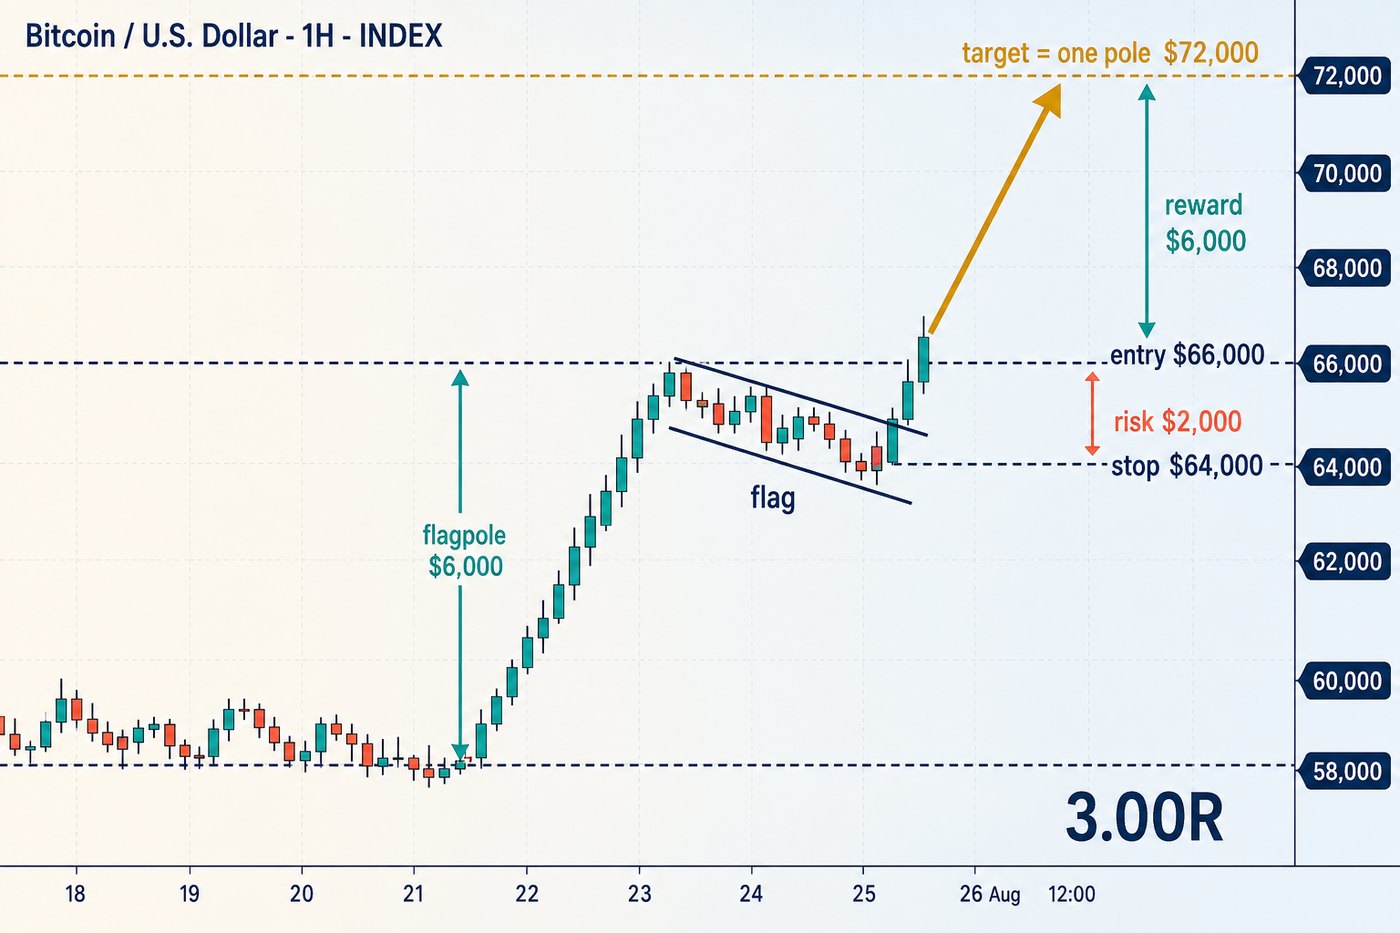
Set it up with the textbook rules and watch what happens. Bitcoin runs from $60,000 to $66,000 in a handful of near-vertical candles — that is the pole, height P = $6,000. It then drifts back in a tidy little channel. You enter on the break back above $66,000, put the stop under the flag’s low, and take the measured move: target = breakout + one pole = $72,000.
Now let r be how deep the flag pulled back, as a fraction of the pole. The flag’s low is B − rP, so:
- Risk = entry − flag low = B − (B − rP) = rP
- Reward = target − entry = (B + P) − B = P
- R:R = P ÷ rP = 1 ÷ r
P is gone. The size of the pole — the thing every guide tells you to look for, the thing that makes the chart exciting — has no effect whatsoever on what the trade pays. Here is the whole table:
| Flag gives back | Flag low | Risk | Reward | R:R | Break-even win rate |
|---|---|---|---|---|---|
| 33.3% of the pole | $64,000 | $2,000 | $6,000 | 3.00R | 25.0% |
| 38.2% | $63,708 | $2,292 | $6,000 | 2.62R | 27.6% |
| 50.0% | $63,000 | $3,000 | $6,000 | 2.00R | 33.3% |
| 61.8% | $62,292 | $3,708 | $6,000 | 1.62R | 38.2% |
| 78.6% | $61,284 | $4,716 | $6,000 | 1.27R | 44.0% |
Three things fall straight out of that table, and none of them are in the usual guide.
The famous rule is a price, not an aesthetic. “A flag should not retrace more than half the pole” has been repeated for eighty years as though it were about the flag looking right. It is not. Half the pole is r = 0.5 is 2.00R exactly. The rule is the sentence “do not take this below 2R” wearing a costume.
Break-even win rate has a closed form: r ÷ (1 + r). Since risk is rP and reward is P, the fraction of trades you need to win is rP ÷ (rP + P) = r ÷ (1 + r). And there is a small piece of arithmetic poetry sitting in the middle of that column: at the 0.618 retracement, break-even lands on 0.618 ÷ 1.618 = 38.2% — exactly the other Fibonacci number. It is a property of the ratio itself, not a market fact, but it does make one line of the table free to remember.
Bigger poles are not better trades. A $6,000 pole retracing half is 2.00R. A $600 pole retracing half is 2.00R. A $60 pole retracing half is 2.00R. What a bigger pole buys you is a wider stop in dollars, which means the same account risk buys fewer coins. Traders who hunt for the most dramatic pole are usually, without noticing, accepting deeper flags to get it.

There is one honest caveat to attach before you use this. The formula assumes the textbook entry — the break of the flag’s upper boundary, roughly back at the pole’s high. Real flags slope, real fills slip, and a breakout that fills $200 above the boundary quietly turns 3.00R into something nearer 2.7R. Recalculate with your actual fill rather than protecting the attractive number; the whole point of having a formula is that it takes four seconds to redo.
How much does calling a pennant a triangle actually cost?
In the worked example below, seven and a half times the target. Off the same entry and the same stop.
A pennant and a symmetrical triangle look almost identical: two converging boundaries, price coiling into a point, volume drying up through the formation. The classical material separates them with four tests, and the reason it bothers is not taxonomy.
| Test | Pennant | Symmetrical triangle |
|---|---|---|
| Flagpole immediately before? | Required | Not required, usually absent |
| How long it takes to form | Far shorter | Far longer |
| Which way it breaks | Usually with the existing trend | Either way — genuinely two-sided |
| Volume while forming | Low | Low — does not separate them |
| Classed as | Continuation | Consolidation / bilateral |
Now the money. Take one chart and read it both ways.
Bitcoin runs $60,000 to $66,000 — a $6,000 pole. It then coils, converging from a high of $65,200 down toward $64,400 over eight candles; the shape is $800 tall where it starts. You enter the upward break at $65,400 with a stop at $64,500, just under the coil. Risk is $900 either way. Only the target moves:
| You call it a… | Target comes from | Target | Reward | R:R | Break-even win rate |
|---|---|---|---|---|---|
| Pennant | The $6,000 pole | $71,400 | $6,000 | 6.67R | 13.0% |
| Symmetrical triangle | Its own $800 height | $66,200 | $800 | 0.89R | 52.9% |
Not a marginal difference. One reading is a trade you would take with a 13% hit rate; the other is a trade that loses money at anything under 53%. And the ratio between them is not mysterious — it is exactly pole height ÷ pattern height, $6,000 ÷ $800 = 7.50×, which is also 6.67 ÷ 0.89. That is a general result: every time you mislabel across the family line, you are off by the pole-to-pattern ratio, and that ratio is usually large, because the whole point of a pennant is that it is small relative to the run that made it.
The practical consequence runs in both directions and neither is comfortable. Read a real symmetrical triangle as a pennant and you set a target price will never reach, so you hand back a winner waiting for a level with nothing behind it. Read a real pennant as a triangle and you take $800 out of a $6,000 move — you were right, and you collected 13% of being right.

So the single question to ask, before any naming: did a sharp directional run arrive immediately before this shape, or did price wander in sideways? If you have to squint at the run to decide, treat it as no pole. The expensive error is the optimistic one.
Why does a triangle look better the longer you wait — and when does that number stop being real?
Because the stop shrinks while the target stays put. It stops being real the moment the whole pattern fits inside one candle.
This is the no-pole family’s own arithmetic and it behaves very differently from the flag’s. Take a symmetrical triangle on Bitcoin that starts $62,000 to $68,000 — height H = $6,000 — and converges evenly toward an apex 40 candles later. Its width at candle n is H × (1 − n/40).
Trade the break of the upper boundary, stop below the lower boundary at that moment, target one pattern height above the break. Then risk is the current width w, reward is H, and R:R = H ÷ w. Because w keeps shrinking, the number keeps improving:
| Break at | Triangle width | R:R on paper | Stop, in average candles | Holdable? |
|---|---|---|---|---|
| 25% to the apex | $4,500 | 1.33R | 5.00 | Yes — but poorly paid |
| 50% | $3,000 | 2.00R | 3.33 | Yes |
| 65% | $2,100 | 2.86R | 2.33 | Yes |
| 75% | $1,500 | 4.00R | 1.67 | Yes — getting tight |
| 85% | $900 | 6.67R | 1.00 | The ceiling |
| 90% | $600 | 10.00R | 0.67 | No — noise stops you |
| 95% | $300 | 20.00R | 0.33 | No — fiction |
The fourth column is the one nobody prints. Assume the average candle range on your frame is $900 — a fair figure for four-hour Bitcoin around $65,000, and the number you should replace with your own. Then dividing the triangle’s width by that gives you the stop measured in ordinary candles, which is the only unit that tells you whether the stop can survive a quiet Tuesday.
At 85% of the way to the apex the triangle is exactly one average candle wide. That is the crossover. Past it, the chart offers you 10R and 20R, and both are arithmetic about a shape that a single unremarkable candle can traverse end to end. You will be stopped out by nothing happening.
Which gives the general law, and it is a genuinely useful one to carry:
This also explains, at last, a piece of folklore. The classical teaching is that the break “usually comes somewhere between half and three-quarters of the way to the apex”, and it is normally offered without a reason. The reason is in the table: that band is where the stop is between 3.33 and 1.67 average candles — wide enough to survive normal noise, tight enough to pay 2R to 4R. Earlier is safe and badly paid. Later is well paid and unholdable.

The ascending and descending triangles are the same machine with one boundary flat. An ascending triangle has flat resistance and rising lows; a descending one has flat support and falling highs. The arithmetic above is unchanged — width is still width — and the flat side gives you one extra thing worth having: a clean horizontal level that other traders can see too, which makes the boundary more likely to matter and the break more likely to attract volume. Lesson 32 takes those two shapes on their own terms and finds the flat side is worth more than extra volume: it is the only part of a triangle you can retest, and the retest is the only entry that reaches the ceiling this lesson sets.
What are rising and falling wedges really telling you?
That the trend is getting less efficient — which is why they usually break against the direction they slope.
This is the shape most often filed in the wrong drawer, and it is worth being blunt about it. A rising wedge is made of higher highs and higher lows. Technically that is an uptrend. It appears inside an uptrend. It slopes up. Everything about it says continuation, and the classical reading is that it is bearish.
The reason is in the geometry rather than the direction. In a rising wedge, each new high is only barely above the last while the lows keep climbing at the old pace — so the two boundaries converge. The classical description is that the uptrend has run out of strength: buyers are paying progressively more to achieve progressively less. The falling wedge is the exact mirror — lower lows and lower highs, converging, sellers achieving less each push — and is read as bullish.
The classical entry rule for both is specific, and worth taking literally: wait for price to close beyond the far edge of the wedge, and require volume on the break. Not a wick through it, not an intrabar poke — a close, with participation. That volume requirement is doing real work here, because a wedge that ends quietly is usually just drifting rather than resolving. Check it against the bar underneath before you act.
Because a wedge converges, it belongs to the no-pole family and inherits its arithmetic exactly: reward from the pattern’s own height, ceiling at H ÷ ATR, same crossover near the apex. If you take one habit from this section, take the diagnostic rather than the label: are the pushes in the trend’s direction getting bigger or smaller? Expanding pushes mean the trend is healthy and the shape is a pause. Contracting pushes mean the shape is a wedge, whichever way it slopes.
Where does cup and handle fit — and why is the handle just a flag?
Because it is one. Same formula, same number, different story.
A cup and handle is a long rounded base — price falls away, curves along the bottom, and comes back up to the old high — followed by a small pullback near the rim, which is the handle, and then a break upward. It is drawn as a distinct pattern in every catalogue. Price it and it stops being distinct.
Cup low $60,000, rim $66,000, so cup depth D = $6,000. You enter on the break of the rim, stop under the handle’s low, target one cup depth above the rim: $72,000. Let r be how deep the handle pulled back as a fraction of the cup. Then risk = rD, reward = D, and:
| Handle retraces | Risk | Reward | R:R | Break-even win rate |
|---|---|---|---|---|
| 33.3% of the cup | $2,000 | $6,000 | 3.00R | 25.0% |
| 50.0% | $3,000 | $6,000 | 2.00R | 33.3% |
| 61.8% | $3,708 | $6,000 | 1.62R | 38.2% |
That is the flag table again, line for line. R:R = 1 ÷ r, break-even = r ÷ (1 + r), the cup depth cancelling exactly the way the pole did. The cup is a slow flagpole; the handle is the flag.
Which lands the last piece. The traditional rule that “the handle should not retrace more than about a third of the cup” is not an observation about how proper cups look. It is the 3.00R line, written in the language of shapes. Same rule, same arithmetic, same place as “a flag should not give back more than half the pole” — which is the 2.00R line. Two pieces of folklore, one formula, and now you can generate either of them yourself and pick your own cutoff instead of inheriting somebody else’s.
Two questions this page leaves open. What happens when the base has no handle — there is no r to divide by, and the cheapest stop with structure under it is the cup low itself, which is a very different trade. And whether the shape in front of you is a rounded base at all rather than a sharp V that the axis made look round. Lesson 30 answers both, and shows why the depth-projection rule used throughout this lesson is quietly conservative at a bottom and arithmetically impossible at a deep top.

When is everything above wrong?
Four situations, and you will meet all of them.
When the frame above disagrees. A beautiful bull flag on the one-hour inside a daily downtrend is a pattern arguing with a larger pool of money than it can see. The shape is real; the continuation claim is borrowed from a run that the bigger frame considers a bounce. Permission comes from above and prices come from your own frame — and the most common way a textbook flag fails is that it never had permission.
When the measured move has to walk through something. Both formulas are geometric conventions and neither has any idea what lies between here and the target. If a heavy resistance zone sits two-thirds of the way to your $72,000, price will very likely stall there, and your 3.00R becomes something nearer 2R in practice. Check the road before you trust the destination — it takes one glance.
When the boundaries need imagination. If a triangle’s upper line needs a different slope every time price touches it, or the flag only became a flag after the breakout, there is no pattern — there is a story about candles that already happened. “No pattern” is a valid conclusion, it is free, and it is the one that drawing boundaries honestly is designed to produce.
When forced orders are in charge. A cascade of leveraged liquidations can drive price straight through a flag’s low or a triangle’s boundary without anybody deciding anything. The pattern was not wrong; it simply was not what was setting the price for those few minutes. Liquidation cascades explains the mechanism, and it hits tight patterns hardest — which is precisely the patterns near the apex, where your stop was one candle wide to begin with.
One measurement carries straight into the next lesson. A flag’s retracement depth r is the same quantity a Fibonacci grid reports, and it prices pullback entries just as cleanly: the break-even win rate at a Fibonacci retracement is exactly 1 minus the level, which makes the shallow 0.382 entry a sub-1R trade even though it is the one with the strongest-looking chart.
What are the most common mistakes here?
- Hunting the biggest flagpole. Pole height cancels out of the reward-to-risk entirely. All a bigger pole gives you is a wider stop and a smaller position.
- Calling a coil a pennant because you want the bigger target. No sharp run immediately before it means no pole, means the pattern can only project its own height. The optimistic misreading was worth 7.50× in the worked example.
- Chasing the apex for the R:R. Past the point where the pattern is one average candle wide, the number on the chart is arithmetic, not a trade. The ceiling is H ÷ ATR and waiting does not raise it.
- Trading a rising wedge long because it slopes up. Contracting pushes inside a trend are the classic exhaustion reading, not a continuation shape.
- Ignoring the volume condition on a wedge break. The classical rule asks for a close beyond the edge with volume. A quiet break is usually drift.
- Calling a sideways box in a range a flag. No run in, no rest to continue. Identical shape, absent meaning.
- Keeping the original R:R after a bad fill. Slipping $200 into a $2,000 stop is 10% of your risk. Redo the division; it takes four seconds and it is the only honest number.
What else do people ask about continuation patterns?
Is a bigger flagpole a better trade?
Not in reward-to-risk terms, and this surprises almost everyone. The arithmetic is R:R = 1 ÷ r, and the pole height appears in both the reward and the risk, so it cancels out completely. A $6,000 pole that pulls back half is 2.00R; a $600 pole that pulls back half is 2.00R; a $60 pole that pulls back half is 2.00R. What a bigger pole genuinely changes is position size, because a bigger pole means a wider stop in dollars, so the same account risk buys fewer coins. It also changes how long you wait and how much of the move you can hold through. Those are real considerations — they are just not the same as the trade being better priced, and traders who chase dramatic poles usually end up accepting deeper flags to get them.
How do I tell a pennant from a symmetrical triangle?
Four tests, and the first one settles most cases. A pennant requires a flagpole — a sharp, near-vertical run immediately before it — and a symmetrical triangle does not, and usually does not have one. A pennant forms in far less time; if the shape has been building for forty candles it is a triangle whatever preceded it. A pennant usually breaks with the existing trend, which is why it is filed as continuation, while a symmetrical triangle can break either way, which is why it is filed as bilateral. Volume through the formation of both is low, so volume will not separate them for you. This is worth more than a naming argument because the two labels compute different targets from an identical chart: 6.67R against 0.89R in the example above, a ratio of exactly pole height divided by pattern height.
Why is a rising wedge bearish when it is going up?
Because what it measures is not direction but the rate of change of direction. A rising wedge has higher highs and higher lows, so it is technically still an uptrend — but each new high is only barely above the last while the lows keep climbing at the old pace, so the boundaries converge. That convergence is the market saying buyers are paying more to achieve less; the classical description is simply that the uptrend has run out of strength. A falling wedge is the mirror image and the mirror conclusion. This is the most common filing error in chart patterns, because a rising wedge appears inside an uptrend and looks like continuation. Two things protect you: check whether successive pushes are expanding or contracting, and require the break to come with volume, exactly as the classical entry rule asks.
Should I enter before a triangle breaks out?
That is a different strategy, not an early version of this one, and it needs its own record. Entering at the lower boundary on the assumption it holds gives you a much better price and a much tighter stop, but your invalidation is now the boundary rather than the pattern, and you are taking a range trade inside a shape you have decided is a continuation. Both approaches can work; mixing them in one performance log cannot, because you will never know which one earned the result. Entering late has its own trap, and it is the arithmetic one: the closer to the apex you break, the better the paper reward-to-risk, but past the point where the pattern is one average candle wide that number is fiction. The ceiling is H ÷ ATR, and no amount of patience raises it.
Keep the whole course next to your charts
The whole slide course — ten free PDF parts, 351 pages, taught on real charts.