Rounding patterns — cup and handle, rounding bottom and top
Rounding patterns are the ones every catalogue draws and almost nobody prices. You are shown a smooth bowl, told it means accumulation, and sent off to buy the break of the rim. Two things go unsaid, and both of them cost money. The first is that a bowl with no dent in its right-hand side gives you nowhere to put a stop, which is worth exactly three times as much as the shape is. The second is that the standard measuring rule — project the depth from the breakout — is quietly conservative at the bottom of a chart, inflated at the top of one, and arithmetically impossible once a dome has doubled — which in crypto happens long before you notice. This lesson works both out from the numbers, and gives you a way to check that a base is round at all rather than trusting your eye.
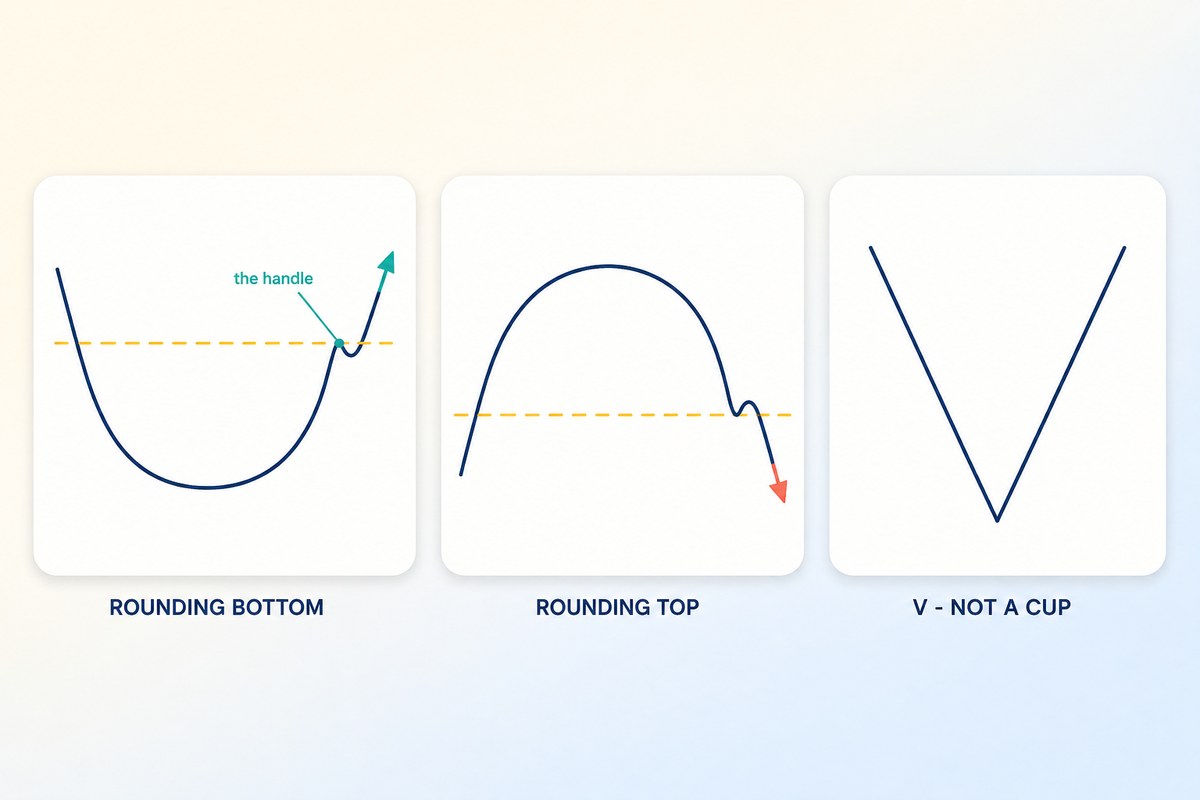
Schematic only — deliberately drawn without a price scale, because nothing in it is meant to be measured, and deliberately drawn smooth. Real bases are a series of swings, which is what the measured charts below show. Every number in this lesson is on the charts further down, which are drawn from the prices themselves.
KEY TAKEAWAYS
- Roundness is measurable. Count the candles whose low sits in the bottom tenth of the base’s depth. A V spends about 10% of its candles there, a proper cup about a third, a saucer more than half.
- The shape does not price the trade. Depth and stop distance do. Three bases with identical depth pay identically whatever their curvature.
- A higher low on the right-hand side is worth up to 3×. Same cup, same $6,000 reward: stop under the base low is 1.00R; stop under a higher low a third of the way up is 3.00R — 25 points of break-even win rate, 50.0% down to 25.0%. How much you actually get depends on how high that low sits; Lesson 31 has the full range.
- If you can find a cheap stop inside a base, you have found a handle — whether or not anyone drew one. If you cannot, the trade is a 1.00R trade, and no amount of roundness improves it.
- At a bottom the classical target under-promises by a factor of rim ÷ low. At a top the same rule over-promises by 1 + g, and once a dome has gained 100% over its neckline the rule returns zero, and beyond that a negative price.
- The two ways of projecting agree within a tenth only for moves under about 10%. Above that you are choosing, whether you know it or not.
What makes a base “rounded” — and can you measure it?
Time spent at the extreme, and yes. A base is rounded when its low is made across many candles rather than in one; everything else people say about the shape follows from that one property, and it is countable.
“It looks like a bowl” is not a test, because on a chart you can shrink the axis until anything looks like a bowl. Here is a test instead. Take the depth of the base — low to rim — and mark off the bottom tenth of it. Now count how many of the base’s candles have their low inside that band, and divide by the total number of candles in the base. That single fraction tells you what kind of bottom you are holding.
It has a closed form, which is worth seeing because it shows how sharply the number separates shapes that look similar. Model the base as a curve of the form low + depth × |u|p, where u runs from −1 on the left rim to +1 on the right rim and p is how blunt the curve is. The fraction of the base spent in the bottom tenth is then simply 0.11/p:
| Shape | p | Share of the base in the bottom tenth | On a 60-candle base |
|---|---|---|---|
| V — one candle turns it | 1 | 10.00% | ~6 candles |
| Soft V | 1.5 | 21.54% | ~13 candles |
| Cup — the classical rounded base | 2 | 31.62% | ~19 candles |
| Saucer — long and flat | 4 | 56.23% | ~33–34 candles |
| Rectangle base | ∞ | 100% | 60 candles |
Which gives a working rule you can apply without any arithmetic at the screen: under about a fifth of the candles in the bottom tenth and you are looking at a V, not a cup. Around a third and the base is genuinely round. Over half and it is closer to a rectangle — a flat range rather than a base, and one that takes its target from its own height rather than from a curve. Lesson 31 sets out that family.

Notice what the three panels have in common: an identical $6,000 depth and an identical rim. Whatever you decide the shape means, it is not going to come from the depth, because the depth is the same in all three. That matters more than it sounds, and the next section is about why.
One honesty note before moving on. The percentages above are the geometry of a model curve, not a measurement of any market. They are useful because they turn a word you cannot check — rounded — into a count you can, on your own chart, in about twenty seconds. They are not a claim about how often bases of each type appear or work.
If the shape does not change the payoff, what does?
Where the stop goes. And on a rounding base that is not a preference, it is a question of whether the right-hand side of the pattern happens to contain anything to hide behind.
Take the cup Lesson 31 priced: low $60,000, rim $66,000, so depth D = $6,000, entry on the break of the rim, target one depth above it at $72,000. That is the same cup here, deliberately, so the two lessons stack rather than compete. Lesson 31 priced the version with a handle. This is the version without one.
The reward is fixed at $6,000 in all cases — it comes from the depth, and the depth does not care where your stop is. So every difference in the trade is a difference in risk, and there are only three honest candidates.

| Where the stop goes | Price | Risk | Reward-to-risk | Break-even win rate |
|---|---|---|---|---|
| Under the base low | $60,000 | $6,000 | 1.00R | 50.00% |
| Under a higher low on the right-hand side | $64,000 | $2,000 | 3.00R | 25.00% |
| A fixed 10%-of-depth buffer under the rim | $65,400 | $600 | 10.00R on paper | 9.09% |
One caveat carried over from Lesson 29 before reading any of those numbers: these are the structural distances, before the buffer you would actually put under them. Add one and every row moves the same way — the $2,000 stop with a $900 buffer is 2.07R rather than 3.00R. The ordering does not change, which is why the comparison holds, but each headline figure is the optimistic one.
Read the first two rows and the whole lesson is in them. Identical shape, identical target, and one of them needs to be right twice as often as the other to break even. The difference is 25 points of break-even win rate, and it was produced by nothing except whether the base happened to leave a higher low behind on its way up.
Now the third row, because it is the one people reach for when the first two disappoint. A $600 stop under a $66,000 rim looks like a bargain until you ask what it is measured against. Lesson 31 put a ceiling of this kind on converging patterns, and the reason generalises to any stop: a risk leg cannot honestly be smaller than one ordinary candle, so reward-to-risk is bounded by reward ÷ average candle range whatever the shape. With a $900 average range, this cup’s ceiling is $6,000 ÷ $900 = 6.67R. The 10.00R is not a good trade you found; it is a number the chart cannot pay.
Which produces the sentence worth taking away from this section: if you can find a cheap stop inside a rounding base, you have found a handle — whether or not the pattern was labelled as having one. The higher low at $64,000 in the chart above is a handle. Nobody drew it, no catalogue named it, and it is doing the entire job that the word “handle” does in the textbook version. And the reverse holds too, which is the uncomfortable half: a cup with a genuinely smooth right-hand side is not a cheaper trade waiting for a better entry. It is a 1.00R trade, and the only things that change that are waiting for a pullback to form or passing.
Why is the measured move conservative at a bottom and inflated at a top?
Because the classical rule measures in dollars while the market moves in percentages, and the gap between those two opens in opposite directions at the two ends of a chart.
The rule everyone is taught is: measure the depth of the pattern, project it from the breakout. On a rounding bottom with low L and rim N, that is a target of N + (N − L). On a rounding top with dome high H and neckline N, it is N − (H − N). Same rule, mirrored.
There is a second way to say the same thing, and it is the one ratio-based work implies without stating: project the ratio rather than the difference. It is not the classical rule — the classical rule is the points one — but it is the rule that stays inside the range of prices that can exist, and that turns out to matter. Lesson 33 deals with those ratios directly; here they are only a second way of measuring. A base that fell to two-thirds of its rim projects a rise to three-halves of it. A dome that multiplied by 2.3 on the way up projects a division by 2.3 on the way down. The two simply disagree, and the size of the disagreement is the size of the move.
| Rounding bottom | Fall | Points target | Ratio target | Ratio reward ÷ points reward |
|---|---|---|---|---|
| $60,000 → $66,000 | 9.09% | $72,000 | $72,600 | 1.10× |
| $45,000 → $60,000 | 25.00% | $75,000 | $80,000 | 1.33× |
| $30,000 → $60,000 | 50.00% | $90,000 | $120,000 | 2.00× |
The identity behind that last column is short: on a bottom, the ratio basis pays N ÷ L times what the points basis pays. Deeper base, bigger gap, and always in the direction of the points rule promising less. That is a comfortable failure. A conservative target is a target you may beat.
Now the same rule at the top of the chart, where g is how much the dome gained above its neckline:
| Dome gained | Points target | Ratio target | Ratio reward ÷ points reward |
|---|---|---|---|
| +10% | 0.900 × neckline | 0.909 × neckline | 0.909 |
| +25% | 0.750 | 0.800 | 0.800 |
| +50% | 0.500 | 0.667 | 0.667 |
| +80% | 0.200 | 0.556 | 0.556 |
| +100% | 0.000 — zero | 0.500 | 0.500 |
| +130% | −0.300 — negative | 0.435 | 0.435 |
The last two columns carry the same numbers, and that is not a copy-paste slip: the ratio target as a multiple of the neckline and the ratio-to-points reward ratio are both 1 ÷ (1 + g). Which is the identity here, and it runs the other way from the one at the bottom: at a top the points rule promises more, by a factor that grows with the size of the dome, until at +100% it promises a target of exactly zero and beyond that a negative price. The rule does not degrade at that point. It stops meaning anything.
That threshold is not exotic in crypto, which is the entire reason this section exists. A rule written where a doubling is a decade’s work behaves well; the same rule applied to an asset that tripled inside a year returns an impossible number, and it returns it silently, because a spreadsheet will happily subtract $39,000 from $30,000.

Work the dome on the right of that chart all the way through, because the size of the error is the point. Neckline $30,000, dome high $69,000, so the dome gained 130% and its depth is $39,000. You short the break of the neckline and put the stop above the last lower high on the right-hand side of the dome, at $34,500 — a risk of $4,500.
| Basis | Target | Reward | Reward-to-risk | Break-even |
|---|---|---|---|---|
| Points — neckline − depth | −$9,000 | — | 8.67R on paper | — |
| Ratio — neckline ÷ 2.30 | $13,043 | $16,957 | 3.77R | 20.97% |
The 8.67R is not a target you missed by a little. It is 2.30 times the honest figure — exactly 1 + g, every time — and it points at a price that cannot be reached in a market where zero is the floor. A trade sized off it would be a trade whose reward leg was fiction.
So the practical rule is a threshold rather than a preference. The two bases stay within a tenth of each other while a dome has gained less than about 11%, or a base has fallen less than about 9%. Under that, use whichever you like. Over it, you are making a choice, and the honest third option is often better than either: take the target from a level that already exists on the chart — the last significant high or low from Lesson 12 — and let the measured move be a sanity check rather than the plan.
So what is the roundness actually evidence of?
Less than the story claims, and the honest version is more useful than the story. The curve is not evidence. The departure from the curve is.
The standard account is that a rounded base shows accumulation: sellers exhausting slowly, buyers absorbing slowly, control changing hands without drama. It is a plausible mechanism, and it explains why a rounded base feels different from a spike low even when the arithmetic is identical. At a V bottom the last sellers left in a hurry and the supply sitting above them was skipped rather than worked through. Across a rounded base, price passes each level twice at similar prices, once going down and once coming back, so a large part of the stock that changed hands on the left of the bowl has had the chance to change hands again on the right.
That is a mechanism, and it should be labelled as one. It is not measured here, and nothing in this lesson tests how often it holds.
There is also a reading in our own course notes that cuts against the story, and it is worth stating because it changes what you look for. The notes treat a market with no measurable difference between buying and selling pressure as a market with no information in it — a frame with nothing to report, and therefore nothing you can decide on. A textbook rounded base, drifting sideways with narrowing swings and no push in either direction, is very close to a description of exactly that state. Which is not a contradiction, provided you say the thing precisely:
The bowl is the absence of a signal. What you are trading is the moment price stops behaving like a bowl.
That reframes the checklist rather than throwing it away, and it is where the course notes are unusually direct. From the volume section of the slide course: volume stays low through the whole consolidation or accumulation phase, which is normal and not a signal by itself; a break out of a consolidation, an accumulation, a pattern or a level that comes without rising volume is very likely a false break; and for any reversal signal to be trustworthy, a clear rise in traded volume is the first thing a trader wants to see. Notice how well those three lines fit the shape under discussion. The base is allowed to be quiet. The exit from it is not.
So the falsifier is available and cheap: if the break of the rim arrives on volume no greater than the volume inside the base, the accumulation story has no support in the one place it could have left a trace. You still have a shape. You no longer have a reason. Lesson 14 covers reading that comparison properly.
Where does that leave the cup and handle?
Priced already, and priced somewhere else. Lesson 31 works the cup-with-a-handle through in full — the identity it lands on, the table of retracement depths, and what the old one-third-of-the-cup rule turns out to be underneath. That is the reason this lesson does not re-derive any of it: the handled version already has a price, and it is on that page rather than this one.
What is left over is everything the handled case never has to answer. The division between the two pages is worth being explicit about:
| The question you have | Where it is answered |
|---|---|
| There is a handle. What does the trade pay? | Lesson 31 — the 1 ÷ r table |
| There is no handle. Where does the stop go? | This lesson — 1.00R, and why |
| Is this even a rounded base? | This lesson — the bottom-tenth count |
| It is a dome, not a bowl. What is the target? | This lesson — and not the points rule once the dome is deep |
One observation about our own course materials, since it explains an absence you would otherwise notice. Cup and handle appears in the slide course exactly once, in the list of trend-reversal patterns, alongside double bottom, triple bottom, inverted head and shoulders and the falling wedge. Unlike every one of those, it never gets a “how to trade the pattern” slide. Rounding bottoms and rounding tops are not in the notes at all — which is why the measurement work above is built here from first principles rather than quoted, and is flagged as such.
The absence turns out to be defensible rather than an oversight, and Lesson 31 is the reason: a cup with a handle does not need its own entry rule, because it already has the flag’s. What genuinely lacks a rule is the case the catalogues draw most often and price least — the bowl with nothing on its right-hand side. That is the gap this lesson fills.
How do you check a rounding pattern, in order?
Six steps, and the first and the third can disqualify the trade before you have thought about a target.
- Count the bottom tenth. Mark the band from the low up to a tenth of the depth. Under about a fifth of the base’s candles inside it and you have a V — a different pattern, and one with no right-hand structure.
- Look for a higher low on the right-hand side. That is your stop, and how high it sits is the difference between a 1.00R trade and something up to 3.00R. If there is not one, say so out loud before you talk yourself into a tighter stop.
- Check the stop against one average candle. Closer than that and the reward-to-risk you calculated is a number the chart cannot pay; the real ceiling is depth ÷ average range.
- Measure the depth as a percentage, not just in dollars. Under about 10% and the two projection bases agree. Over it, decide which one you are using — and on a dome that has gained 100% or more, the points rule is out of the running by arithmetic.
- Compare the breakout volume with the volume inside the base. No expansion, no evidence. The course notes are blunt about this and they are right to be.
- Write the three prices down before you enter — entry, stop, target — and calculate the break-even win rate. If you are not willing to be right that often, the pattern being pretty does not help.
When is everything above wrong?
In four places, and they are worth knowing precisely rather than vaguely.
If you do not use the measured-move rule at all. Everything in section 3 prices a convention. If your targets come from levels, or from a trailing exit, then the points-versus-ratio question never arises — and on deep patterns that may well be the better answer.
If the base is bigger than the frame you trade. A base that takes four months on the daily is not a setup on the four-hour chart, it is the backdrop. The stop distances above are in dollars because the frame was fixed; change the frame and every number changes with it. Lesson 21 covers deciding which frame owns a move.
If you are reading the shape backwards in time. Roundness is only fully visible after the right-hand rim exists, which is after the trade would have had to be planned. The bottom-tenth count is honest at the moment of the break and dishonest applied to a chart you scrolled back to.
If the depth is small relative to the noise. A $6,000 cup on an asset whose candles average $900 is a real structure. The same cup where candles average $4,000 is not a cup, it is a candle and a half of depth with a curve drawn on it, and no measuring rule survives that.
And one boundary that is not an exception but a scope note: every percentage on this page is a break-even figure — the strike rate a trade needs in order to be worth taking. None of them is a claim about how often any of these patterns works. That number is not measured here, and you should be suspicious of anyone who quotes it without saying over what sample.
What are the most common mistakes here?
| Mistake | What it costs | The fix |
|---|---|---|
| Buying the rim break with the stop under the base low, without noticing | 1.00R instead of 3.00R — break-even doubles from 25.0% to 50.0% | Find the higher low first. If there is not one, that is the trade you are taking. |
| Tightening the stop until the ratio looks good | A number the chart cannot pay; ceiling is depth ÷ average candle | Compare the stop distance with one average candle before believing the R. |
| Projecting a dome’s depth in dollars after a large run-up | Over-states the reward by 1 + g; above +100% the target is negative | Project the ratio, or take the target from a real level. |
| Calling a V a cup because the axis made it look round | No right-hand structure, so no cheap stop exists | Count the candles in the bottom tenth. Under a fifth means V. |
| Treating the quiet base as the evidence | Entering a shape that has produced no signal yet | The break is the event. Check its volume against the base’s. |
| Quoting a success rate for the pattern | A number nobody in this lesson measured | Use break-even win rate, which is arithmetic, and decide if you can beat it. |
PRACTICE CORNER
Do the count, because the whole lesson turns on whether the base has a right-hand side and that is not something you can settle by looking. Open a liquid pair on the four-hour chart and scroll back until you find a bottom that took at least thirty candles to form. Mark the low and the rim, work out the depth, and draw a horizontal line a tenth of that depth above the low. Now count the candles whose lows sit under that line and divide by the number of candles from rim to rim. Write the fraction down.
Then do the part that pays. Find the last higher low on the right-hand side of that base and measure the distance from it to the rim. Divide the depth by that distance — that is your reward-to-risk, before any buffer. Now compare it with the depth divided by the distance from the rim down to the base low, which is always 1.00R because those two numbers are the same number. That second figure is what you would have got with no handle. Do it on three bases and the gap between the two stops being a claim and becomes a spread you have measured. It will not be 3× on all three — 3× is what this lesson’s cup happens to give. What repeats is the direction of the gap and roughly how big it is. Any exchange chart with a measuring tool will do; if you do not have one open, these three all have the drawing tools you need on the free tier.
Affiliate disclosure: the links below are partner links. We may earn a commission at no cost to you. It does not change what this lesson says. Full disclosure.
What else do people ask about rounding patterns?
Is a cup and handle bullish, and how reliable is it?
Bullish is the classical reading, and it is the one both this course and this lesson use: a rounded base that returns to its old high and then pulls back shallowly is read as buyers having absorbed the supply that created that high. Reliability is a different question and this lesson deliberately does not answer it, because answering it honestly needs a measured sample and a stated market, timeframe and date range — and the numbers quoted around the internet almost never come with any of those. What you can have instead is the number that does not need a sample: the break-even win rate. With a handle retracing a third of the cup the trade is 3.00R and needs to work 25% of the time; with no handle and the stop under the base low it is 1.00R and needs 50%. Those are arithmetic, they are yours to check, and they are the right input to the decision. Whether your particular market clears them is something only your own record can say.
Where do you put the stop on a rounding bottom that has no handle?
Under the base low, and you take the 1.00R that comes with it — or you wait for a handle to form and take the 3.00R version. There is no third option that survives contact with the arithmetic. The tempting one is a fixed buffer under the rim: on the worked example, $65,400 gives a $600 risk against a $6,000 reward and a headline 10.00R. But $600 is less than one average candle at an assumed $900 range, and reward-to-risk on a break is bounded by depth divided by that average range — 6.67R here. So the 10.00R is not achievable, and more importantly the stop has nothing under it: it is not marking the level at which the pattern would be wrong, it is marking a round number below the entry. A stop should be at a price which, if traded, tells you something. Under a higher low it does. Under a buffer it does not.
Is a rounding top just an upside-down rounding bottom?
Geometrically yes, arithmetically no, and the difference is the most useful thing on this page. Both are read the same way — the extreme is built slowly, the neckline or rim is the trigger, the depth is the target — but the classical dollar-based projection behaves in opposite ways at the two ends. At a bottom it under-promises, by a factor of rim divided by low; a base that fell 50% gives a points target only half as far as the ratio basis would. At a top it over-promises, by a factor of one plus the dome’s percentage gain, and once the dome has gained 100% or more over its neckline the points target lands at or below zero, which is not a bad target but a meaningless one. In equities, where a dome that doubles is unusual, the asymmetry rarely bites. In crypto it bites often, and it does so quietly, because subtracting a large depth from a small neckline is a calculation your spreadsheet will perform without complaint.
How long does a rounding base have to be?
Long enough that the low is made by many candles rather than one, which is a property you can count rather than a number of weeks you have to memorise. The usual advice — weeks to months — comes from equity literature and does not transfer cleanly to a market that trades continuously, so the count is the better test: a proper cup spends roughly a third of its candles in the bottom tenth of its depth, a V spends about a tenth of them there. What duration genuinely does control is which timeframe owns the pattern, and that decides everything downstream. A base spanning forty daily candles is a daily-chart structure; its stop distances and its target belong to the daily chart, and reading it on a four-hour screen will produce risk numbers that have nothing to do with the trade you are actually in.