Multi-timeframe analysis — why the frames must agree before a trend exists
Almost everyone is told to “check the higher timeframe”, and almost nobody is told what to do with the answer. So it gets used as reassurance: glance at the daily, see green, feel better, place the trade. That version of the technique is not merely useless — it is one of the few pieces of standard advice that can reliably make a correct trade unprofitable, and it does so through arithmetic rather than psychology. This lesson shows what the higher frame is genuinely for, how to work out which frame to look at from your own holding period, and exactly what it costs when you let a chart you are not trading decide a price you are.
KEY TAKEAWAYS
- Direction comes from above; the stop comes from your own frame. The higher chart answers one question — am I allowed to be long at all — and never supplies the stop. The course's entry is: larger frame trending, smaller frame tightening and crossing the same way; enter only once that cross is confirmed — RSI through both its averages and the EMA 9 through the WMA 45 — stop from the small frame's swing, target from the large frame's wave.
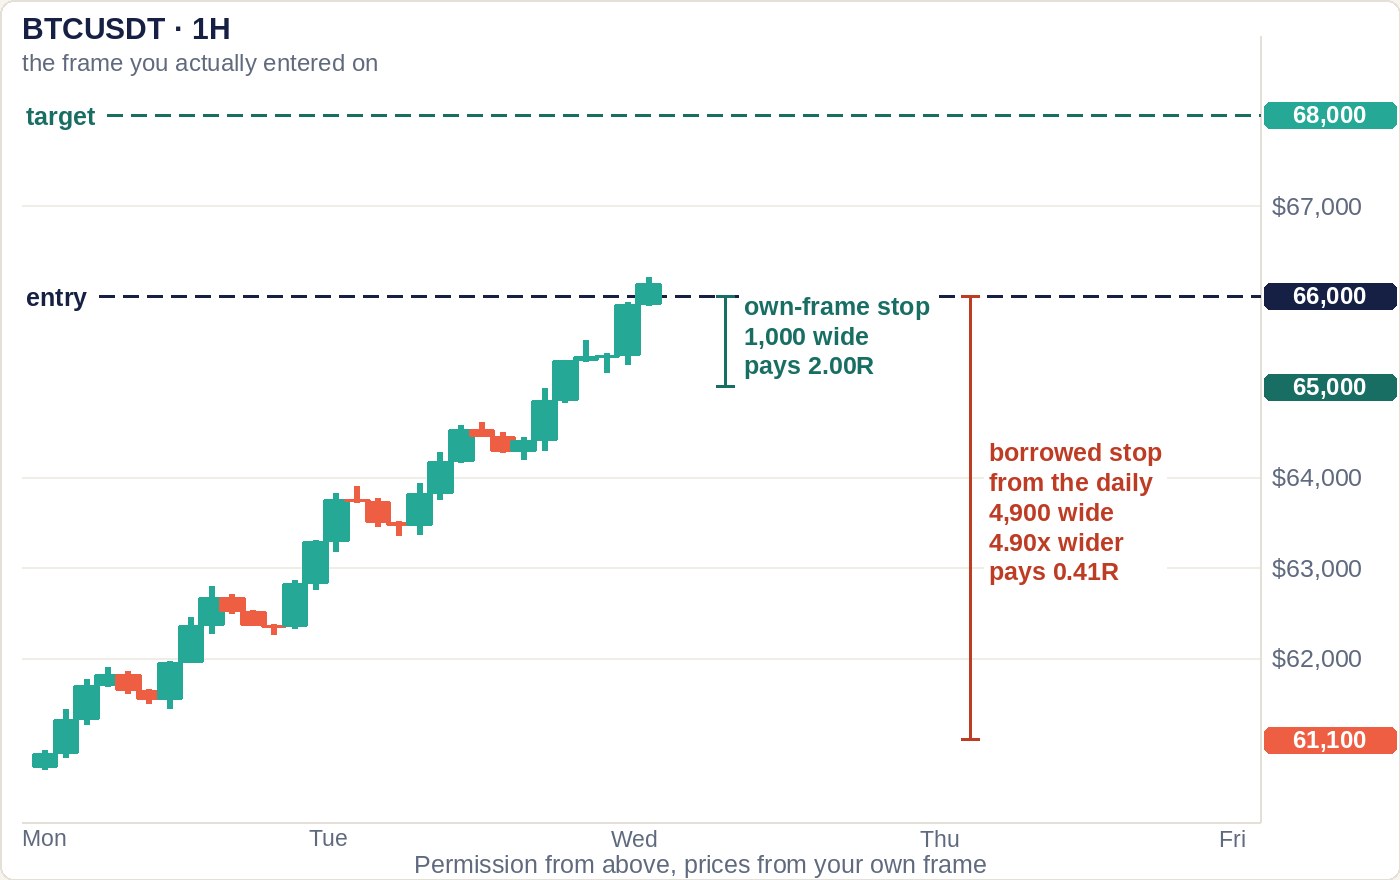
- Borrowing a stop from the daily while entering on the 1-hour makes it 4.90× wider, so the position is 4.90× smaller and a 2.00R trade pays 0.41R. The share destroyed is exactly 1 − 1/√n — and on real BTCUSDT bars the daily was 6.2× the hourly, not 4.90×, so the model is the kind end of the estimate.
- Pick a confirming frame whose candles close 1 to 4 times during your typical hold — 3× to 12× up. Closer is an echo; further is a frozen constant.
- A flat higher frame is an abstention, not a vote against you. It means no help and no fight, so trade your own frame at your own size.
- While two frames run in phase there is no swing low to trail to, because a strictly rising sequence never makes one. The rule you trust is doing nothing.
What is multi-timeframe analysis actually doing?
It is taking a headcount. Not confirming a signal — counting who else is pushing.
Every timeframe on your chart is drawn from the same trades, but each one is watched by a different group of people with different money behind it. A 15-minute trader is out before lunch. A weekly holder is planning to still be there in November. They have different targets, different tolerances for being wrong, and therefore they buy and sell at different moments. The price you see is nothing more than the running total of what all of those groups did.
Once you say it that way, the most common complaint in trading answers itself. “The setup was textbook and it still failed” usually means: the setup was textbook on your frame, and a bigger pool of money was selling into it from a frame you never looked at. Your 100 units of buying was real. It just met 700 units of selling that had nothing to do with your pattern.
There is one reframe here that fixes more beginner mistakes than anything else in this lesson. A flat higher frame is not a vote against you. It is an abstention. A frame that is going sideways is contributing no buying and no selling — it has no opinion, so it hands the decision to whichever frame does. Most people read a sideways daily as “bearish, stay out” and skip perfectly good setups for weeks. The correct reading is: nobody up there is going to help you, and nobody up there is going to fight you either. You are on your own, at your own size.
Which frames should you even compare?
For the state of the market, all of them: on this site each system is read on W1, then D1, then 4h, then 1h, and every frame gets one of three labels — up, down or sideways. When a frame’s wave has lost validity (RSI back inside 40–60 and crossed the other way, with its EMA 9 and WMA 45 crossed back too), that frame no longer decides the trend: step up, and the nearest larger frame that still has a live wave sets the market’s direction. For the trade in front of you, one frame: the one directly above the frame you enter on, which in practice sits between roughly 3× and 12× up. Here is where that range comes from, because it is not tradition.
A higher frame is only telling you something if it can change its mind while you are still in the trade. So the test is arithmetic: how many of its candles actually close during a typical hold? Say you enter on the 1-hour and hold for twelve hours.
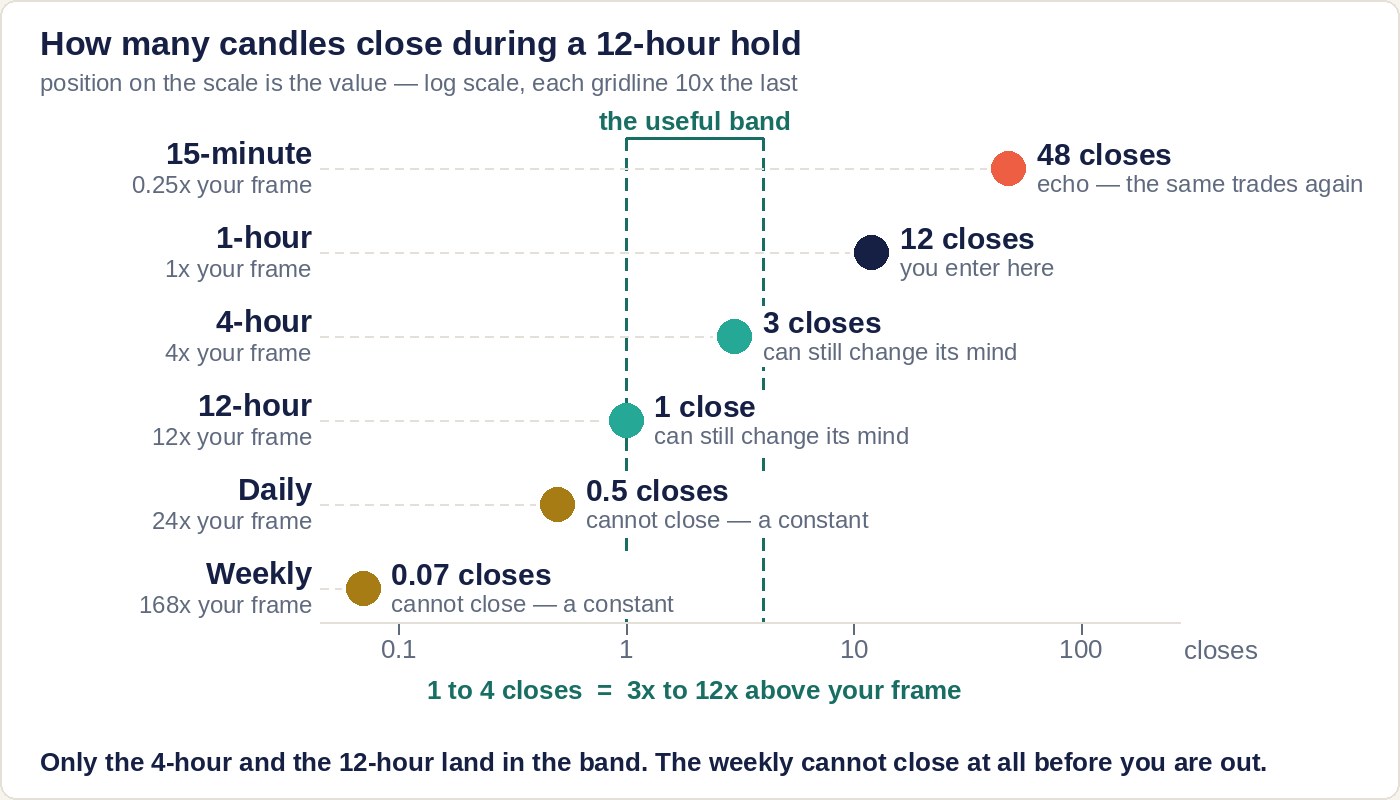
Read the two ends of that chart, because both of them are failures.
Below about 3×, you have asked the same question twice. The 30-minute chart next to the 15-minute chart will agree with you nearly always, because it is built from the same recent trades. That is not a second opinion, it is an echo — and an echo is dangerous precisely because it feels like agreement. Two frames that close together will confirm your bad ideas as reliably as your good ones.
Above about 12×, the frame is frozen. The weekly candle closes 0.07 times during a twelve-hour hold, which is a decimal way of saying it does not close at all. Whatever it said when you opened the trade, it will still be saying when you close it. It cannot warn you, it cannot change, it cannot be wrong in time to help. It is a constant that you have mistaken for a signal, and constants feel wonderfully reassuring because they never contradict you.
You may have seen a rule of thumb quoted as “three to seven times”. The band derived here comes out a little wider, and the reason for the difference is worth more than either number: the correct ratio is measured against your holding period, not against a fixed pair of charts. A scalper who is flat inside ninety minutes should be checking the 1-hour, and the daily is a constant to them. Someone holding four days should be checking the weekly, and for them the 4-hour is the echo. The advice “use the 1-hour, 4-hour and daily” is not wrong so much as it is somebody else's holding period, printed as if it were a law.
If you came here through Lesson 11 you met a different arrangement — three charts, roughly 4× to 6× apart — and the two are not in conflict, because they answer different questions. Lesson 11 spaces charts by what they cost you: fees, screen time, attention. This lesson spaces two charts by one test only, whether the upper one can change its mind while you are still holding. Use Lesson 11 to decide which charts are worth having open at all; use the test here to decide which of them gets a vote on the trade in front of you.
What does borrowing a stop from a higher frame cost?
About four fifths of the trade, if the frame you borrow from is the daily. This is the part of multi-timeframe analysis that nobody warns beginners about, and it is the reason a technique that is supposed to improve your trading so often makes it worse.
Start with how price ranges scale. Over a period n times as long, the typical range is roughly √n times as wide — not n times. This is the standard square-root-of-time approximation, and it has an honest caveat we come back to later, but it is close enough to reason with:
| Entering on 1-hour, stop taken from… | Times longer (n) | Stop is this much wider (√n) |
|---|---|---|
| 4-hour | 4 | 2.00× |
| 12-hour | 12 | 3.46× |
| Daily | 24 | 4.90× |
| Weekly | 168 | 12.96× |
Now price it, with a $10,000 account risking a fixed 1% — $100 — per trade. This is a worked model, not a historical record; every number in it can be reproduced in a spreadsheet.
Everything on the 1-hour. Your stop sits behind 1-hour structure, 0.50% away. Risking $100 across a 0.50% stop means a position of $100 ÷ 0.005 = $20,000. Your target, also from 1-hour structure, is 1.00% away. If it hits: $20,000 × 1.00% = $200, which is 2.00R.
Same entry, stop borrowed from the daily. You looked at the daily, felt reassured, and put the stop behind daily structure instead — 0.50% × 4.90 = 2.45% away. Same $100 of risk now buys a position of $100 ÷ 0.0245 = $4,082. Your target has not moved; it is still the 1-hour objective 1.00% away. If it hits: $4,082 × 1.00% = $40.82, which is 0.41R.
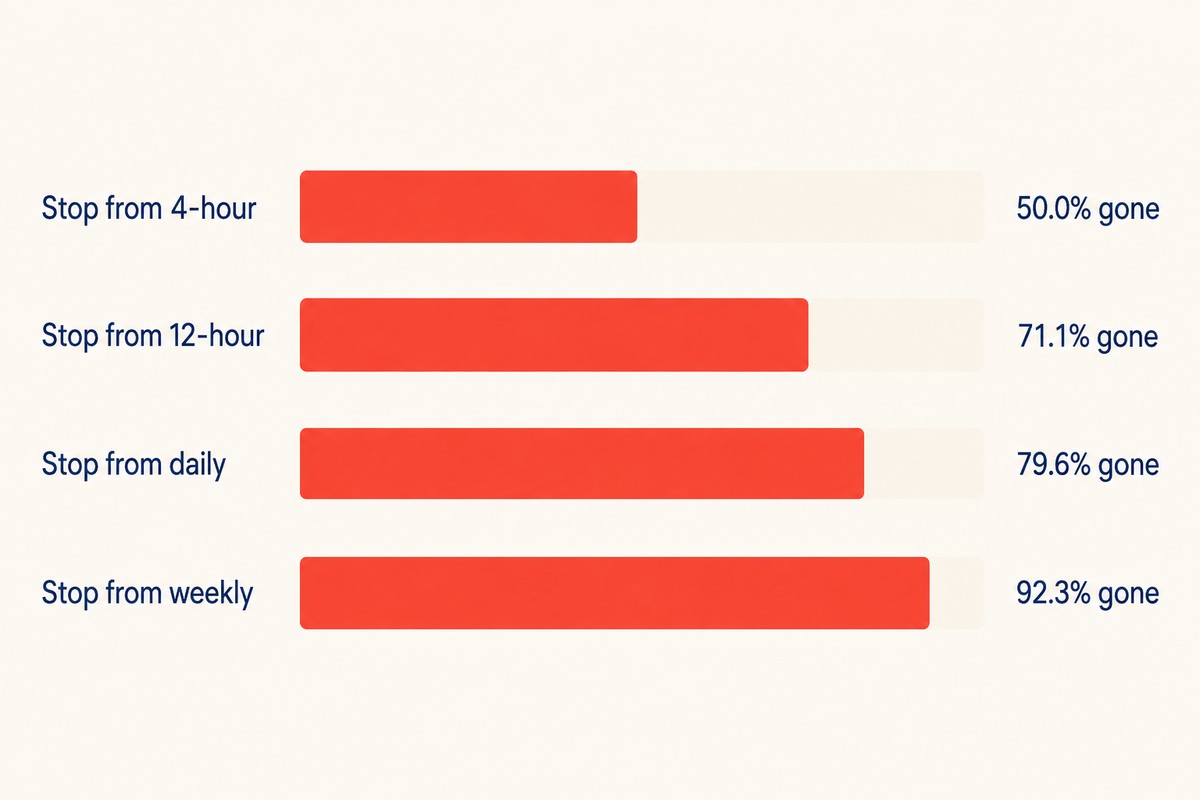
Same entry. Same view. Same 1% of the account at risk. Same target reached. A 2.00R trade became a 0.41R trade — 79.6% of the reward gone — and the only thing that changed was which chart you were looking at when you chose the stop.
The general result is cleaner than the example, and worth memorising: the share of your reward-to-risk destroyed is exactly 1 − 1/√n. It does not depend on your account size, your entry price, or how wide the original stop was — those all cancel. Borrow one frame up (4×) and you lose exactly half. Borrow from the daily and you lose 79.6%. Borrow from the weekly and you lose 92.3%.
And now the part that changes what you do about it. None of this says the daily is a worse frame. Take the target from the daily as well — 1.00% × 4.90 = 4.90% — and the $4,082 position pays $4,082 × 4.90% = $200. That is 2.00R again, to the cent, identical to the 1-hour version. The daily is exactly as good a frame as the hourly.
So the loss was never about frame quality. The entire 79.6% came from borrowing the stop from the slower frame while the target stayed on the faster one. That is the mix to avoid. The reverse mix — stop from your own frame's swing, target from the larger frame's wave — is the course's entry, and it widens the reward rather than the risk.
Does the square-root rule hold on a real chart?
Roughly, and in one direction only: on Bitcoin the real penalty came out worse than the model in every frame we checked. We measured it rather than assert it, and the conditions are stated so you can repeat the measurement on your own instrument. Data: Binance spot BTCUSDT, closed candles only, 22 Sep 2025 to 22 Sep 2026 UTC — 8,760 hourly bars, 2,190 4-hour, 730 12-hour, 365 daily, 52 weekly. Range of one candle = (high − low) ÷ close. The ratio for each frame is its median candle range divided by the hourly's median, because ranges have a long right tail and one news candle should not set the number.
| Frame | √n says | Measured (median range ÷ hourly) | Reward gone, model | Reward gone, measured |
|---|---|---|---|---|
| 4-hour | 2.00× | 2.16× | 50.0% | 53.7% |
| 12-hour | 3.46× | 4.06× | 71.1% | 75.4% |
| Daily | 4.90× | 6.17× | 79.6% | 83.8% |
| Weekly | 12.96× | 16.25× | 92.3% | 93.8% |
Two things in that table are worth more than the numbers. First, every measured ratio sits above √n, by 8% at the 4-hour and 26% at the daily. The reason is not exotic. An hourly candle's median is a quiet hour: the median hourly range in the 10:00 UTC hour was 0.39%, and in the 14:00 UTC hour — around the US open — it was 0.93%, 2.4 times as much. A daily candle always contains the busy hours; the hourly bar you took your stop from very often does not. So the √n table is the flattering version of the cost, and the stop you borrow from the daily is in practice about six hourly stops wide, not five.
Second, the ratio moved very little with the market's mood. Cut the year into twelve 30-day blocks and the daily-to-hourly ratio ran from 5.48× to 6.52× — a reward loss of 81.8% to 84.7% — through months that fell 25%, months that rose 18% and months that went nowhere. Twelve blocks is too few to prove anything about trend versus chop (the correlation between a block's net move and its ratio was 0.13, which on twelve points is indistinguishable from zero), but it is enough to say what the number did not do: it did not swing with the market. Over this year the deviation from √n looked structural, which is what the quiet-hour explanation predicts. Measure it once on your instrument and re-check it occasionally, rather than re-estimating it every time the market changes character.
What the measurement does not change is the conclusion of the section above. Take the target from the daily as well and the ratio cancels exactly as before, whatever its value: 2.00R in, 2.00R out. The measured 6.17× makes mixing frames more expensive than the model said, and leaves consistency exactly as cheap.
So what is the higher frame actually for?
Three jobs, and only one of them is a price — the target, never the stop.
It grants permission. That is the whole of the direction question: am I allowed to be long here at all, or am I about to buy into a bigger pool of money that is selling? Permission is a yes, a no, or an abstention. It is never a number.
It sets the target. On this site the target comes from the larger frame's wave. If the frame above has its own ceiling 1.2% away, an ambitious 3% target on your frame is not ambitious, it is uninformed — something large is parked in the way; if the frame above is running a clean wave, that wave's objective is what you aim at. This is the one price the higher frame is allowed to give you.
It sets your size band. Agreement means full size. Abstention means your normal size or nothing, depending on whether your own frame gives you a range to work. Disagreement means half or none.
Everything else — the entry, the stop, the trail — comes from the frame you are trading. If you find yourself reading a stop off the higher chart and typing it into an order ticket, you have crossed the line, and the arithmetic above tells you what it costs.
What happens when the two frames are running together?
Then the smaller frame is in charge, which is the opposite of what almost everyone assumes. This is the least-known idea in this lesson and the one most likely to save you a giveback.
At the start of any move, the larger frame and the smaller frame go up together. There is no pullback, because a pullback is what happens when the small frame turns while the big one does not — and at the start, neither has turned. During that stretch the two are, for practical purposes, the same chart.
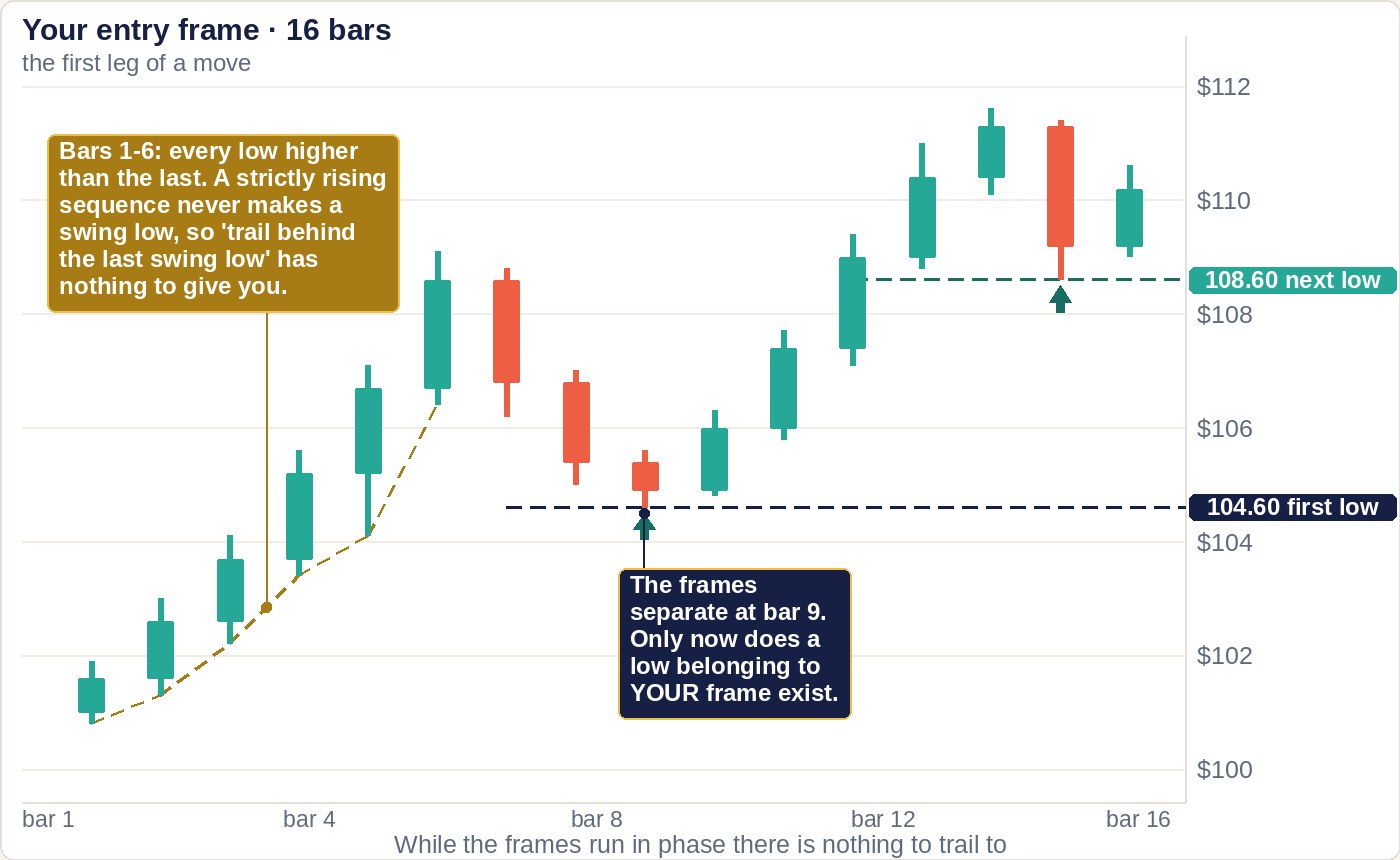
Look at the first six bars. Every low is higher than the one before it, without exception. That is a beautiful piece of price action and it has a consequence nobody mentions: there is no swing low there. A swing low needs a bar with higher lows on both sides, and a strictly rising sequence never produces one.
How long does that stretch actually last? On the same 8,760 BTCUSDT hourly bars, a run of strictly rising lows had a median length of 3 bars, and 31.6% of runs reached 4 or more. Six-bar runs like the one in the chart are the exception rather than the rule — 8.6% of all runs, 181 of 2,094, with the longest at 14 — but because long runs contain many bars, 14.7% of all hourly bars sat inside a run of six or more. Roughly one hour in seven, then, you are inside a stretch that will run six bars or more before the trailing rule has anything to say — and you cannot know in advance which stretch that is. That is a minority of the time and the majority of your best trades, because those are the stretches with the most open profit in them.
Which means the standard advice — “trail your stop behind the last swing low on your frame” — silently does nothing for the entire first leg of the move. Not “it is a bit slow”. It has no level to give you. And that first leg is precisely where you have the most open profit and the least protection. Most traders never notice, because the rule doesn't fail loudly; it just never fires.
You have two honest options while the frames are in phase, and one dishonest one. The honest ones: keep your original stop and accept that you have no trail yet, or drop one frame down and trail behind the smaller frame's structure — because that is the frame actually holding the move up, and if it gives way it will take both of yours with it. The dishonest option is to reach up and trail behind the larger frame's structure, which by the √n rule sits about twice as far away, so you hand back roughly twice as much on the way out.
The frames finally separate at bar 9, when price falls to 104.6 while the larger up-move stays intact. Only there does a low belonging to your frame come into existence. Bar 15 gives you a second one at 108.6, higher than the first, and from that point you have a real structure to manage the trade by. Everything before that was you managing a position with a rule that had nothing to say.
Does demanding more agreement make you better?
For the entry decision, the neighbouring pair is enough — the frame you trade and the one above it. Demanding that every frame agree before every trade multiplies your waiting time, and the cost is invisible because it shows up as trades you never took. When W1, D1, 4h and 1h do all line up the same way, that is resonance, the strongest wave the method knows — worth full size when it arrives, not worth waiting for every time. The main trend is the weekly with the 4- to 6-day frames (D4–D6) agreeing; a daily move against it is a correction, so do not trade against the main trend when D4–D6 side with it, or once the counter-move’s RSI has reached the usual end zone of a correction (about 40–45 in an up trend, 55–60 in a down trend).
Suppose each frame is clearly directional some fraction p of the time, and pretend for a moment that the frames are independent of each other. Then k frames agree only pk of the time. At p = 0.5:
| Frames you require to agree | Share of the time they do | You wait, on average |
|---|---|---|
| 2 | 25% | 4 periods per setup |
| 3 | 12.5% | 8 periods per setup |
| 4 | 6.25% | 16 periods per setup |
Say plainly what that table is and is not. Frames are not independent — a daily uptrend makes a 4-hour uptrend far more likely than a coin flip — so in a real market, alignment happens considerably more often than these figures suggest. Treat this as the worst case, a floor, not a forecast. What survives the caveat is the shape: each extra frame you demand multiplies your waiting time rather than adding to it.
And here is why the fourth frame is usually the worst deal on the list. By the time you have checked your own frame and one frame up, the next chart you reach for is very often less than 3× away from one you already looked at. That is the echo problem again, wearing a different hat: you pay the full price in missed trades and receive no new information at all. You have counted one opinion twice and cut your setup count in half for the privilege.
The practical rule that falls out of this: read every frame for its state, but let the trade be decided by your frame and the one directly above it. Add a second frame up to the decision only if you are willing to hold long enough for it to close. If you are flat before it prints a candle, you did not consult it — you decorated with it.
How do you run the check, in order?
In this order, before the first trade, because the answer to step 1 changes what every later step means.
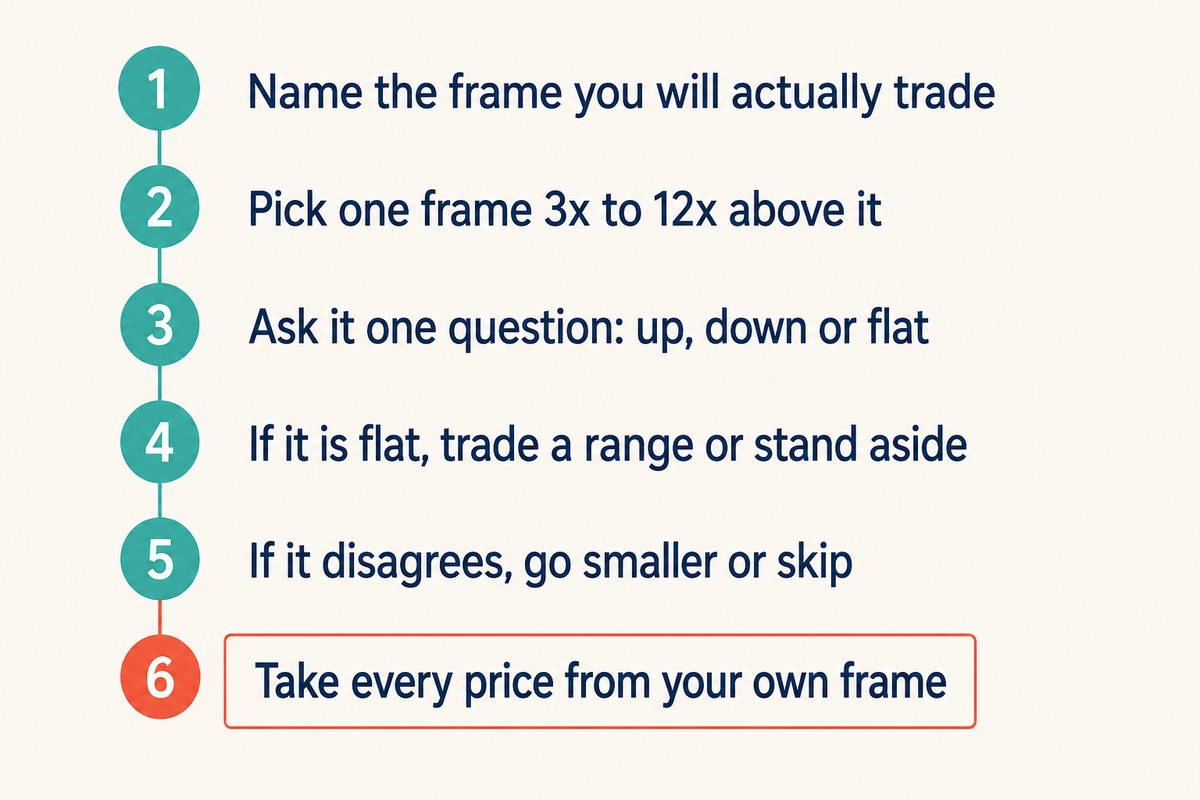
Step 4 is the one that costs people months. A flat higher frame is not a red light and it is not a green light — and traders who treat it as red sit out for weeks waiting for a permission slip that abstention is never going to give them. The right response to a flat frame is to switch playbooks, not to switch off: run the range method from Lesson 20 on your own frame, at your own size, expecting the capped reward a range gives you.
Step 6 is the one that costs people money. It is marked as a warning on purpose. Everything above it is analysis, and analysis that is a bit wrong costs you a bit. Step 6 is arithmetic, and getting it wrong costs you 79.6% of a trade you had already analysed correctly. If you take one habit from this lesson, take this one: after you have written entry, stop and target, look at the three numbers and ask which chart each of them came off. Entry and stop must come off the frame you entered on; the target may come off the frame above; the stop never may.
One more thing the frame does that an indicator cannot: it brings different data. A moving average and RSI computed on your own chart are two summaries of one series of closes — at matching lengths they are provably the same condition — whereas a higher frame is built from different candles altogether. Lesson 23 measures how much that matters, and prices what demanding all three costs you in entry price and in waiting.
What if both frames have a setup, pointing opposite ways?
On this site the answer is to wait. Two neighbouring frames out of phase — the 1-hour up while the 4-hour is still down — is the signature of a market going sideways, and the entry rule needs the larger frame trending and the smaller frame tightening in the same direction. So let the larger frame finish its correction and line up before you take the smaller frame's cross — and take it only once the EMA 9 has crossed the WMA 45 the same way, not on RSI alone. If you are already in a position when the frames split, you cannot wait, and then the useful move is to name the price at which the market will settle the argument for you.
Notice first that the disagreement is information in its own right. While a market is genuinely trending, neighbouring frames do not fight — they run together, which is the whole subject of the section above. So two frames pointing opposite ways is a reading about the market rather than a fault in your charts: it usually means you are in a range, and it turns up most often between frames that sit close together — the same frames this lesson has been calling echoes. An echo that contradicts you has stopped being an echo.
Three steps for that case, and not one of them requires you to know who wins:
- Manage on the frame whose setup formed most recently. If the frame above turned two days ago and yours turned an hour ago, the older move has already been paid for — the same staleness test as the one further down this page. The newer one is the move still being funded.
- Take the target from that same frame’s own structure — the nearest level visible on the chart you entered on. Call it point A. This is not a new rule; it is the rule this whole lesson is built on, which is that prices come from the frame you traded.
- Let A settle it. If price reaches A and carries through with the structure that brought it there still intact, your frame was the one pulling and you manage the trade normally. If price reaches A, stalls, and that structure then breaks, the other frame was in charge all along — and A is where you found out, cheaply.
Set that against step 5 on its own. “If it disagrees, go smaller or skip” leaves you with no trade and no information, still waiting for a disagreement to resolve itself somewhere you are not looking. This version gives you a position sized for the doubt and a fixed price at which the doubt gets settled. The honest cost: it only works if you are actually watching when price reaches A. If you cannot be, the smaller version of step 5 is the right answer and you should take it without regret — a plan you will not be present to execute is not a plan.
When is this advice wrong?
Four situations, and they matter more than the six steps do.
When you treat √n as a law rather than a model. The square-root rule assumes each period's move is independent of the last and that every hour is the same size. Neither is true, and on Bitcoin both errors pointed the same way: the daily was 6.17× the hourly, not 4.90×, so the borrowed-stop penalty is larger than the model says. The earlier draft of this lesson guessed the gap would open in trends and close in chop; the twelve 30-day blocks say otherwise — the ratio stayed at roughly 5.5× to 6.5× whether the month fell 25% or went nowhere. What is robust is the direction and the rough size of the effect, not the figure 79.6%, and the ratio on your instrument is yours to measure: median candle range of each frame over the last few hundred bars, divide, and use what you find.
When you are trading a range. At a range edge the higher frame is flat almost by definition — that is what makes it a range. A rule that says “wait for the higher frame to agree” will keep you out of every single range trade you should be taking. Inside a range, the higher frame's abstention is the setup, not an objection to it.
When the higher frame's move has already been paid for. Permission granted by a candle that moved on an announcement three days ago is stale. The pool of money that pushed it has been filled and has no further reason to push. A higher frame confirms nothing if the reason it is pointing that way has finished happening.
When your hold is shorter than one candle of your entry frame. If you are routinely in and out inside a single 1-hour bar, the 1-hour is not your entry frame — it is your higher frame, and everything in this lesson shifts down a notch. Set the ratios against how long you actually hold, not against which chart you happen to have open.
There is a second way the frames can disagree, and it has nothing to do with the market. A candle is a bucket, and where the bucket starts is a convention of your chart. Lesson 27 counts the consequence: a window of n candles survives an aggregation of k:1 intact only (k − n + 1) ÷ k of the time, so half of all three-candle patterns on the hourly are cut in two by a 4-hour boundary and a five-candle pattern can never fit inside one 4-hour candle at all. When the higher frame fails to confirm a short pattern, geometry may have decided that before the market did.
What are the most common mistakes here?
| Mistake | Why it fails | Do this instead |
|---|---|---|
| Stop from the daily, target from the hourly | Costs 1 − 1/√n by the model — 79.6% here, 83.8% measured on BTC — with no change of view | Entry and stop off your frame; only the target may come from the frame above |
| Reading a sideways higher frame as bearish | Flat is an abstention, not a vote; you sit out valid setups for weeks | Switch to the range playbook at your own size |
| Demanding four or five frames agree before every trade | Frames under 3× apart are the same opinion counted twice, and the waiting multiplies | Read W1, D1, 4h, 1h for their state; decide the trade on your frame and the one above |
| Using the weekly to confirm an intraday trade | 0.07 closes per hold — it cannot change while you are in, so it is a constant | Pick a frame that will close while you hold |
| “Trail behind the last swing low” during the first leg | A strictly rising sequence has no swing low; the rule silently never fires | Trail on the frame below, or keep the original stop |
| Trailing on the larger frame when frames are in phase | Its structure sits about √n further away, so you give back that much more | The smaller frame is in charge while they run together |
| Adding frames after a losing streak | Multiplies waiting time; the missed trades never show up in the journal | Fix the sizing, not the number of charts |
| Copying “1-hour, 4-hour, daily” from an article as the pair that decides the trade | That is somebody else's holding period presented as a law | Read all four frames for state; set the deciding ratio against how long you hold |
Six of those eight are the same error in different clothes: treating a timeframe as a source of authority rather than as a source of information with a known refresh rate. A chart cannot help you if it will not update before your trade is over.
What else do people ask about multi-timeframe analysis?
Which three timeframes should I actually use?
For reading the state, four: W1, D1, 4h and 1h, in that order, each labelled up, down or sideways. For deciding the trade, two — the frame you enter on and the one directly above it — and which two depends on how long you hold rather than on which pairs are popular. Take your typical holding period, and pick a confirming frame whose candles will close somewhere between once and four times during it — that lands 3× to 12× above your entry frame. If you hold trades for around twelve hours, that is the 4-hour or the 12-hour. If you are flat within ninety minutes, it is the 1-hour, and the daily is decoration. A third frame is worth adding only when it is at least 3× from both of the others, otherwise you have counted one opinion twice.
What if the higher frame is sideways?
Then you have permission but no help, and that is a perfectly tradeable state — just a different one. A flat frame contributes neither buying nor selling, so it hands the decision to whichever frame is directional, which is yours. Trade your own frame's structure at your normal size, expect the capped reward that a range gives you, and do not go looking for trend-sized targets that nothing above you is going to fund. What you should not do is read flat as bearish and stand aside, which is how people end up sitting out entire months waiting for a permission slip that an abstention will never issue.
Should I confirm on the higher frame and then enter on a lower one?
Yes, and this is exactly where the expensive mistake hides, so be precise about which chart each number comes from. Confirming above and entering below is sound: it is the standard way to get a tighter stop without losing the direction. The failure is entering on the lower frame and then leaving the stop on the higher one — that costs 1 − 1/√n of your reward-to-risk, which is 79.6% when the two frames are the 1-hour and the daily. Once you drop down to enter, the entry, the stop and the trail drop down with you; the target is the one number that may stay on the frame above, because a wider target widens the reward, not the risk.
Does this work the same in crypto, which never closes?
The logic does; the candle boundaries need one extra check. In markets with a session, the daily close is a real event where positions are settled and decisions are forced. Crypto has no such moment, so a “daily candle” is a convention your charting tool applies — commonly midnight UTC, though the boundary moves if your chart's timezone setting does, which means two traders can look at the same asset and see genuinely different daily candles. As of August 2026 the practical advice is: check what your chart is set to, keep it fixed, and lean on the 4-hour and 12-hour for confirmation, since they are far less sensitive to where the day is deemed to start.
Where does this sit in the course?
Lesson 21 follows Lesson 20 on trend versus range and takes its “look one frame up” step, which was one line there, and turns it into a method with arithmetic behind it. It leans on Lesson 11 on timeframes for what a candle actually represents and on Lesson 12 for how structure is read on any one frame. Next comes Lesson 22 on momentum inertia, which looks at how one school reads RSI extremes as fuel rather than exhaustion — a reading that only makes sense once you can say which frame the extreme belongs to.
Keep the whole course next to your charts
The whole slide course — ten free PDF parts, 351 pages, taught on real charts.