Scaling in and scaling out — entering in tranches instead of all at once
The usual case for scaling in is “you get a better average price,” which is true and almost beside the point. Below the slogan there is a piece of arithmetic that decides everything and that very few articles state: every rung of a downward ladder sits above your stop. So every losing trade fills the whole ladder, while winning trades fill part of it — and the rung with the best risk-to-reward ratio is the one you own least often. This lesson puts numbers on that, then does the same for scaling out, and ends with the four shapes of one trade laid side by side.
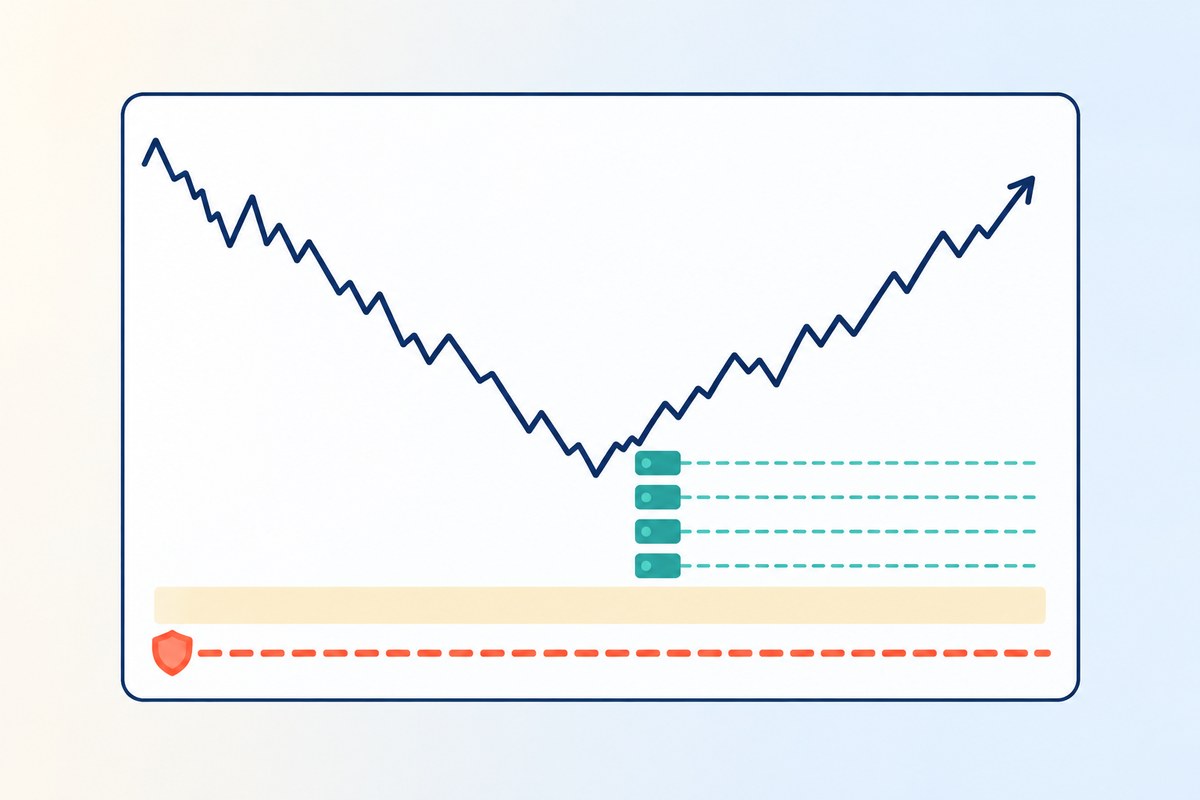
A schematic, not a measurement. The one thing it is drawn to show is the arrangement: four resting orders stacked above a single stop that covers all of them. Every measured figure in this lesson is in the charts and tables below.
KEY TAKEAWAYS
- A ladder risks exactly what one order at the average price risks. Five orders from 63,000 to 61,000 average 62,000; with the stop at 59,000 the whole ladder is a single 62,000 position as far as risk is concerned. Scaling in moves the price you pay, not the money at stake.
- Every loser is full size; only winners are partial. All the rungs sit above the stop, so any path that reaches the stop has filled all of them. Against a directionless benchmark, average size held on a winning trade is 67.53% of plan. On a losing trade: 100%, always.
- The best rung is the one you own least. Order 1 has the worst ratio in the ladder, 1.75, and is filled on 100% of winners. Order 5 has the best, 4.50, and is filled on 38.89% of them — measured, like every share on this page, against a directionless benchmark.
- Size the ladder once, not five times. Sizing each rung as its own 1% trade produces 5.00× the intended risk and 5.31× the intended position — and it buys most heavily in the direction price is moving against you.
- Four shapes, one expectancy. All-in, ladder down, ladder up and half-out-at-+1R all return 0.00R against a directionless benchmark. Scaling in widens the spread of results (+7.50% and +19.52%); scaling out narrows it (−20.94%) and lifts the chance of a green result from 36.36% to 50.00%. Measured instead from the moment price reaches +1R, banking half narrows the spread by 64.6% and takes the chance of green from 72.73% to 100%.
What does scaling in actually mean?
It means filling one position — whose total size was fixed before the first order went in — with several smaller orders at several prices, instead of one order at one price. The course this site teaches from gives 20/20/20/20/20 as its worked example, five equal fifths; the chart on the same slide uses 30/30/40. That inconsistency is informative rather than sloppy. The split is not the rule. The rule is that you decide how many rungs there are before you place the first one, so the thing never grows a sixth rung while you are watching it.
Scaling out is the same idea running backwards: leaving the position in pieces rather than in one order.
Everything in this lesson assumes the previous three are settled. The stop is already placed on something on the chart (Lesson 43), the ratio is already acceptable (Lesson 41), and the size is already the output of dividing your risk budget by the stop distance (Lesson 42). Scaling is what you do after all three, and it must not quietly undo any of them.
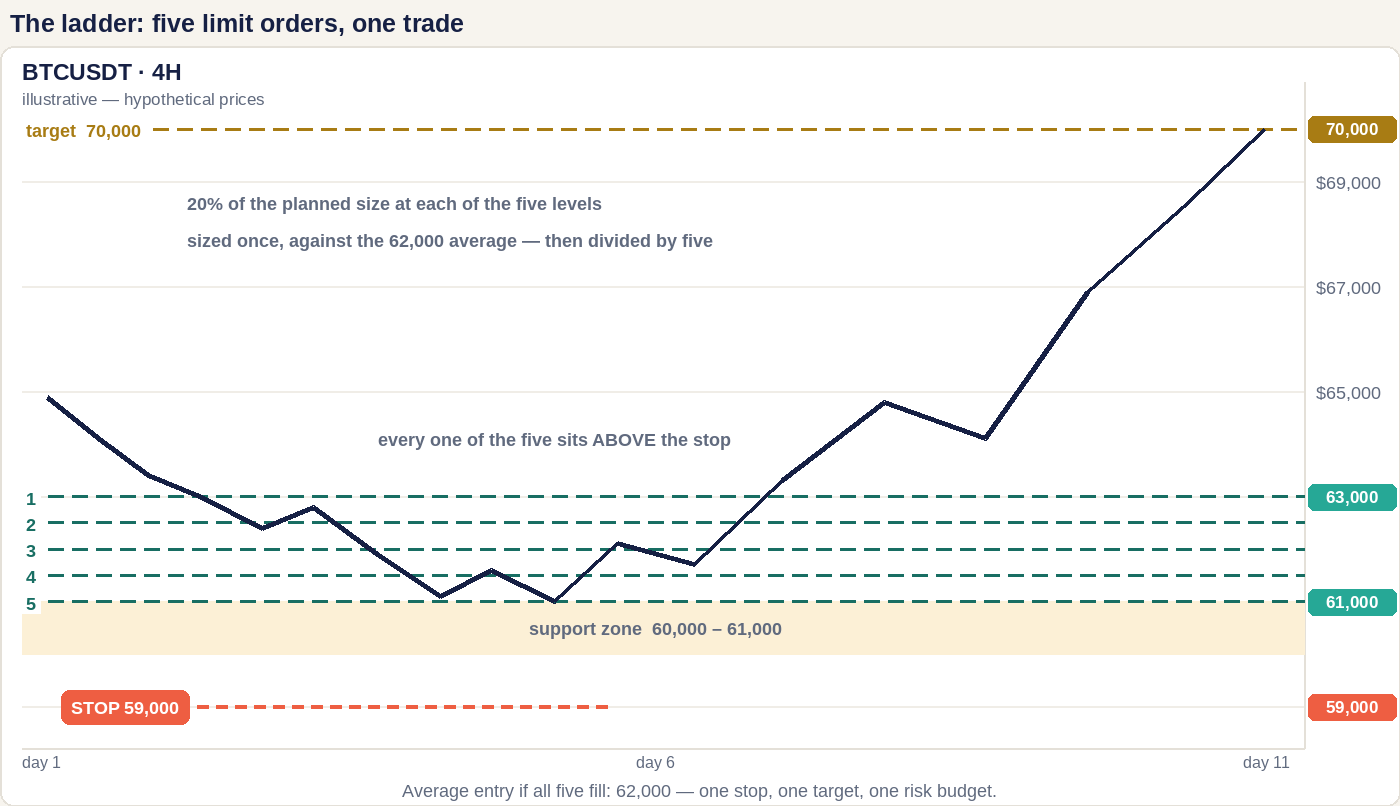
The worked case runs through the whole lesson. Long BTC into a support zone at 60,000–61,000, stop at 59,000, target at the prior swing high of 70,000, five orders at 63,000 / 62,500 / 62,000 / 61,500 / 61,000, 20% of the planned size at each. Account $10,000, risk 1% = $100 (Lesson 40). Illustrative prices, not a recommendation.
Does splitting the entry reduce your risk?
No, and the proof is one line. The risk of a ladder is the sum over the rungs of size times stop distance, Σ qi(Ei − S). Because the weights add to one, that sum collapses to Q(Ê − S), where Ê is the weighted average entry. In other words:
A ladder carries exactly the risk of a single position of the same total size, taken at the average price. Five orders averaging 62,000 with a stop at 59,000 are, for risk purposes, one 62,000 position. The ladder moves Ê. It does nothing to risk by itself.
This is why the course insists on one figure covering the whole thing: whether you scale in or out, you still fix a single total risk number for all the tranches together. That is not a discipline tip. It is the consequence of the identity above — there is only one risk number in the arithmetic, so if you do not decide it, the market decides it for you.
Here is what happens when you do not. Suppose each rung gets sized like a normal trade: $100 of risk at its own stop distance.
| Order | Price | Stop distance | Size at “$100 risk” | Risk actually added |
|---|---|---|---|---|
| 1 | 63,000 | 4,000 | 0.025000 BTC | $100 |
| 2 | 62,500 | 3,500 | 0.028571 BTC | $100 |
| 3 | 62,000 | 3,000 | 0.033333 BTC | $100 |
| 4 | 61,500 | 2,500 | 0.040000 BTC | $100 |
| 5 | 61,000 | 2,000 | 0.050000 BTC | $100 |
| Total | 0.176905 BTC | $500 | ||
| Sized once, correctly, against the 62,000 average | 0.033333 BTC | $100 | ||
5.00× the risk and 5.31× the position. Notice the shape of the error as well as the size of it: the deeper the rung, the tighter its individual stop distance, so the bigger the order the method tells you to place. It buys hardest exactly where price has moved furthest against you. That is not a caricature of a bad habit — it is what happens automatically to anyone who applies the sizing formula per order instead of per trade.
Done properly, the whole ladder is 0.033333 BTC and each rung is 0.006667 BTC. The sizing calculation happens once, against Ê, before the first order exists.
Which rungs do you actually own?
This is the question the slogan skips, and the answer is where the lesson earns its keep.
Look again at the arrangement: all five rungs sit above the stop. That has an immediate consequence. Any price path that reaches 59,000 must first pass through 61,000, 61,500, 62,000 and 62,500. So:
Every losing trade fills the entire ladder. Only winning trades can be partial.
How partial? To answer that we need a benchmark, and this site uses the same one throughout: a market with no direction, where the chance of reaching a level above before a level below is simply the distance ratio. Lesson 41 used it to show that every risk-to-reward ratio returns exactly zero there. It is not a claim about how markets behave; it is a neutral yardstick, so that anything a technique appears to gain can be checked against a case where nothing is gained.
| Order | Price | Reward per 1 of risk | Filled on winners | Filled on losers |
|---|---|---|---|---|
| 1 | 63,000 | 1.75 — worst | 100.00% | 100% |
| 2 | 62,500 | 2.14 | 81.67% | 100% |
| 3 | 62,000 | 2.67 | 65.63% | 100% |
| 4 | 61,500 | 3.40 | 51.47% | 100% |
| 5 | 61,000 | 4.50 — best | 38.89% | 100% |
Read the two right-hand columns together and the shape of the thing appears. The order with the worst risk-to-reward in the ladder is the one you are guaranteed to own. The order with the best is the one you own on barely a third of your winners. And on every loser, you own all five.
Average size held on a winning trade: 67.53% of plan. On a losing trade: 100%. You are systematically smaller when you are right and always full when you are wrong — which sounds like a fatal flaw and is not, for a reason we come to in a moment.
So what does a ladder change?
Not the expectancy, and not the win rate. Against the directionless benchmark the ladder wins on 36.36% of trades — identical to entering all at once, because winning means reaching 70,000 before 59,000 and that is the same event either way. And the average winner is 1.75R: identical again.
That last one deserves a second look, because it is where the apparent flaw in the previous section resolves itself. You hold less size on winners — but the size you are missing is the cheap size, and when you do get it you get a much better price. The two effects cancel to the last decimal.
| Orders filled on a winning trade | Share of winners | Result |
|---|---|---|
| 1 only | 18.33% | +0.47R |
| 1–2 | 16.04% | +0.97R |
| 1–3 | 14.15% | +1.50R |
| 1–4 | 12.58% | +2.07R |
| all five | 38.89% | +2.67R |
| Average winner | +1.75R — exactly the all-in winner | |
| Median winner | +2.07R | |
So the ladder does not make you money. It redistributes the same money into a wider range: nearly a fifth of your winners hold only the first rung — a fifth of the planned size, paying 0.47R, barely a quarter of what an all-in winner pays — while the most common outcome among winners, at 38.89%, is the full 2.67R. Compared with the flat 1.75R of a single entry, that is more spread, not less.
Which brings up the honest question. If the expectancy is unchanged and the results are more scattered, why does the course teach this at all?
The answer is not on the chart. It is that the size you are exposed to at the worst moment is smaller. When price is jerking around inside the zone and the wicks are going through your levels, a ladder has 20% of the position on, not 100%, and the course is blunt about what that is worth: entering the whole thing at once in a place where price is thrashing means every wick hits your account at full amplitude, and the decisions that come out of that state — cutting winners early, moving the stop, flipping the position — cost far more than the arithmetic being debated here.
Two different things, easy to blur. Exposure while the trade is open is what a ladder reduces. Dispersion of final results is what it increases — by 7.50%, measured below. Both statements are true at the same time, and only the first is a reason to do it.
Where is the line between scaling in and DCA?
The course does not treat these as two species. It says scaling in becomes dollar-cost averaging in some cases, and that when it does, the losses are bigger than they would have been. The interesting question is therefore not “which one am I doing” but “what event turns one into the other,” and that event is checkable:
- A rung appears that was not in the plan. You decided on five. There is now a sixth.
- A rung sits below the stop. An order under 59,000 is not part of this trade; the trade would already be closed.
- The stop moves down to accommodate a rung. Compare the stop price before and after. If it changed, you did not add to a position — you replaced the trade you sized with a bigger one.
None of those requires you to interrogate your own motives in the moment, which is the point. They are three comparisons you can make against what you wrote down beforehand.
There is a second shape of ladder that inverts almost everything above, and the course teaches it too: the ladder that goes up. Roughly 0.3% of the account, then another 0.3%, then the remainder — the whole cluster still stopping out at 1% — where the second slice goes on when price retests a level and holds, and the third goes on when the move is clearly away, at the same time as the stop is lifted to the level that was just tested.
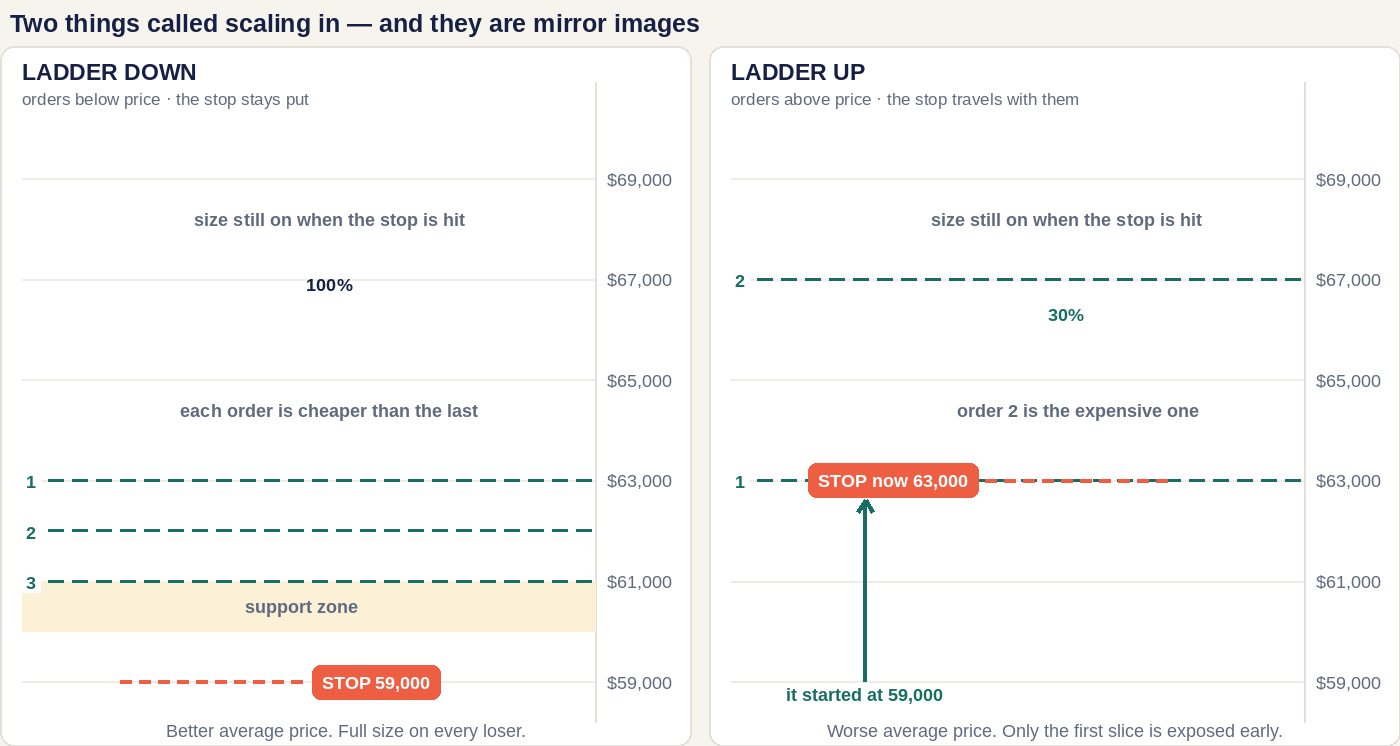
The clean way to hold both in your head: a downward ladder is lightest at the start and heaviest exactly where the stop is; an upward ladder is lightest exactly where the stop is and heaviest near the target. The downward ladder buys a better average price and pays for it by being full size on every loser. The upward ladder buys small early losses and pays for it with a worse average price — and with a worse ratio on every rung it adds, which is worth pricing:
| Adding at 67,000, target still 70,000 | Risk on that tranche | Reward | Ratio |
|---|---|---|---|
| Stop left at 59,000 | 8,000 | 3,000 | 0.375 |
| Stop lifted to break-even, 63,000 | 4,000 | 3,000 | 0.75 |
Both are below 1.00. On its own, neither would pass as a trade. The rule that falls out is worth memorising because it is unambiguous: an added tranche is only ever justified by the stop that moved with it — and even then it is the worst part of the position, so it should be the part you are most reluctant to enlarge.
What does scaling out buy you?
The course’s exit rule is specific: when the smaller timeframe stops driving in your direction, take half off and move the stop on the rest to break-even; if the level then holds, the half can go back on. What does the first part of that cost and earn?
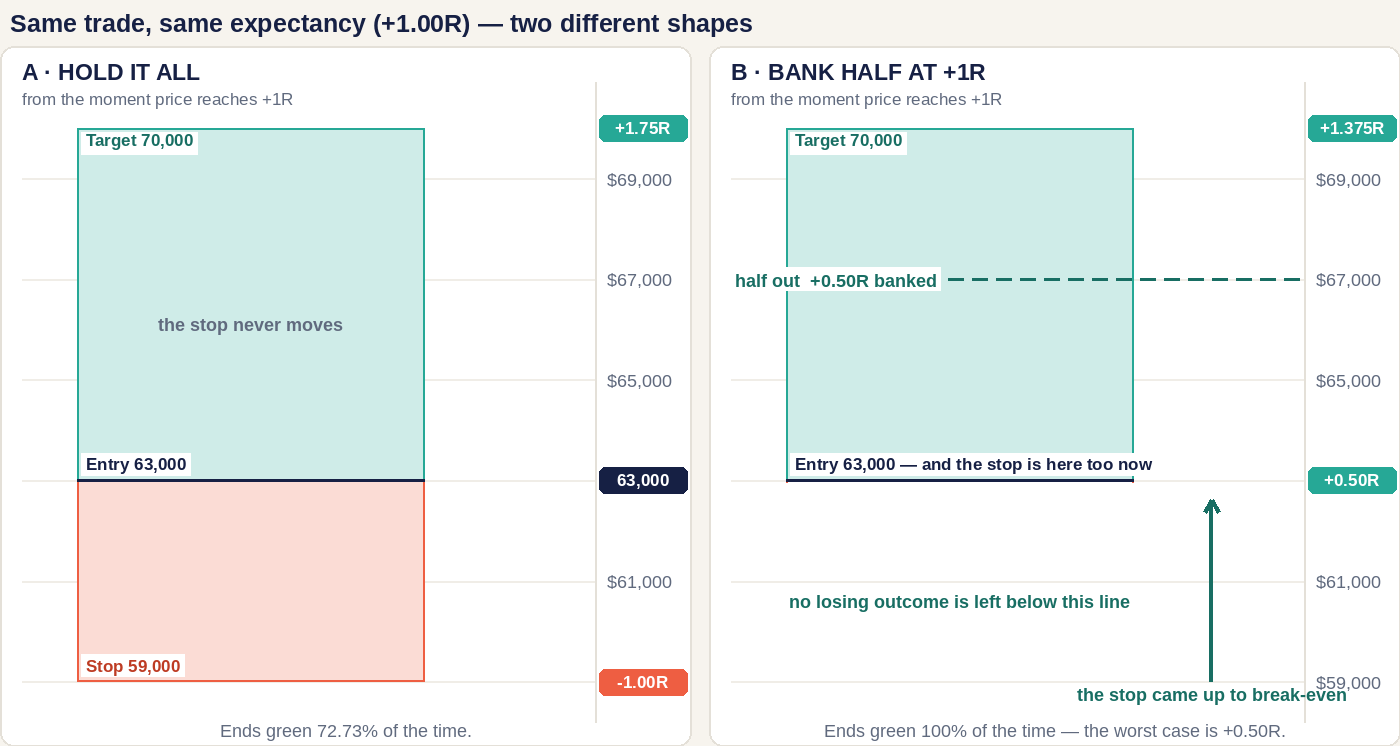
Take the same trade at the moment price reaches +1R, which here is 67,000.
| From the moment price reaches 67,000 | Hold it all | Bank half, stop to break-even |
|---|---|---|
| Worst case | −1.00R | +0.50R |
| Best case | +1.75R | +1.375R |
| Chance the trade finishes green | 72.73% | 100% |
| Spread of outcomes (standard deviation) | 1.22R | 0.43R (−64.6%) |
| Expectancy | +1.00R | +1.00R |
Every row moves except the one people argue about. Taking half off does not make the trade worth more or less. It converts a 72.73% chance of +1.75R into a certainty of at least +0.50R, and shrinks the spread of results by nearly two thirds. The cost, on the trades that would have gone all the way, is 0.375R each.
Is that a good deal? There is an exact threshold, and it is one you can measure on your own record. Comparing like with like — both versions keeping the original stop, so we are pricing the half-exit alone — banking half wins whenever more than 3/11 = 27.27% of the trades that reach +1R end up back at the stop. And 3/11 is precisely the rate at which a directionless market does that. Which is the same result as everywhere else in this lesson, stated a third way: at the neutral benchmark it is a coin flip, so whether it pays depends entirely on how your own trades behave once they are up 1R. That is not a rhetorical question. It is a number in your journal.
There is a second thing the half-exit buys, and it does not show up in expectancy at all: it removes the need to be right about a date. The clearest illustration is historical. Measured on the Dow from its 1929 peak to its 1932 low, getting out 20% below the top — a clumsy, early, unimpressive exit — left 7.4 times more capital than holding on did, while costing only 20 cents against a perfect top-call that essentially nobody achieves. That asymmetry is the whole argument for rungs over a single decision, and it is worked through with the numbers in Bernard Baruch: the man who did not sell the top.
Four shapes, one expectancy
Same trade, same 1R maximum loss, same start at 63,000, same stop and target. Four ways of arranging it. The best cases differ because the same 1R buys different amounts of coin: sized against the 62,000 average the ladder holds 0.033333 BTC, while a single entry at 63,000 holds 0.025 BTC — a third less.
| Shape | Expectancy | Finishes green | Worst | Best | Spread |
|---|---|---|---|---|---|
| A All in, one order | 0.00R | 36.36% | −1.00R | +1.75R | 1.3229R |
| B Ladder down, five rungs | 0.00R | 36.36% | −1.00R | +2.67R | 1.4220R +7.50% |
| C Ladder up, stop follows | 0.00R | 28.57% | −1.00R | +2.50R | 1.5811R +19.52% |
| D Bank half at +1R | 0.00R | 50.00% | −1.00R | +1.375R | 1.0458R −20.94% |
Shape C is modelled as two slices rather than the three the course describes, which is why the size left on at the stop reads 50% in this table and 30% in the chart above — the shape of the result is the same either way, and two slices are easier to check by hand.
Three things fall out of that table, and the third is the one to keep.
First, the expectancy column is a column of zeros. No arrangement of orders manufactures an edge. That result belongs to Lesson 41, which established it for the ratio; all this lesson adds is that chopping the entry and the exit into pieces does not escape it either.
Second, scaling in and scaling out are not the same discipline. They are usually taught together, as though “splitting the order” were one habit. Measured, they pull in opposite directions: scaling in makes results more scattered (+7.50% and +19.52%), scaling out makes them tighter (−20.94%). The gap between the widest and narrowest shape is 51.19%, on trades that are all worth exactly the same.
Third, what you are actually shopping for is the “finishes green” column. From 28.57% to 50.00% — nearly double — without gaining a cent of expectancy. And the price of it is visible one column to the right: the best case drops from 2.50R to 1.375R. That is the trade being made, and it is a reasonable one to want. It is only a mistake when someone sells it to you as free.
Practice corner
Open your journal and count only the trades that reached +1R at some point. Of those, what share finished at your original stop? Call it f.
- f > 27.3% — your winners give back more than a directionless market would. A half-exit is buying something real on your record, not just on paper. (The threshold prices the half-exit alone, both versions keeping the original stop — a break-even stop is a second decision on top of it.)
- f < 27.3% — your trades tend to keep going once they are up 1R. Every half-exit is handing back 0.375R for insurance you are not claiming on.
Twenty trades is enough to see which side of the line you are on; it is not enough to be sure. And note what the exercise does not ask: it does not ask whether you feel calmer taking half off. That question matters — it is most of why the technique exists — but it is answered somewhere other than a spreadsheet.
Try it on a live chart. A ladder is five resting limit orders and one stop, which is worth placing once on a chart before you place it with money. On any exchange you can set the five limit orders and the single stop, then leave them: the point of the exercise is watching how many rungs actually fill over a few days, because that number — not the average price — is what this lesson says decides the outcome.
What do people get wrong about this?
- “Scaling in lowers my risk.” It lowers the price you pay on average. Risk is size times stop distance, and the ladder’s risk is identical to one position at the average entry. If the ladder feels safer than a single order of the same total size, that feeling is about exposure over time, not about money at stake.
- Sizing each rung as if it were a whole trade. Five times the risk, 5.31 times the position, and the error grows as price moves against you. The size calculation happens once.
- Treating 20/20/20/20/20 as a law. The course’s own chart uses 30/30/40. What matters is that the number of rungs is fixed before the first one, so the ladder cannot grow while you watch it.
- Adding a rung because the price is “even better now.” If the new rung is below the stop, the trade was already over. If it required moving the stop, you are in a different, larger trade than the one you sized.
- Splitting the order to relieve uncertainty rather than to execute a plan. There is a real distinction here, and the course puts it sharply: a split decided in advance is a technique, while a split invented on the spot because you cannot choose is just indecision with better manners. The tell is whether you can state the number of rungs, the prices and the total risk without looking at the screen.
- Raising the target without scaling any of it out. The course lists this as its own mistake, and it is the one that costs a whole winner at a time: if you have decided the move is bigger than planned, that is precisely the moment to secure part of what has already been earned rather than to convert the entire position into a bet on the extension.
- Bargaining after the structure is gone. If you took half off because the level broke, the rest still has to go, including on the days it does not bounce first.
When is this lesson wrong?
Every measured number above comes from one benchmark: a market with no direction. That is the right yardstick for the question being asked, because it isolates what the arrangement of orders does from what the market does. But it also sets the boundary of the answer.
In a genuinely trending market the neutrality breaks in both directions. A downward ladder into a market that never comes back fills rung 1 and nothing else — you are right about the move and holding a fifth of the position you meant to have. And a break-even stop in a market with real drift cuts you out of exactly the continuation you were being paid for, which is what makes the 0.375R insurance premium expensive rather than fair.
Two further limits worth stating plainly. A ladder is not a default. The course attaches it to specific situations — the end of a larger-timeframe move, a zone with genuine thickness — and says outright that when the relevant swing is small there is nothing to split; you would be dividing a range too narrow to place five meaningful orders inside, and paying five sets of fees to do it. And the whole exercise assumes one trade at a time. Several ladders running at once in correlated coins is a portfolio question, and none of the arithmetic here covers it.
One more assumption is load-bearing enough to name, because the central result rests on it: a resting limit order is taken to fill whenever price touches its level. Real markets gap, and real order queues have a back. A weekend gap straight through the zone, or a level that trades for two seconds while you are twentieth in line, breaks the tidy claim that every loser is full size — you can end up stopped out holding three rungs, which is worse than either version described here.
Where the numbers come from. Every figure in this lesson is derived from one worked case — entry ladder 63,000 to 61,000, stop 59,000, target 70,000 — under a driftless random walk, and checked a second time by simulating 40,000 random price paths in $250 steps. Prices are illustrative. Nothing here is a recommendation to buy or sell anything.
Frequently asked questions
Does scaling into a position reduce your risk?
No. A ladder of orders carries exactly the same risk as one position of the same total size taken at the weighted average price, because the risk of the whole ladder equals total size multiplied by the distance from the average entry to the stop. Five orders at 63,000 down to 61,000 average out at 62,000, and 62,000 with a stop at 59,000 is what the risk is measured from. Splitting the entry moves the average price you pay; it does not move the money at stake. The only thing that reduces risk is a smaller position or a closer stop.
What is the difference between scaling in and DCA?
A stop, and whether it moves. Scaling in means filling a total size that was fixed before the first order, at prices that were all chosen before the first order, all of them above the stop. It becomes dollar-cost averaging the moment you add a rung that was not in the plan, or add one below the stop, or move the stop down so a new rung fits. The test is mechanical rather than emotional: compare the stop price and the planned total size before and after the addition. If either changed to accommodate the new order, it is no longer the trade you sized.
Should I take profit in parts or all at once?
Measured against a market with no direction, both return exactly the same expectancy, so the question is not which one earns more. Taking half off at +1R and moving the stop to break-even turns a trade whose worst case was −1.00R into one whose worst case is +0.50R, raises the share of trades that finish green from 72.73% to 100%, and narrows the spread of outcomes by 64.6% measured from that same moment. It costs 0.375R on every trade that would have run all the way to target — the ceiling falls from 1.75R to 1.375R. You are buying certainty at a price, not buying an edge.
Is it a good idea to add to a winning position?
Only if the stop comes up with it, and even then the new tranche is the worst part of the trade. Adding at 67,000 on an entry of 63,000 with the target still at 70,000 and the stop still at 59,000 gives that tranche 3,000 of reward against 8,000 of risk — a ratio of 0.375, far below anything a system would accept on its own. Moving the stop up to break-even at 63,000 improves the added tranche to 0.75, which is better and still under 1.00. The rule that follows is simple to check: price the added tranche on its own against the stop you are actually using, and if it would not pass as a standalone trade, the only thing justifying it is the stop that moved.
Next: FOMO — the fear of missing out, and what it costs when it is the thing deciding how many rungs your ladder grows.