Revenge trading — why the next trade after a loss is the dangerous one
Most writing on this subject is about your temperament: stay calm, walk away, do not let anger trade for you. It is decent advice and it is unusable at the exact moment it is needed, because by then the order is already half placed. This lesson takes a different route. It treats the moment after a loss as two separate decisions — whether to take a trade, and how big it is — measures what each one costs on its own, and ends with a test you can run tonight on a file you already have. No self-knowledge required.
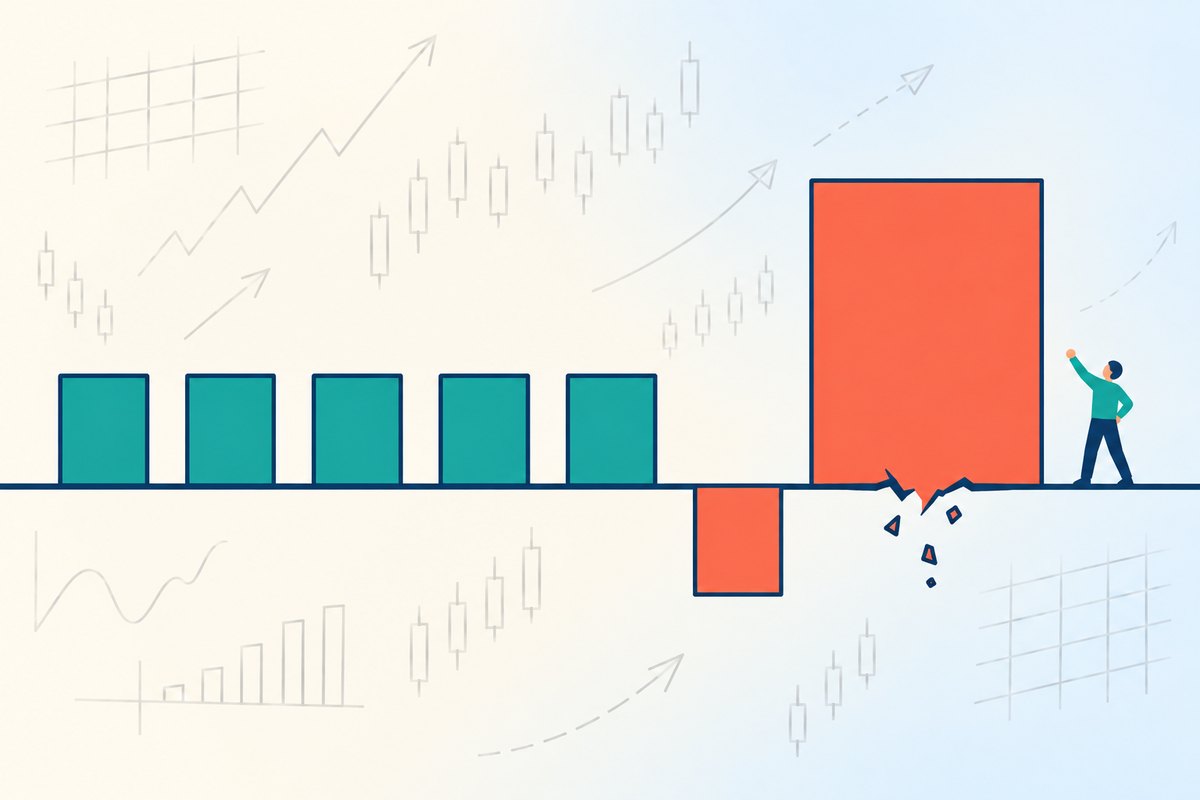
The one thing this picture is drawn to show is the order of events: the block placed straight after the one that dropped below the line is the biggest thing in the frame, and it is the ground under that one that gives way. The exact sizes here are illustration; every number in this lesson is in the charts below, drawn to scale.
KEY TAKEAWAYS
- It is two mistakes, not one. Taking a trade because you need one, and sizing it from the last result. They cost different things and hide in different places.
- The trade choice is where the money goes. Replace the post-loss trade with a fair coin flip — not a bad trade, a zero-expectancy one — and 400 trades end at 1.59x instead of 4.66x. That is 66% gone at an unchanged 1% risk.
- The size is where the account goes. Doubling it costs only 9% more money but takes the chance of a 25% drawdown from 39.6% to 95.6%, and puts one run in two through a 40% fall.
- Moving your size at all has a price. At the same average risk of 1.60%, sizing up after losses gives 1.92x the drawdown risk and 1.2% less money than a flat 1.60% — provable without any simulation.
- You can test yourself tonight. Split your log by what the previous trade did. A clean log shows the two win rates 0.03 of a point apart; a revenge habit opens an 11.4-point gap while leaving the after-a-win group untouched.
- It is not rare. In a system that wins 40%, 60% of all trades sit immediately after a loss — rising to 67.7% once those trades start losing more often.
What actually happens right after a loss?
Two decisions get made, not one, and they are usually made so close together that they feel like a single act. First you decide to take a trade. Then you decide how big it is. The course this site teaches from is blunt about what the pair amounts to: revenge trading is “a habit, not a technique” — filed under anger, alongside the other behaviours that repeat rather than the mistakes you make once. That classification is doing work. You do not fix a habit by resolving to feel differently next time.
It also helps to be exact about how often this window opens, because most people picture it as an occasional bad afternoon. In a system that wins 40% of the time, the share of trades that sit immediately after a loss is simply the loss rate: 60%. A rule that begins “only when I need to get one back” is not an exception you make now and then. It is the rule that governs most of your trading.
There is one more thing worth saying before any arithmetic, because it moves where the problem lives. The teaching notes behind this course describe the sequence as discipline slips → positions creep up → anger arrives → the account goes, and they insist the place to break it is the first link, not the third. The reason is practical rather than moral. A loss that sits inside what you can shrug off does not generate the urge at all. Whether it sits inside that range was decided by the size you chose while you were calm — which is Lesson 40, several trades upstream of the moment that feels like the problem.
Why is raising the size after a loss worse than raising it all the time?
Because the damage does not come from the level of risk. It comes from the risk moving. This is easiest to see if we hold the level completely fixed and change only the placement.
Take a system that wins 40% of the time, pays 2.5R when it wins and loses 1R when it does not (the R notation is Lesson 41; risk is a percentage of the current balance, per Lesson 42). Now run two traders through 20,000 simulated 400-trade runs, and give them the same run of wins and losses — identical draws, identical luck, identical setups. The only difference:
| Risk per trade | Average risk | Win rate | Median result | Chance of a 25% drawdown | |
|---|---|---|---|---|---|
| Steady | 1.60% every trade | 1.60% | 40.00% | 11.05x | 14.0% |
| Reactive | 1% normally, 2% after a loss | 1.60% | 40.00% | 10.91x | 26.8% |
The average risk is the same to two decimal places. That is deliberate — it takes the question of how much off the table entirely, because that question already belongs to Lesson 39. What is left is only where. And where turns out to cost 1.92 times the chance of a 25% drawdown, while returning 1.2% less money.
That result is not a quirk of the random numbers; it can be derived without any simulation at all. Compounded growth per trade is a curved function of the fraction you risk — the gain from doubling your size is always less than double. So splitting one average into a small size and a large one lands you below the curve at the point the average sits on it. The numbers are small and exact: growth per trade of 0.003847 at 1%, 0.007394 at 2%, and 0.006006 at a flat 1.60%; the 60/40 mixture gives 0.005975. Over 400 trades that is 10.92x against 11.05x — which is what the simulation returned, to two decimal places. Any size that swings with your last result pays this, in both directions. The direction only decides what you get in return.
So where does the real damage come from?
From the other decision — the one about whether to take a trade at all. And here we can be as generous to the revenge trade as the arithmetic allows.
Assume it is not a bad trade. Assume it is a perfectly average one: same 2.5R payoff, but a win rate at the break-even point, 1 ÷ (1 + 2.5) = 28.571%, so its expectancy is exactly zero. Not negative. A fair coin flip with fair odds, taken because you needed a trade rather than because a setup arrived. Nothing about it is careless. It simply has no edge.
Read the two charts as one sentence. You lose the money on the trade you should not have taken. You lose the account on the size. On a $10,000 balance the medians are $46,587 for the trader who changed nothing, $15,868 once the post-loss trade becomes a coin flip, and $14,462 once it is also doubled — but the last step, worth $1,406 in the median, is the one that takes almost every run through a 25% drawdown and half of them through 40%.
These are medians of a model with the assumptions stated above, not a forecast and not a return you should expect. The point of the numbers is the ratio between the three rows, which is what the model can actually defend.
Two consequences follow that are worth more than the figures themselves.
The size is the part you can survive being wrong about. An oversized trade with a real edge behind it is an argument about risk appetite — a bad argument, but an argument. An oversized trade with no edge behind it is not a trade-off at all: you are paying the full drawdown price and buying nothing with it.
And the damage lands late. The extra risk is not the whole story on its own; what it does is leave you making the next decisions from a smaller balance and a worse mood, which is what the notes behind the course mean when they say the cost of one heavy-handed trade is not that trade — it is that it breaks the machine that makes the following ones.
Does it even need a loss?
No, and this is the version almost nobody watches for. The same teaching notes list a separate failure that arrives with no realised loss anywhere: you miss a move, it runs without you, and the trade you then take is against it. Nothing hit a stop. The account is untouched. And yet every ingredient is present — the goal has switched from following a process to settling a score, and the position is being entered because of what already happened rather than because of what is on the chart.
It is worth separating this from Lesson 45, which is the same frustration pointing the other way. FOMO chases the move; this one bets against it. They come from the same source and produce opposite tickets, which is why “stay disciplined” covers neither of them usefully. A written filter does: if this entry is on the opposite side of a move I just missed, it is not a setup until it has a level, a stop and a reason that would have existed anyway.
How do I know whether I am doing it?
Not by asking how you felt — that question cannot be answered honestly in the middle of a session, and it cannot be audited afterwards. There is a better one, and it runs on data you already have.
Split your trade log into two groups: trades taken after a win, and trades taken after a loss. Compare the win rate of each. That is the entire test.
Why it works, and where it stops working, are both worth stating plainly.
It works because a revenge trade is defined by what you take, and a trade with no edge wins at the break-even rate rather than at your system's rate. So the after-a-loss group sinks towards break-even while the after-a-win group stays exactly where it was. That second half is the useful half: a gap with an unchanged after-a-win group means your system is fine. If the strategy had genuinely stopped working, both groups would have fallen together. The two diagnoses feel identical from the inside and have opposite remedies, and this filter is the cheapest way we know to tell them apart.
It stops working on the other mistake. Look back at the table in the previous section: the trader who only changed the size has a win rate identical to the disciplined trader's, to within 0.03 of a point. Nothing about the sizing reflex shows up in any statistic a trader normally reviews — not the win rate, not the average R, not the setup quality. For that one you have to look at the size column itself, and our glossary entry on revenge trading lays out the order-form tells in detail.
So the pair of tests is: win rate split by previous result catches the trade you should not have taken; size compared with the size you wrote down catches the other one. Neither asks you to be honest about your feelings, which is the point — both are things a spreadsheet can decide.
Run the split on your own log this week. Everything above depends on having the previous trade's result stored next to each entry, which most exports give you and most people never sort by. Export your fills from wherever you trade, add one column for what the previous trade did, and take the two averages — the whole exercise is one sort and one formula.
That blindness is not unique to position sizing. The same trap sits in the exits: moving a stop out and a target in changes your R-multiples while pushing the win rate up, from 39.7% to 51.0% in simulation. Lesson 48 measures that half of the problem and gives the two ratios that catch both.
What does the course say to do instead?
Its first instruction is the one people skip, because it sounds like a punishment rather than a fix: “cut the position size right down — to take emotion and psychology out of it.” Not stop. Not calm down. Make the next position smaller. Three more follow: set a maximum loss for one trading day and stop for a few days when it is hit; go back to a demo account to rebuild confidence; and drop the idea that a trader has to take a trade every day to make money.
The first one is worth defending with numbers, because it is the exact opposite of what the reflex wants and it has a price of its own.
| What you do to the size after a loss | Average risk | Median result | Chance of a 25% drawdown | What you got for it |
|---|---|---|---|---|
| Halve it (the course's fix) | 0.70% | 2.96x | 0.0% | A real trade: less money, far more survivability |
| Leave it alone | 1.00% | 4.66x | 0.7% | The baseline |
| Double it | 1.60% | 10.91x | 26.8% | Compare it with a flat 1.60%, not with this row — see below |
The third row is where people misread this kind of table, so we will say it directly: doubling after a loss produces a larger median than the baseline only because the trader is now risking more on average, and 1.60% is still nowhere near the level where growth turns down. That is not a discovery about revenge trading; it is Lesson 39's territory. The comparison that isolates the reflex is the one in section two — against a flat 1.60% — and there it loses on both counts.
Halving, meanwhile, is honest about its cost: 2.96x instead of 4.66x over 400 trades, in exchange for a 25% drawdown becoming effectively impossible. You are allowed to decide you would rather not make that trade. What you cannot claim is that raising the size is the same trade run backwards. It is not. It buys more drawdown and less money, which is the single combination nobody picks on purpose.
What people get wrong about this
- “It only matters if the loss was big.” The opposite is closer to true. A loss big enough to frighten you is one you notice; the ordinary ones slide past, and 60% of your trades follow one.
- “I'll know because I'll feel angry.” The sizing half of the mistake leaves no trace in the win rate, the average R or the setup quality — and by the time the feeling is loud enough to name, the order is placed. That is why both tests in this lesson run on files rather than on introspection.
- “My win rate fell, so my edge is gone.” Check whether it fell in both groups. If only the after-a-loss group moved, the edge is intact and replacing the strategy would throw away the one thing that still works.
- “A smaller revenge trade is a compromise.” A zero-expectancy trade at half size is still zero expectancy. It costs less per trade and it teaches the habit just as well, which is the more expensive half.
- “It got the money back, so it worked.” The occasional recovery is exactly why the habit survives long enough to meet a bad day at full size. Grade the decision; the result of one trade is not a verdict on you.
Where this lesson is wrong
Three boundaries, and the first is the one that matters most.
If the system has no edge to protect, none of this helps. Every figure above assumes a strategy that makes money when it is followed. Sizing rules and cooling-off periods slow down a losing process; they do not turn it around. The split-log test is also what tells the two cases apart, which is why it comes before the fixes rather than after them.
The model assumes trades are independent of each other — a loss says nothing about what the next trade will do. That is deliberate: it means the damage measured here cannot be blamed on losses clustering. Real markets do cluster, though, so the drawdown figures in this lesson are optimistic, not pessimistic. Add correlation and they get worse.
And not every rule about the next trade is a good rule. Halving after a loss is a defensible response with a measured cost. A schedule that halves and halves again after each loss until you are trading a size too small to matter is a different thing, and it fails for the mirror-image reason: your size is once again being set by the last result rather than by the account.
Frequently asked questions
Is every trade after a loss a revenge trade?
No, and treating it that way would cost you good trades. A second entry can be entirely legitimate: written down in advance, sized from the account, inside whatever daily limit you set while calm. In a system that wins 40% of the time, six trades in ten sit immediately after a loss, so a rule that outlawed all of them would outlaw most of your trading. The question is not when the trade came. It is whether the reason for it and the size of it existed before the previous trade closed.
How many trades do I need before the win-rate test means anything?
Roughly fifty in each group, and even then treat it as a flag rather than a verdict. With twenty trades either side, a gap of five or six percentage points is well inside what chance produces on its own. The gap the simulation produces from a genuine revenge habit is 11.4 points and it is stable, so if your own gap is that size and it survives another fifty trades, it is not noise. If you have fewer trades than that, the honest answer is that you cannot tell yet, and the useful thing to do in the meantime is record the size you intended alongside the size you used.
My win rate dropped. Is my strategy broken or am I revenge trading?
Split the log and the two look nothing alike. A strategy that has stopped working degrades in both groups at once: your win rate after a win falls too, because the setups themselves are failing. A revenge habit leaves the after-a-win group untouched at its old figure and pulls only the after-a-loss group down. That distinction matters more than it sounds, because the two problems have opposite fixes. One asks you to change the system. The other asks you to change nothing about the system at all.
Does cutting my size after a loss actually help, or does it just make less money?
Both, and the honest version of the advice has to say so. In the simulation, halving the risk on the trade after a loss took the median result from 4.66x down to 2.96x over 400 trades, and it took the chance of a 25% drawdown to effectively zero. That is a real trade: less money for more survivability, and you are entitled to decide you do not want it. What you are not entitled to is the belief that raising the size after a loss is the same trade in the other direction. It is not. It buys more drawdown and less money at the same time, which is the one combination nobody would choose deliberately.
Next: The gambler's mindset — why treating each trade as its own separate project is the habit that replaces both of the mistakes in this lesson.