FOMO — the fear of missing out, priced
Almost everything written about FOMO is advice about your feelings: be patient, be disciplined, don’t let greed drive. None of it is wrong and almost none of it is usable at the moment it matters, because by the time your hand is on the button the decision has already been made somewhere else. This lesson takes a different route. It shows that chasing has an exact price you can calculate before the candle ever runs, and that every setup has a price at which it stops being a setup — a number you can put an alert on. You do not have to win an argument with yourself. You have to do a division in advance.

The one thing this picture is drawn to show is the bracket: the gap between where you are and where price went is a measurable distance, and it carries a tag. Every number in this lesson is in the charts and tables below.
KEY TAKEAWAYS
- The stop does not move with you. It sits on a level the chart put there (Lesson 43), so chasing widens the gap between entry and stop without widening anything else. Entry +3%; risk per unit +126%.
- Every 1% chased costs 1 ÷ (your stop distance) of your risk. With the stop 2.38% away that is 42% of the risk budget per 1% chased. With a 1% stop it is 100% — so the tighter and better your stop, the more expensive FOMO becomes.
- Chasing makes you own less of the move you were afraid to miss. Size is the risk budget divided by the stop distance (Lesson 42), so the 3% chase cuts the position by 55.8% and cuts what you earn if you are right from $400 to $121 — a 69.7% pay cut for being correct.
- It flips the sign of the system. At an unchanged 40% win rate, +1.00R becomes −0.115R. One chased trade in five drops overall expectancy by 22.3%.
- Every setup has an expiry price. Emax = (T + W·S) ÷ (1 + W). Here that is 43,000 — exactly one stop distance above plan. On a 1:2 setup the room to chase is only 0.20 of a stop distance.
What is FOMO in trading, really?
It is a behaviour at the entry, not a state of mind. The course this site teaches from lists it among the errors a trader makes with their hands: always feeling you must take this trade or the chance is gone, and chasing a running price, or trying to catch the top or bottom in a violent move. That framing matters more than it looks. A feeling cannot be audited; an entry price can. You can open your journal tonight and count how many of your entries were above the price you wrote down, and no self-knowledge is required to do it.
Two other things are worth saying before the arithmetic starts, because both cut against the usual advice.
Knowing more can make it worse. The traders who study hardest are often the ones who chase most, and there is a mechanism rather than an irony behind it: the more patterns you can name, the more of them you can see in any given hour, and without a filter that can say not this one, every recognisable shape becomes a candidate. FOMO in that case is not ignorance. It is knowledge with no gate attached to it.
Waiting is two different activities. Sitting out because your conditions are not met is a conclusion; sitting out because you have not worked up the nerve is a feeling. From the outside they look identical — the same person, not trading. But only the first one survives contact with a fast candle, because only the first one has something written down that the candle can be checked against. This is why “be patient” is such weak advice: it names the visible behaviour and skips the thing that produces it.
The worked example, used throughout. Long BTC on the 4H chart. The invalidation level is the 4H swing low at 41,000; the plan is to enter on the retest at 42,000; the target is the prior swing high at 46,000. That is $1,000 of risk against $4,000 of reward, a ratio of 4.00. Account $10,000, risk 1% = $100 (Lesson 40). The system wins 40% of the time, the same working assumption used in Lesson 41. Illustrative, hypothetical prices — not a recommendation.
Why does chasing cost more than the price moved?
Because the stop is a place, not a distance. Lesson 43 put it on a level the market drew — under the swing low, at 41,000 — and that level has no opinion about what you paid. Move your entry up and the whole cost of the move lands on one number: the gap between entry and stop.
Chase 3% and the entry goes from 42,000 to 43,260. The stop is still 41,000. So the risk on each unit goes from $1,000 to $2,260.
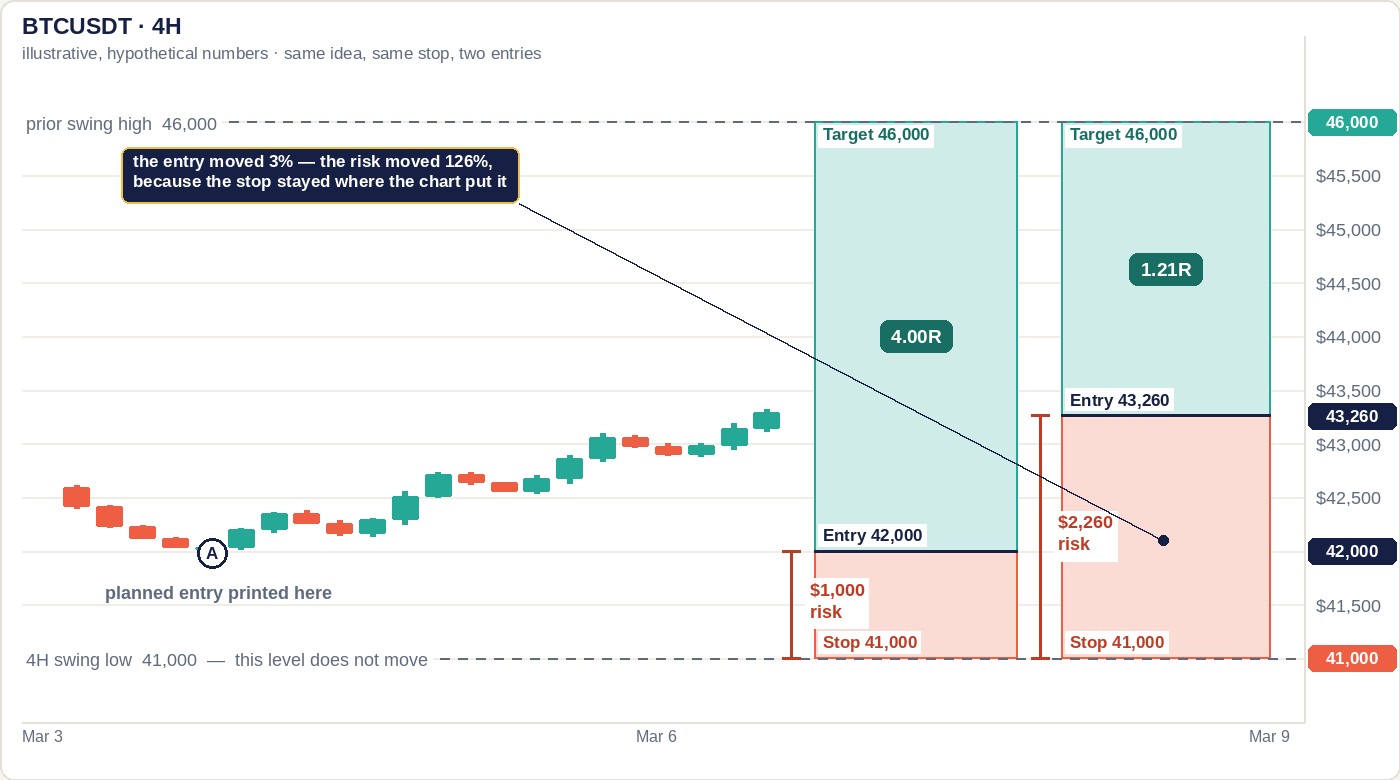
Now the part that is worth memorising, because it generalises past this one trade. Chasing a percentage of the price costs you a percentage of your risk distance, and those two percentages are related by a single multiplier:
Each 1% you chase adds k% to the risk on every unit, where k = 1 ÷ (stop distance as a percentage). Here the stop is 1,000 below a 42,000 entry, which is 2.38%, so k = 42. One percent of chasing eats 42% of your risk budget.
| Stop sits this far from entry | Multiplier k | Each 1% chased adds this much risk | Chasing 3% adds |
|---|---|---|---|
| 1.00% | 100 | +100% | +300% |
| 2.00% | 50 | +50% | +150% |
| 2.38% (this lesson) | 42 | +42% | +126% |
| 5.00% | 20 | +20% | +60% |
| 10.00% | 10 | +10% | +30% |
Read the first row again, because it is the uncomfortable one. A trader whose stops are tight and precise is punished harder by chasing than a trader whose stops are loose. With a 1% stop, chasing 1% doubles the risk on every unit. The better your entry technique — the closer you can put the stop to the level that actually invalidates the idea — the more you lose by abandoning that entry. Skill at entries and tolerance for chasing are not two separate habits you can hold at once; the first one raises the price of the second.
What happens to your position size?
It collapses, and it collapses for a reason that has nothing to do with confidence. Lesson 42 fixed the calculation: size = risk budget ÷ stop distance. The budget is $100 whatever you do. The denominator is what you just made bigger.
At the planned entry: $100 ÷ $1,000 = 0.10000 BTC, about $4,200 of exposure. After a 3% chase: $100 ÷ $2,260 = 0.04425 BTC, about $1,914. 55.8% less position.
Which produces the fact this whole lesson is built around:
Chasing makes you own less of the move you were afraid of missing. If the trade works exactly as planned and price reaches 46,000, the planned entry earns $400 and the chased entry earns $121 — a 69.7% pay cut for being right. The fear was of missing the move; the response guarantees a smaller share of it.
That is not a psychological paradox, it is a division. And notice it is a cost you pay on your good days, which is why it stays invisible for so long: a chased trade that hits target still shows up green in the journal. Nothing about it announces that it should have been worth three times as much.
Does the trade still pay?
Usually not, and it stops paying much earlier than people expect. Expectancy per trade, in R, is win rate × R minus loss rate × 1. At 40% wins that is 0.40R − 0.60. Here is the whole picture at once.
| Chased | Entry | Risk | Reward | R | Break-even win rate | Size (BTC) | Earned if right | Expectancy |
|---|---|---|---|---|---|---|---|---|
| 0% | 42,000 | $1,000 | $4,000 | 4.00 | 20.0% | 0.10000 | $400 | +1.000R |
| 1% | 42,420 | $1,420 | $3,580 | 2.52 | 28.4% | 0.07042 | $252 | +0.408R |
| 2% | 42,840 | $1,840 | $3,160 | 1.72 | 36.8% | 0.05435 | $172 | +0.087R |
| 3% | 43,260 | $2,260 | $2,740 | 1.21 | 45.2% | 0.04425 | $121 | −0.115R |
| 5% | 44,100 | $3,100 | $1,900 | 0.61 | 62.0% | 0.03226 | $61 | −0.355R |
The system did not change. The chart did not change. The win rate is held at 40% all the way down the table. Only the entry moved — and somewhere between the 2% row and the 3% row a +1.00R edge becomes a losing one. That is the sentence to take away: a good system and a chased entry can be a bad trade at the same time, and no amount of being right about direction repairs it.
You do not have to chase every trade for this to matter. If one trade in five is a chase at 3%, overall expectancy goes from 1.00R to 0.777R — a 22.3% cut, paid quietly, spread across a whole quarter of results.
And the table is generous. It assumes the chased entry wins as often as the planned one, which is unlikely: buying after a fast run means buying with less room to the target and a stop that is now far enough away to sit under more noise. Treat −0.115R as the floor of the cost, the part that is pure arithmetic before any of the market’s opinions are added.
At what price does a setup expire?
This is the practical heart of the lesson, and it is one line of algebra. Your win rate p implies a minimum ratio you need just to break even: W = (1 − p) ÷ p. At 40% that is 1.50. Set the ratio equal to W and solve for the entry:
Emax = (T + W·S) ÷ (1 + W) — the highest price at which this idea is still worth taking. Here: (46,000 + 1.50 × 41,000) ÷ 2.50 = 43,000. Equivalently, the room you have to chase is (reward − W·risk) ÷ (1 + W) = $1,000, which is 2.38% above plan and exactly one stop distance.
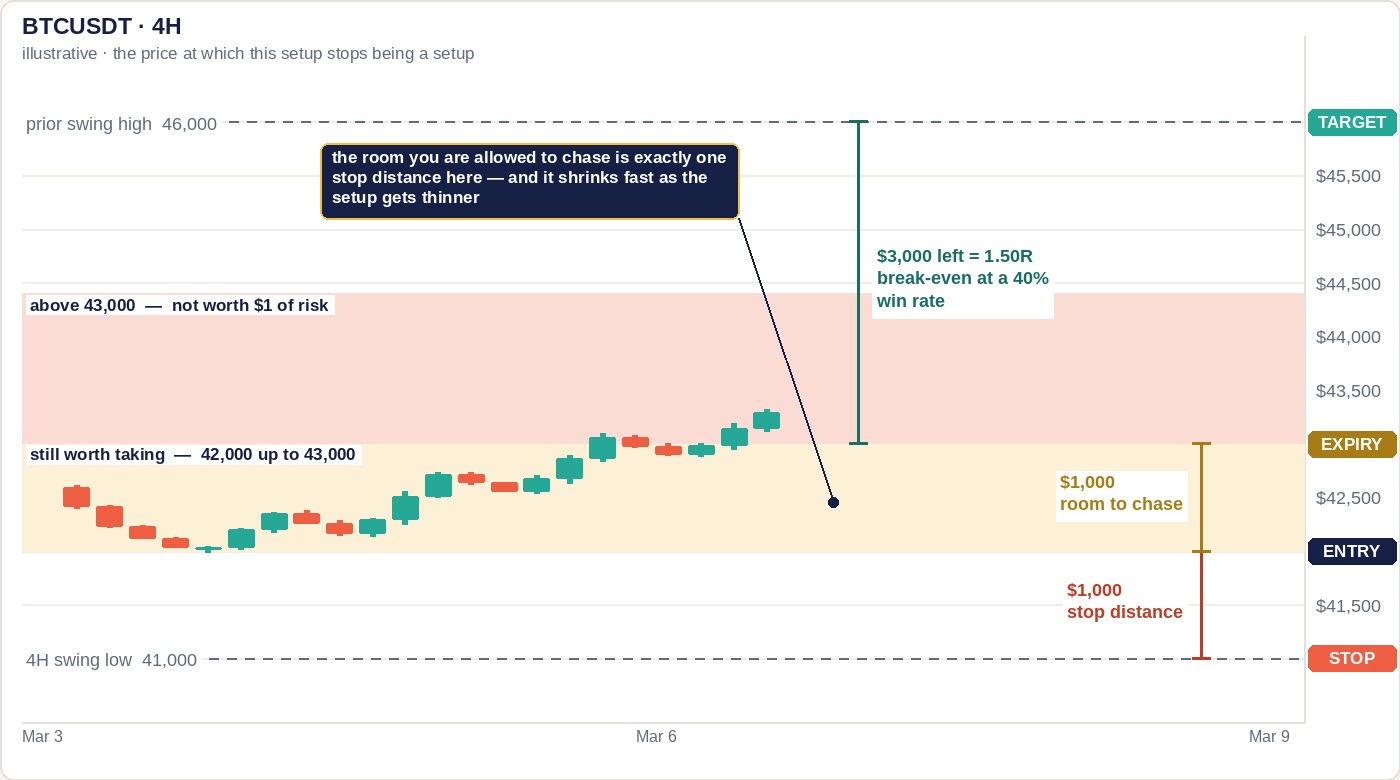
Do not generalise “one stop distance” into a rule. It is a consequence of this setup being a 1:4, and it shrinks quickly as the setup gets thinner:
| Planned ratio | Room to chase (in stop distances) | If the stop is $1,000 | Comment |
|---|---|---|---|
| 1:4 | 1.00× | $1,000 | the worked example |
| 1:3 | 0.60× | $600 | |
| 1:2.5 | 0.40× | $400 | |
| 1:2 | 0.20× | $200 | a fifth of the stop — barely any room at all |
| 1:1.5 | 0.00× | $0 | already at the break-even ratio; any chase kills it |
Two things follow. First, the setups people most want to chase are usually the ones with the least room, because a fast move is often eating the reward you were going to be paid for. Second, this gives you something to do rather than something to resist: when you write the plan, write the expiry price beside the entry, and put the platform alert there instead of at the entry. An alert at your entry tells you the trade has arrived. An alert at the expiry price tells you the trade has left, which is the fact you are actually bad at noticing.
Does a smaller position fix it?
No — and this is the most common repair people reach for, so it is worth doing the sum. Take the 3% chase at half the usual budget: $50 of risk instead of $100. Size becomes $50 ÷ $2,260 = 0.02212 BTC. If the trade works you make $60.62; if it stops you lose $50.00. At 40% wins, expectancy is 0.40 × $60.62 − 0.60 × $50.00 = −$5.75 per trade.
Still negative. It was always going to be: halving a negative number does not change its sign. Cutting the size cuts the bleed in half and leaves you doing the losing thing at a slower rate.
There is a second cost that never shows on a spreadsheet. A half-size chase that happens to work teaches you that chasing is allowed as long as the size is small, and the next one will not be that small. This is worth separating carefully from Lesson 44: a first tranche of a ladder decided before the first order exists is a technique, and a tranche invented after the price moved is a consolation prize with a technique’s name on it. The test is mechanical — could you have stated the size before the candle?
Why does FOMO arrive in waves?
Because the supply of reasons to buy is not spread evenly across the year. Near the top of a run there are more good headlines, more ambitious price targets, more people you know posting gains. Near the bottom there are fewer of all three, even though that is when the arithmetic above is at its most favourable.
There is a structural reason rather than a conspiratorial one. Anyone unwinding a large position needs someone on the other side of it, and at scale that other side has to be a crowd. Crowds do not assemble around a price; they assemble around a story. So the density of urgency-producing material is highest exactly where the ratios are worst, and lowest where they are best. You do not need to believe anyone is coordinating anything to accept the consequence: the feeling of “this is obviously the moment” is at its strongest when your expiry price is closest.
Two questions handle news better than trying to evaluate the news itself, and both are checkable on a chart rather than in an argument:
- Is price already reflecting it? Genuinely bad news that fails to move price down is information about who is buying. Genuinely good news that fails to move price up is the same information in reverse. The reaction is the data; the headline is the prompt.
- In this scenario, who is being paid? If the story requires a great many small buyers to act at once, you are being told what your role in it is.
That is as far as this lesson goes into market structure. What matters here is only the timing: FOMO clusters, so a rule that depends on you being calm will be tested hardest on the days you are least calm.
FOMO is one station on a longer loop. The feeling that follows a loss — the one that makes you skip the next valid setup — costs about twelve times more than the bad entries FOMO adds, and it leaves no trace in any journal because it produces no order. Lesson 48 prices the whole cycle.
What stops it, if willpower does not?
Nothing that happens at the button. By the time the entry is in front of you, the deciding is over; whatever you do next is executing a decision made earlier, in a state you are no longer in. The lever is therefore never resist harder. It is move the decision earlier and write it down, because reasoning that stays in your head is edited by whatever you are feeling, and reasoning on paper is not.
Three questions, asked while nothing is moving, do most of the work:
- Why this move? Not “why is this a good market” — why this one, with a level you can point at.
- What is the probability, and where does that number come from? If the honest answer is somewhere near a coin flip, that is a complete answer: it is a no.
- Might there be a better one after this? The first two questions catch technical errors. Only the third one addresses FOMO, because scarcity — not analysis — is what puts people into bad entries.
On the third: the school this site teaches from argues that a move large enough to be worth chasing is large enough to pause somewhere, and that the pause is usually visible if you drop a timeframe — what looks like one unbroken run on the 4H often has three or four rest points on the 15m (Lesson 21). Treat that as a reason to keep watching rather than as a promise; a market in a real one-way trend can leave and not come back. But note that even in that case the answer is not to chase. It is that this particular trade was not available to you, which is an ordinary thing for a trade to be.
The course puts the same idea more bluntly, and it is worth pinning above a screen: the market opens again tomorrow — do not take a trade that does not meet the criteria you set. Alongside it sits the observation that trading done properly is dull, so a trader who feels excited should be suspicious of the feeling rather than fuelled by it.
Practice corner
Two exercises. The first measures the habit; the second prices what it has already cost you.
1. Write the expiry price, then count. For your next ten planned trades, before anything happens, write four numbers: stop, entry, target, and Emax = (T + W·S) ÷ (1 + W) using your own W. Set the platform alert at Emax, not at the entry. Afterwards, log for each trade whether you entered below it, above it, or not at all. The share of entries above Emax is your chase rate, and it is the first number in this whole lesson that is about you rather than about arithmetic.
2. Price the last twenty. For each of your last twenty trades, work out the R the plan had and the R the fill actually gave you. Add up the difference. That total, expressed in R, is what chasing has cost you over the period — and unlike a losing streak it will not appear anywhere in your profit and loss, because the money was never lost. It was never earned.
One caution on both: ten and twenty trades are enough to see a pattern and not enough to be certain of one. And neither exercise asks whether you felt calm. That question matters, but it is not answered in a spreadsheet.
Try it on a live chart. The exercise only works if the alert exists somewhere other than your memory. On any exchange you can rest a limit order at your planned entry and set a separate price alert at the expiry price, then leave both alone — the point is to find out how often price passes the expiry level while you are still thinking about the entry.
What people get wrong about FOMO
- “Chasing means risking more money.” If you size correctly it does not: the dollars at risk are still $100 either way. What you lose is the ratio, the position and the expectancy. This matters because the thing people check — the risk figure — is the one thing chasing leaves untouched.
- “I’ll just move the stop up with the entry.” Then the stop is no longer on a level, and you have converted a visible cost into an invisible one. See the next section.
- “A smaller position is a reasonable compromise.” It is half of a negative number. It also trains the habit it is meant to contain.
- Treating FOMO as impatience. Often it is the opposite — a well-read trader who can see six patterns at once and has no rule for rejecting five of them. The fix is a filter, not more calm.
- Using “I’ll wait for the pullback” as a permanent position. Waiting with a written level and an expiry price is a plan; waiting without them is the same paralysis that later produces the chase, and the two are usually the same afternoon.
- Confusing a chase with a legitimate re-entry. If price has since built a new structure — a new swing low to hide behind (Lesson 12) — then a new entry with a new stop is a new trade, and it deserves its own ratio and its own expiry price. That is not chasing. Chasing is keeping the old stop and paying a new price for it.
- Reading a green result as a vindication. A chased trade that reaches target is still a trade that paid you 30% of what the plan was worth. Outcomes do not audit process, which is why the exercise above compares planned R with filled R rather than counting winners.
When this lesson is wrong
Everything above rests on one assumption: the stop is a level, not a distance. If instead you set the stop a fixed percentage below wherever you happen to enter, then chasing does not degrade the ratio — risk and reward move together and R stays roughly constant. The cost does not disappear, though; it changes address. A stop pinned to your entry rather than to the chart ends up inside ordinary noise, and you pay through the win rate instead of through R. The two failure modes look completely different in a journal and produce the same account balance.
The second boundary is the win rate itself. W = (1 − p) ÷ p, so a genuinely better system has more room:
| Win rate | W (minimum ratio) | Room to chase | Expiry price |
|---|---|---|---|
| 30% | 2.333 | $500 | 42,500 |
| 40% | 1.500 | $1,000 | 43,000 |
| 50% | 1.000 | $1,500 | 43,500 |
| 55% | 0.818 | $1,750 | 43,750 |
Use your measured win rate, not an aspirational one, and remember that a win rate estimated from twenty trades has a very wide error bar around it. If you do not know your number, 40% is a conservative placeholder rather than a fact about you.
The third boundary is honest and unhelpful: on a genuine breakout with no nearby structure to hide a stop behind, there may be no valid entry at any price. The lesson does not say chase less in that situation. It says the trade did not exist, and the correct response to a trade that does not exist is to not take one.
Frequently asked questions
Is it FOMO if I enter late but the setup is still valid?
Not necessarily, and there is a test that does not depend on how you feel. Price the late entry as its own trade against the stop you are actually going to use. If the ratio still clears the minimum your win rate demands, it is a worse version of the same trade and you may take it in the knowledge that it is worse. If it does not clear the minimum, it is no longer a setup at all, whatever it looked like ten minutes ago. On the worked example a 40% win rate needs 1.50R, and every entry up to 43,000 clears it while every entry above 43,000 does not. The word “late” describes the clock. The expiry price describes the trade.
How much am I allowed to chase an entry?
Exactly as far as the expiry price, which you can compute before the trade exists: Emax = (T + W·S) ÷ (1 + W), where S is the stop, T is the target and W is the minimum ratio your win rate needs, W = (1 − p) ÷ p. On the worked setup — stop 41,000, planned entry 42,000, target 46,000, win rate 40% so W = 1.50 — the expiry price is 43,000, which is 2.38% above the plan and exactly one stop distance. That headroom is not a constant. On the same stop and win rate a 1:3 setup gives 0.60 of a stop distance and a 1:2 setup gives 0.20 of one, so a thinner setup can barely be chased at all.
Does entering with a smaller position fix FOMO?
No, because halving a negative number does not change its sign. Taking the 3% chase at half the usual risk budget means winning $60.62 and losing $50.00 on a 40% win rate, which is −$5.75 of expectancy per trade instead of −$11.50. The bleed is slower, not stopped. There is also a second cost that does not show up in the arithmetic: a half-size chase that works teaches you that chasing is permitted as long as the size is small, and the next one will be larger. A planned tranche from a ladder decided in advance is a different thing entirely — that is Lesson 44, and the giveaway is whether the size was decided before the price moved or after.
Why does chasing hurt more when my stop is tight?
Because the damage is measured against your stop distance, not against the price. Each 1% you chase adds 1% of the entry price to the gap between entry and stop, and as a share of the original risk that is 1 divided by the stop distance expressed as a percentage. If the stop sits 2.38% away, every 1% chased adds 42% to the risk on each unit. If the stop sits 1% away it adds 100% — one percent of chasing doubles the risk. The uncomfortable consequence is that traders with the tightest, most precise stops are punished hardest by chasing, so better entry technique raises the cost of abandoning it.
If I miss the entry, will the price come back?
Sometimes, and nobody can promise otherwise — but that is the wrong question to organise a decision around. The school this site teaches from argues that a move large enough to be worth chasing is large enough to pause somewhere, and that the pause is usually visible on a lower timeframe even when the frame you are watching shows one unbroken run. Treat that as a reason to keep watching rather than as a guarantee, because a market in a genuine one-way trend can leave and not return. Either way the decision is the same: if this price is past the expiry price, the trade you planned is over, and a new entry needs a new level, a new stop and its own arithmetic.
Next: Revenge trading — why the trade you take straight after a loss is the one most likely to double the damage.