Part 3 — Chart patterns
Reversal, continuation and bilateral patterns - each one with how the course trades it. All 62 slides in the order the course teaches them — each one explained underneath.
Part 3 of the course. Every chart pattern in the deck belongs to one of three families — reversal, continuation or bilateral — and the family tells you what the pattern is allowed to promise: a turn, a pause, or a two-way squeeze you must not call in advance.
Slide 1 of 62 Tap to enlarge
What a reversal looks like as it forms. An uptrend builds a left shoulder, a higher head, then a weaker right shoulder — and the pattern only completes when price closes below the neckline. Until that close, the shape is a warning, not a trade.
Slide 2 of 62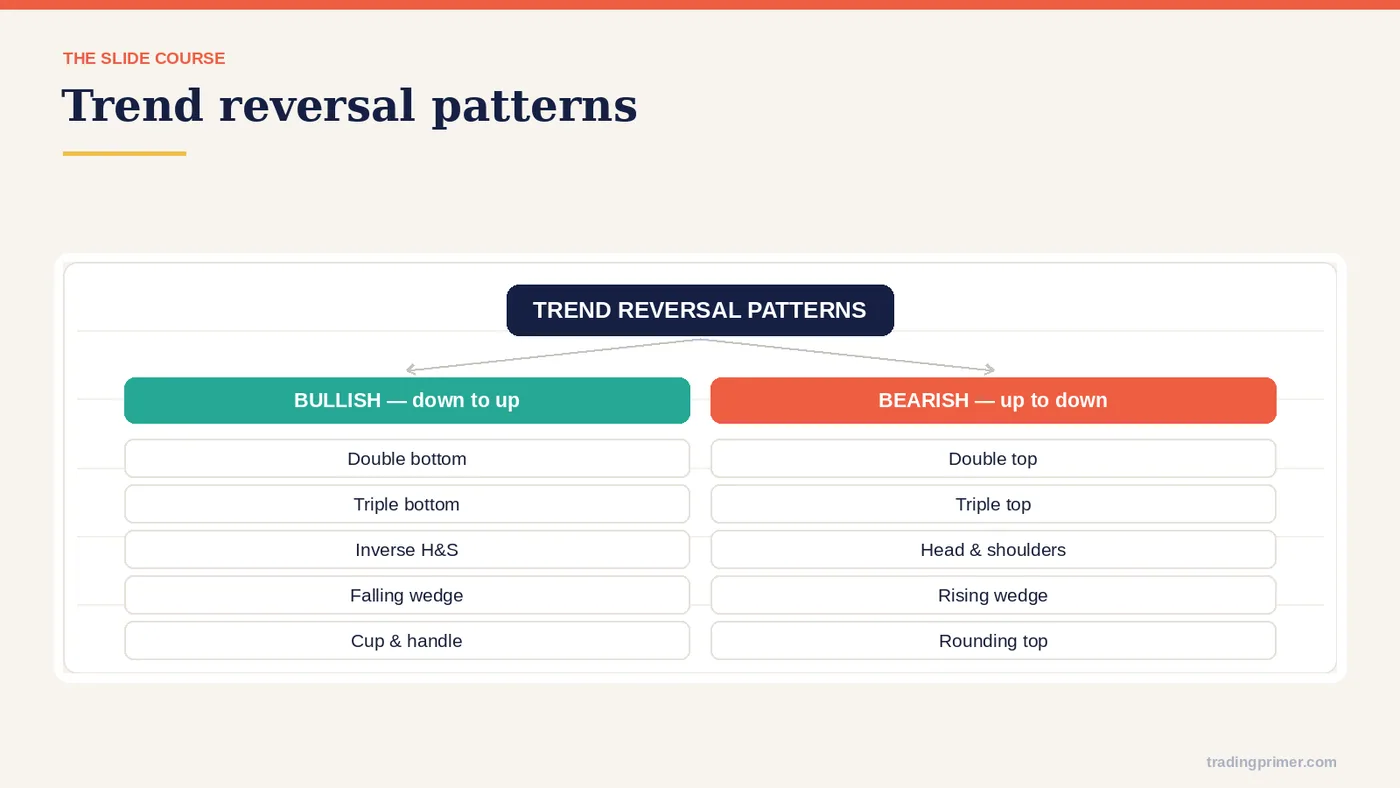
The reversal family at a glance. Double and triple bottoms, the inverted Head & Shoulders and the falling wedge all end a downtrend the same way: sellers fail at the same floor once too often. Learn the family logic first — the individual shapes are variations on it.
Slide 3 of 62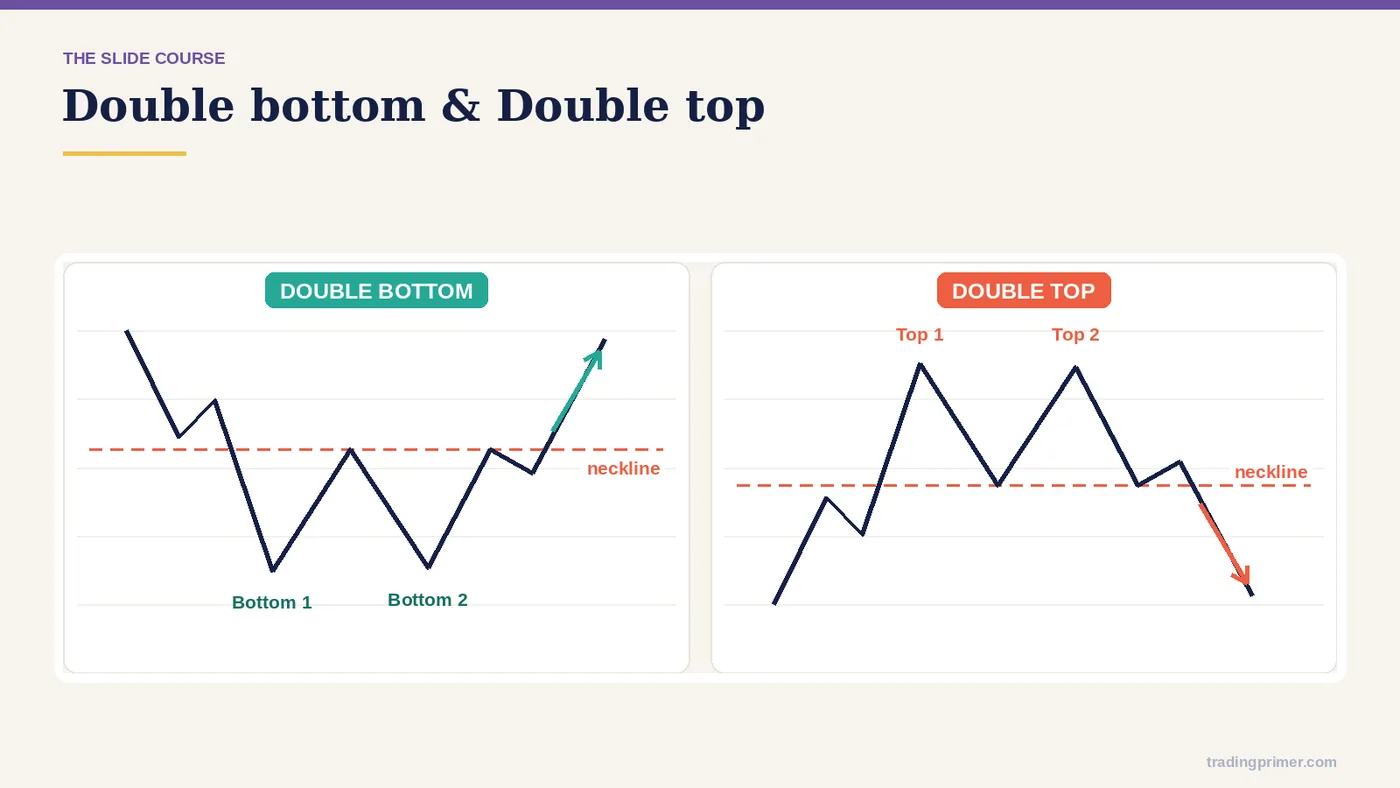
Double Bottom / Double Top — The shape is drawn on the chart with the levels that define it. What matters is where it forms and what price does at the boundary, not the name.
Slide 4 of 62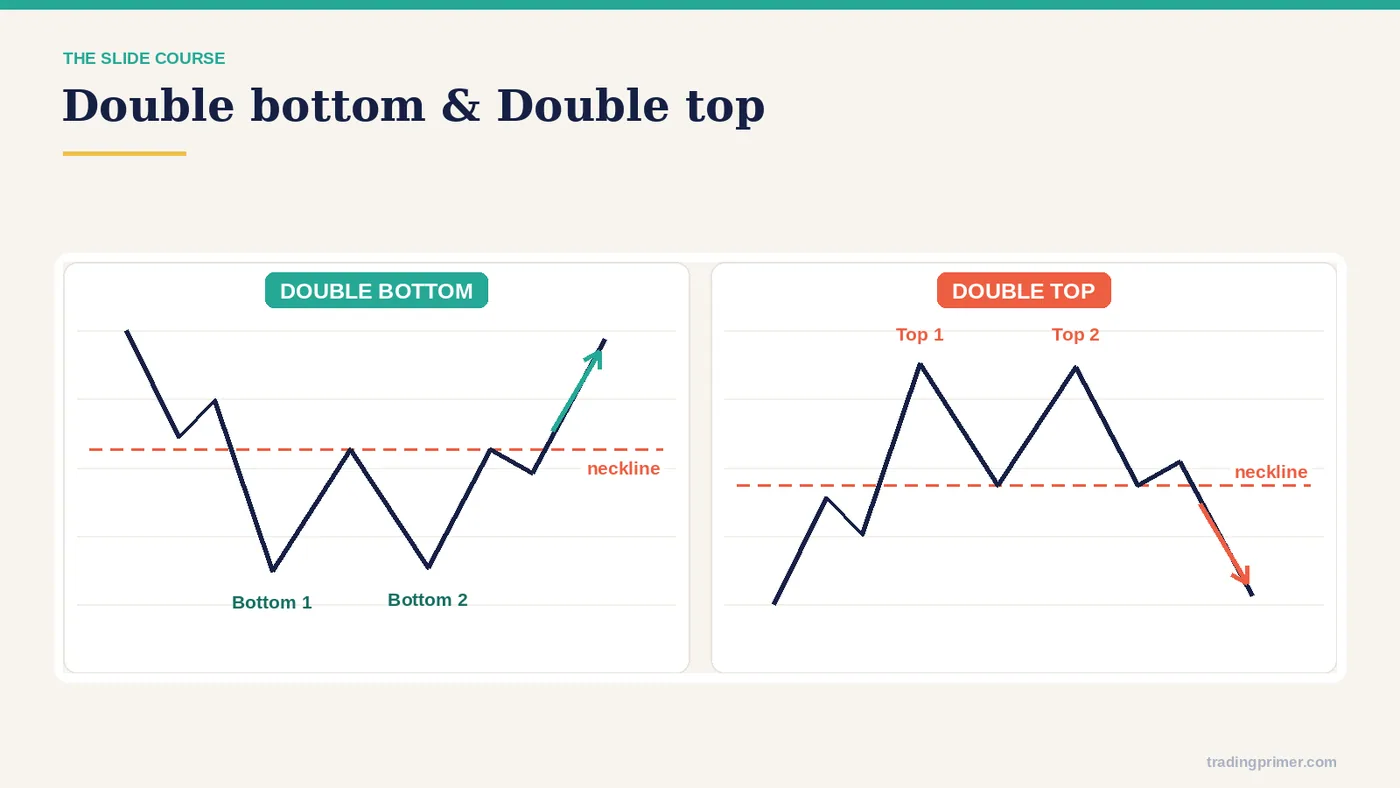
Double Bottom / Double Top — a chart from the course deck. The markings on it are the lesson; read them left to right.
Slide 5 of 62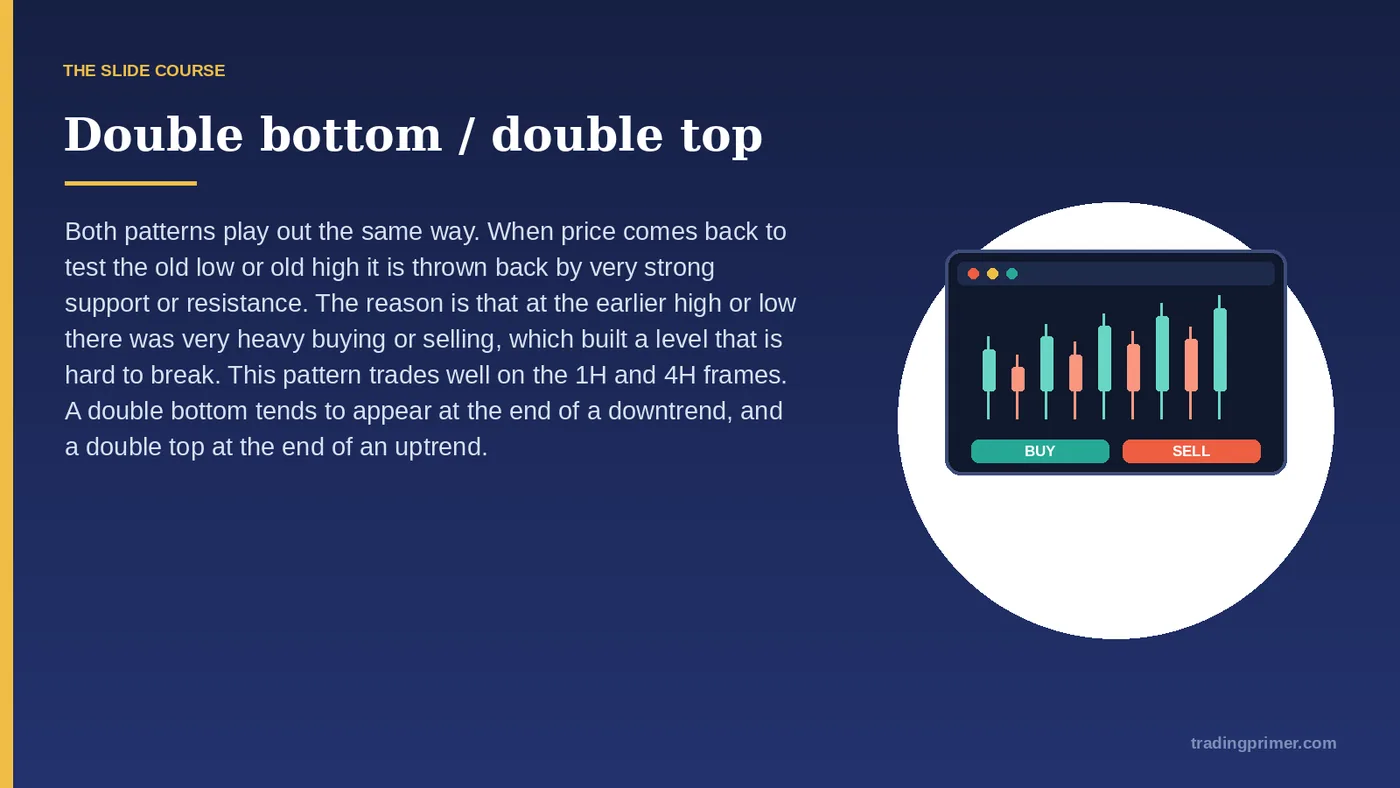
- Double Bottom / Double Top: — Both patterns play out the same way. When price comes back to test the old low or old high it is thrown back by very strong support or resistance. The reason is that at the earlier high or low there was very heavy buying or selling, which built a level that is hard to break. This pattern trades well on the 1H and 4H frames. A double bottom tends to appear at the end of a downtrend, and a double top at the end of an uptrend. Double bottom / double top.
Slide 6 of 62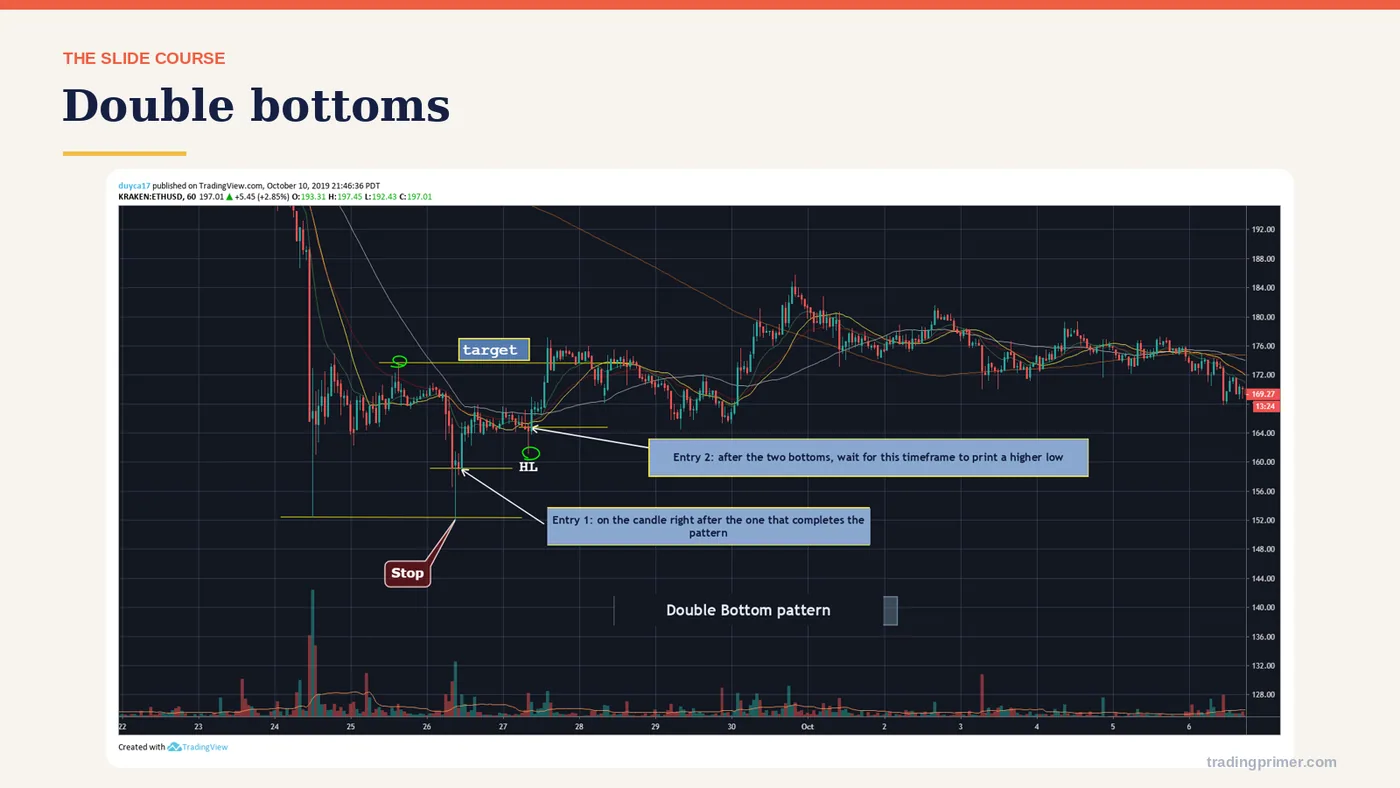
A real double bottom, marked up. Two touches of the same floor, then the course's two entries: Entry 1 on the candle right after the one that completes the pattern, Entry 2 after this timeframe prints a higher low. The stop sits beyond the pattern's extreme; the target is the pattern's height projected from the break.
Slide 7 of 62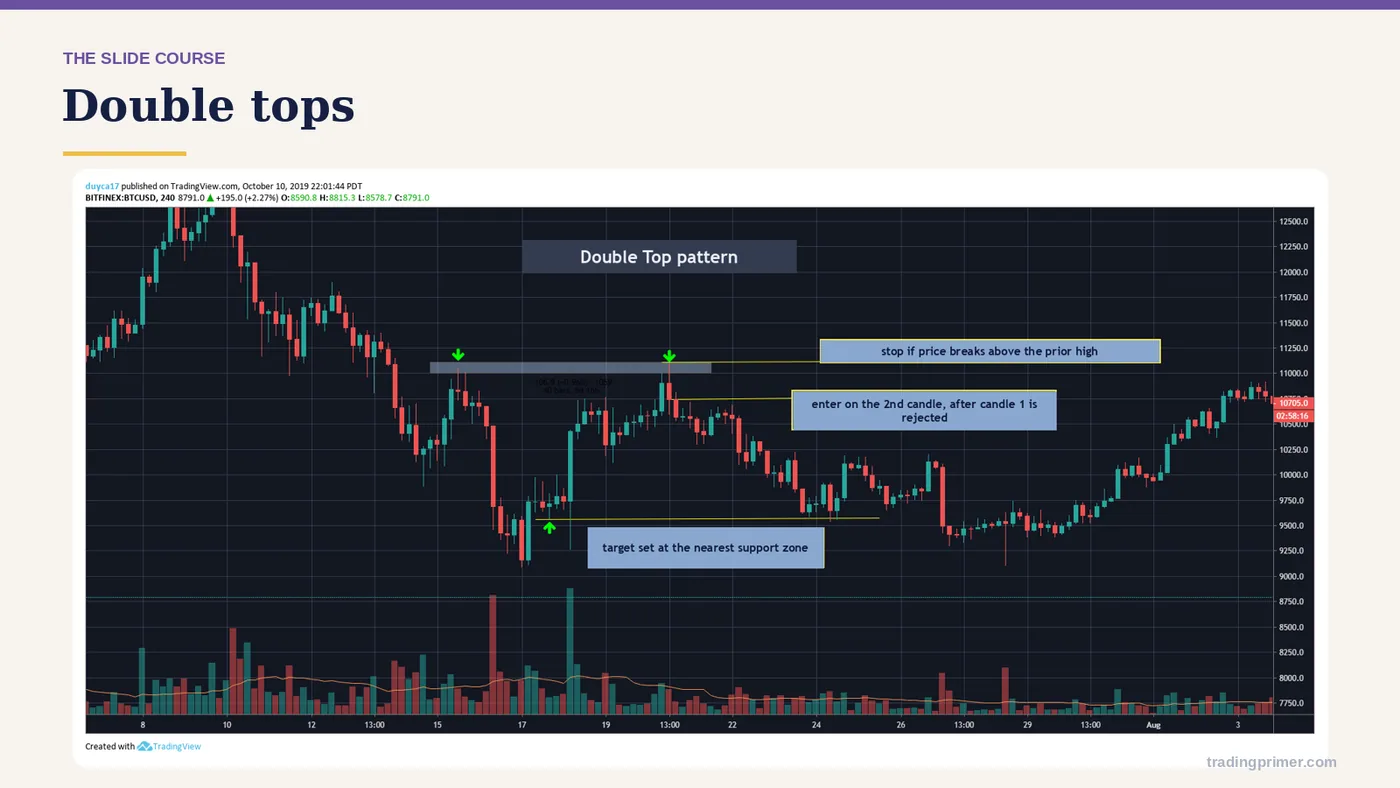
Double tops — The shape is drawn on the chart with the levels that define it. What matters is where it forms and what price does at the boundary, not the name.
Slide 8 of 62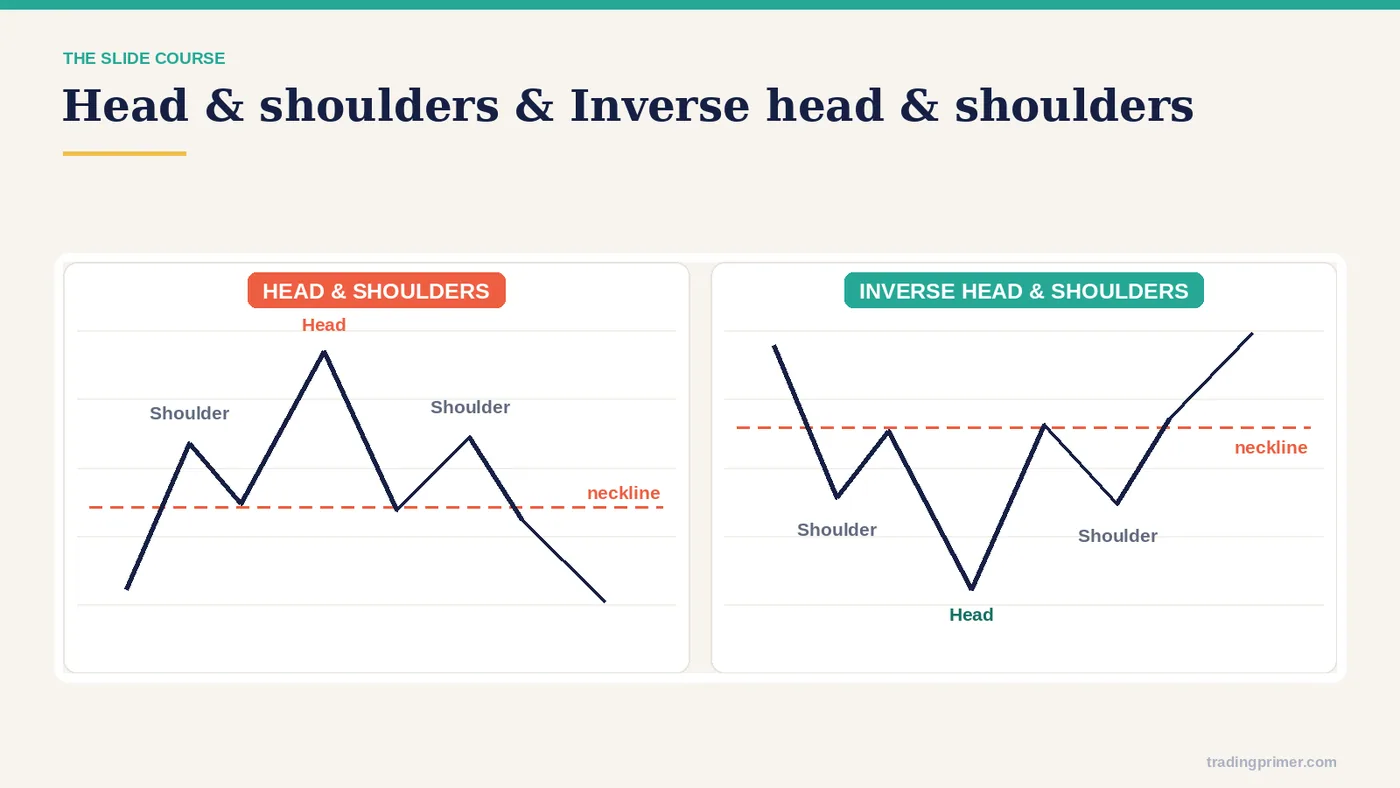
Head & Shoulders and Inverted Head & Shoulders — The chart carries the detail; the markings on it are what the course is teaching here.
Slide 9 of 62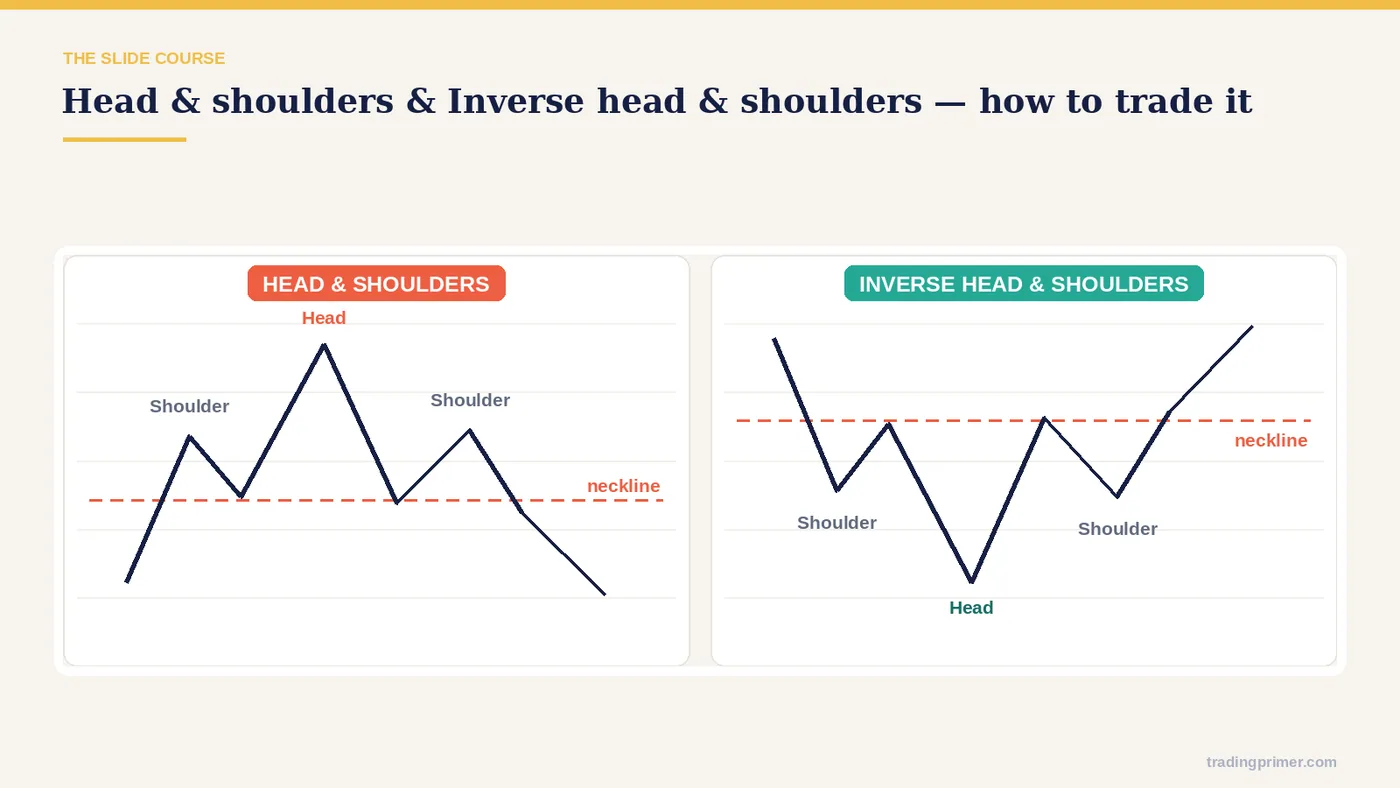
How to trade the pattern — The entry rule is on the chart itself: the course marks where the entry sits, where the stop goes, and what the pattern has to do before the trade is valid. Read the markings before moving on.
Slide 10 of 62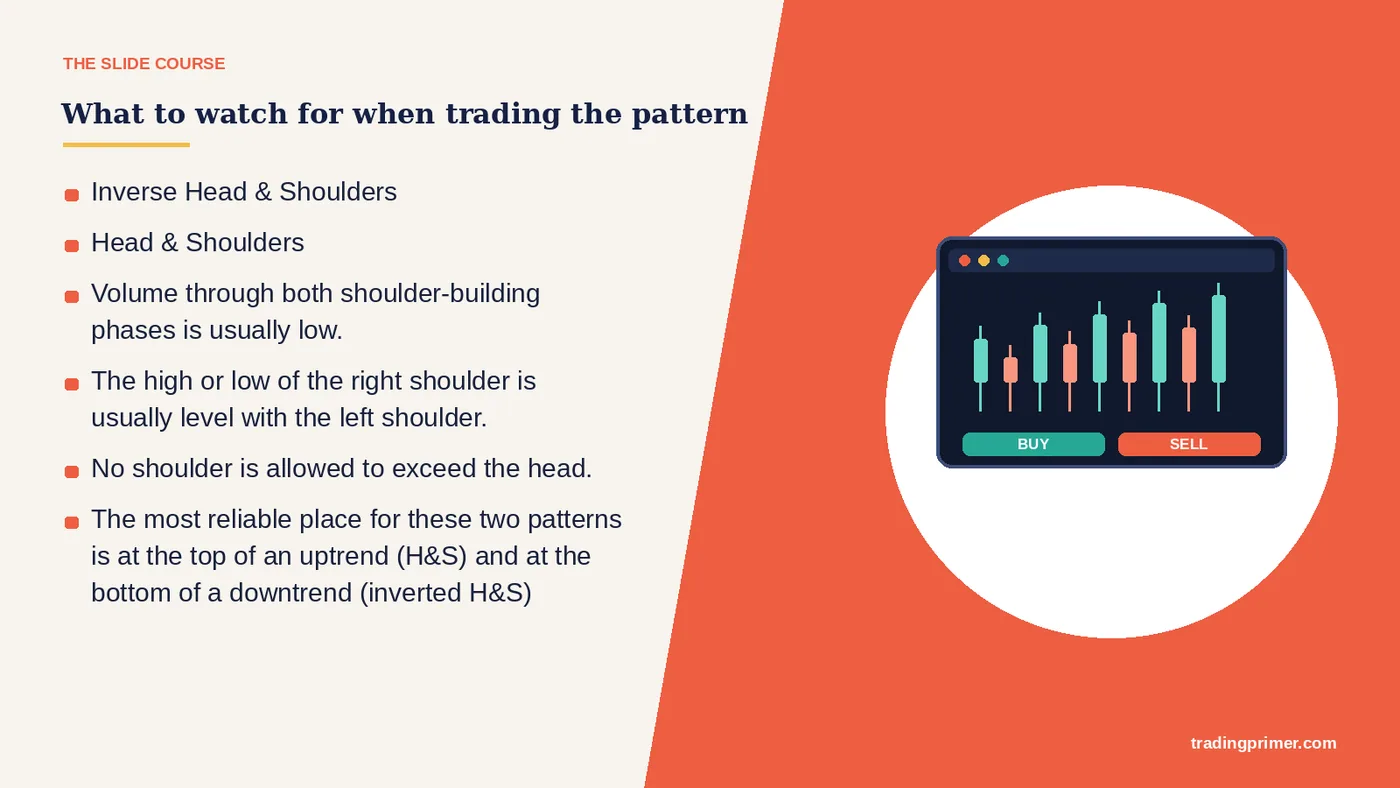
What to watch for when — trading the pattern. Head & Shoulders. Inverse Head & Shoulders. Volume through both shoulder-building phases is usually low. The high or low of the right shoulder is usually level with the left shoulder. No shoulder is allowed to exceed the head. The most reliable place for these two patterns is at the top of an uptrend (H&S) and at the bottom of a downtrend (inverted H&S).
Slide 11 of 62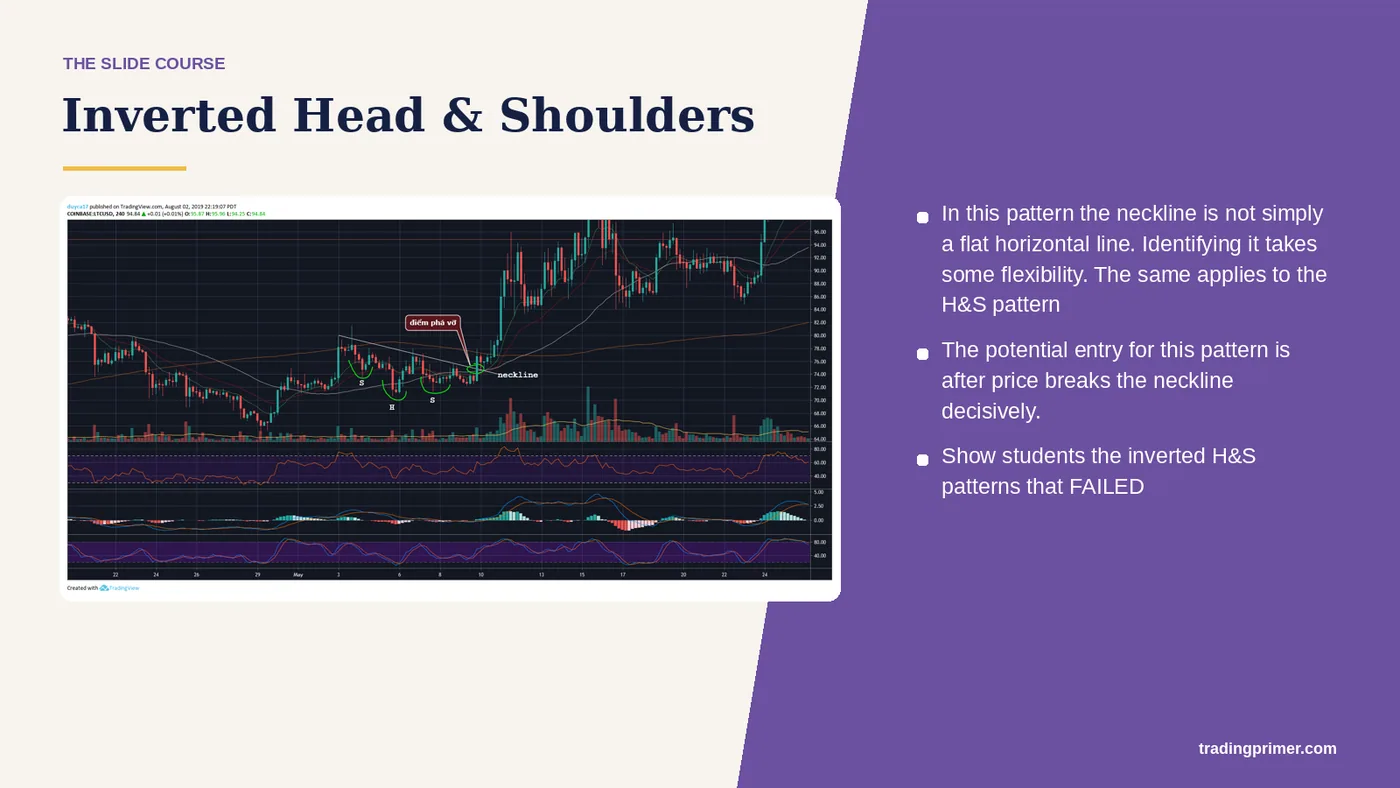
In this pattern the neckline is not simply a flat horizontal line. Identifying it takes some flexibility. The same applies to the H&S pattern — The potential entry for this pattern is after price breaks the neckline decisively. Show students the inverted H&S patterns that FAILED. Inverted Head & Shoulders. (Inverse Head & Shoulder).
Slide 12 of 62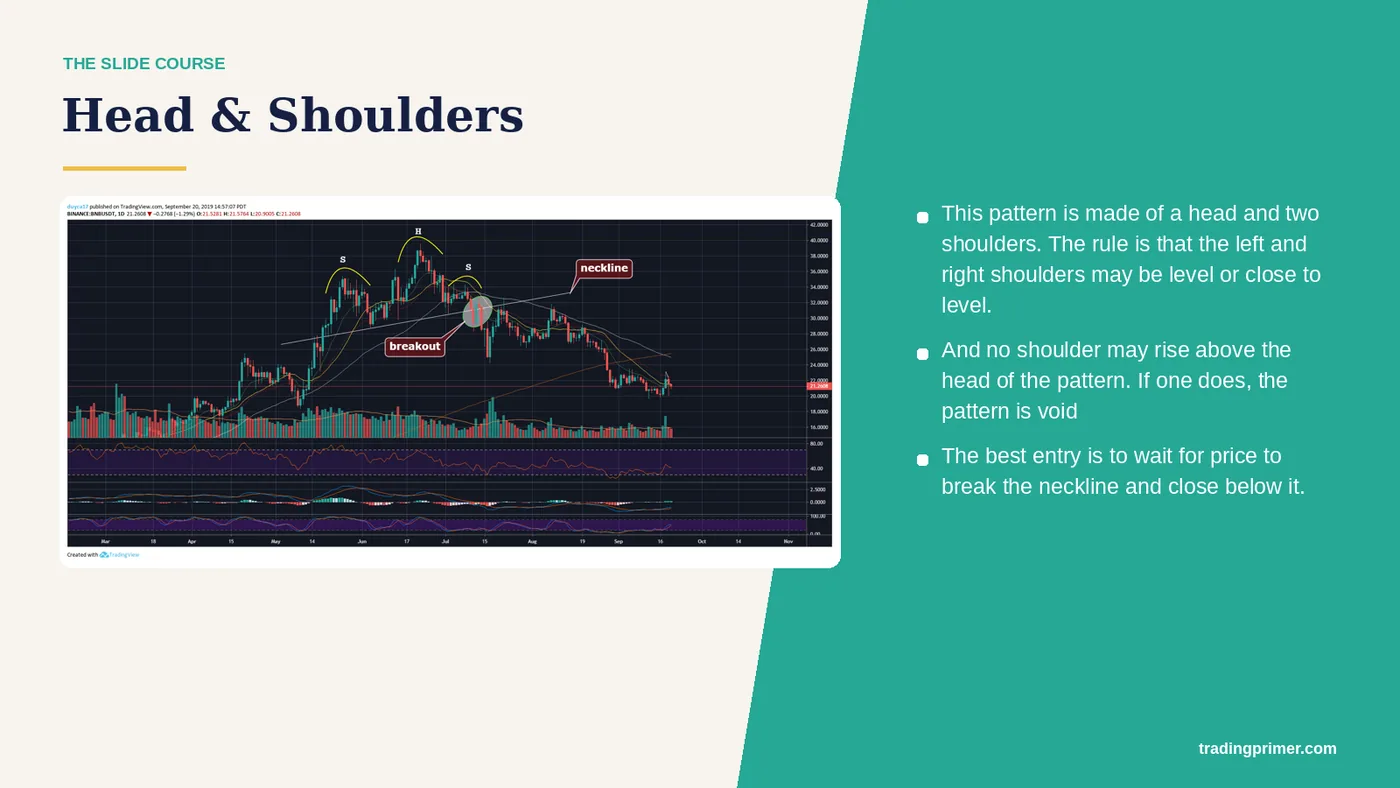
The rules that make it valid. Shoulders level or close to level, neither shoulder above the head — if one rises above it, the pattern is void. The entry is the close below the neckline, not the first wick through it; everything before that candle is preparation.
Slide 13 of 62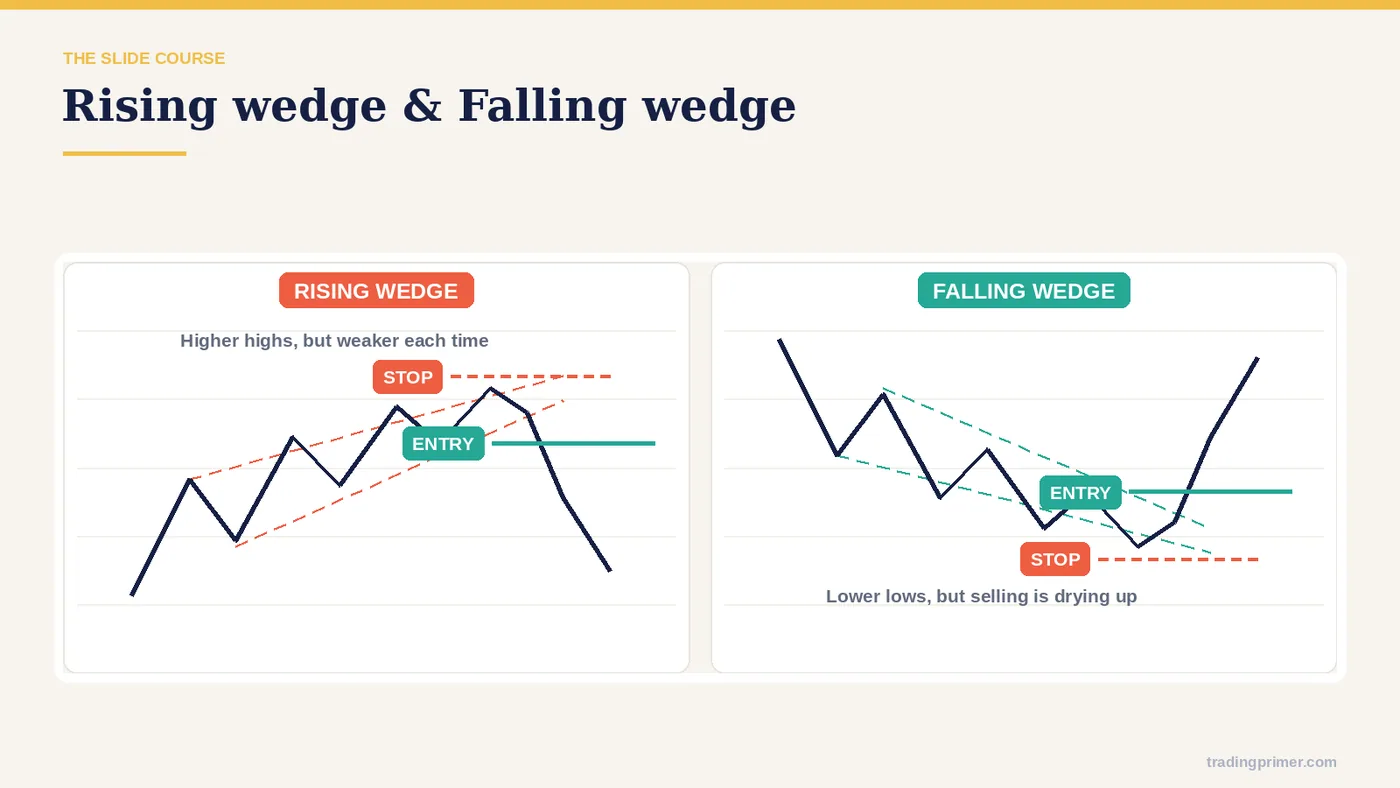
Trend reversal patterns — Falling Wedge. Rising Wedge.
Slide 14 of 62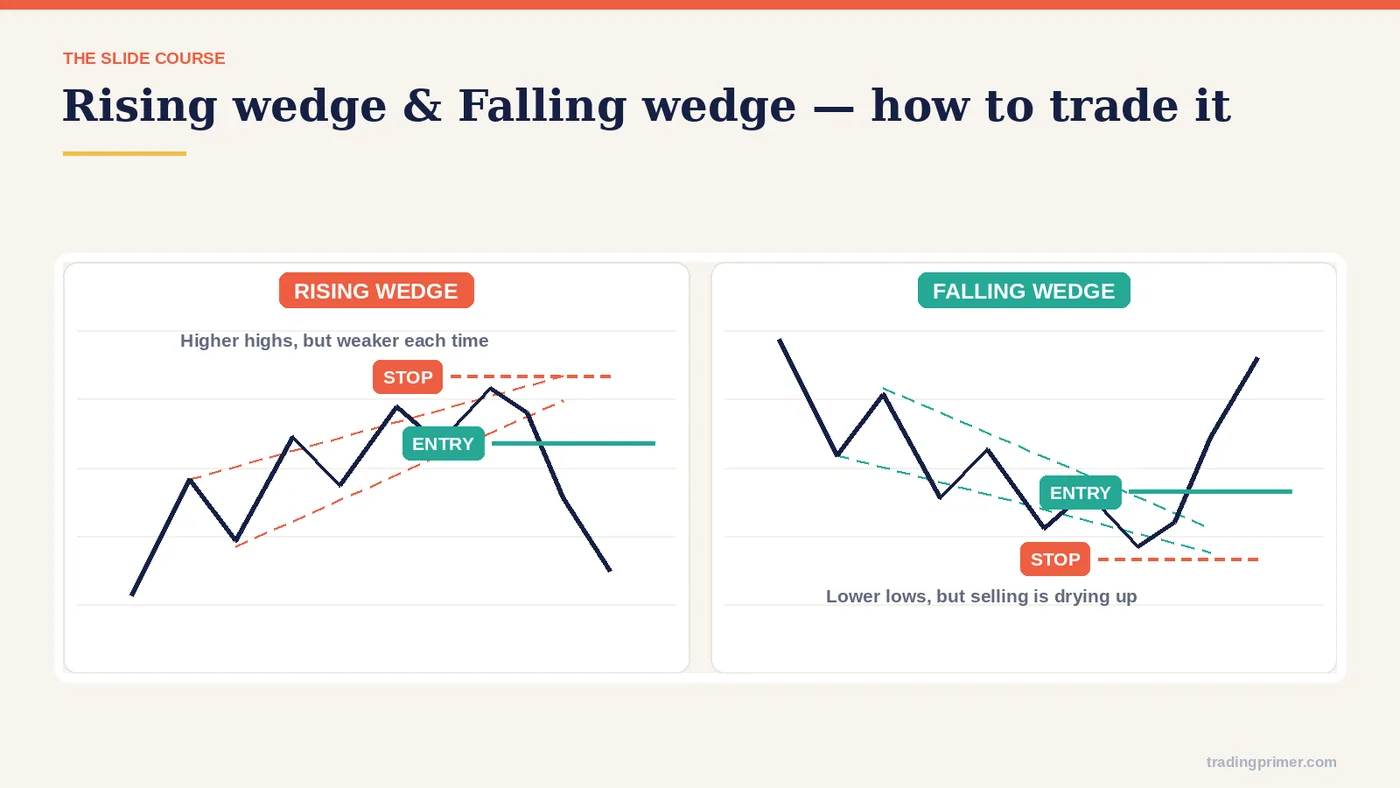
How to trade the pattern — The entry rule is on the chart itself: the course marks where the entry sits, where the stop goes, and what the pattern has to do before the trade is valid. Read the markings before moving on.
Slide 15 of 62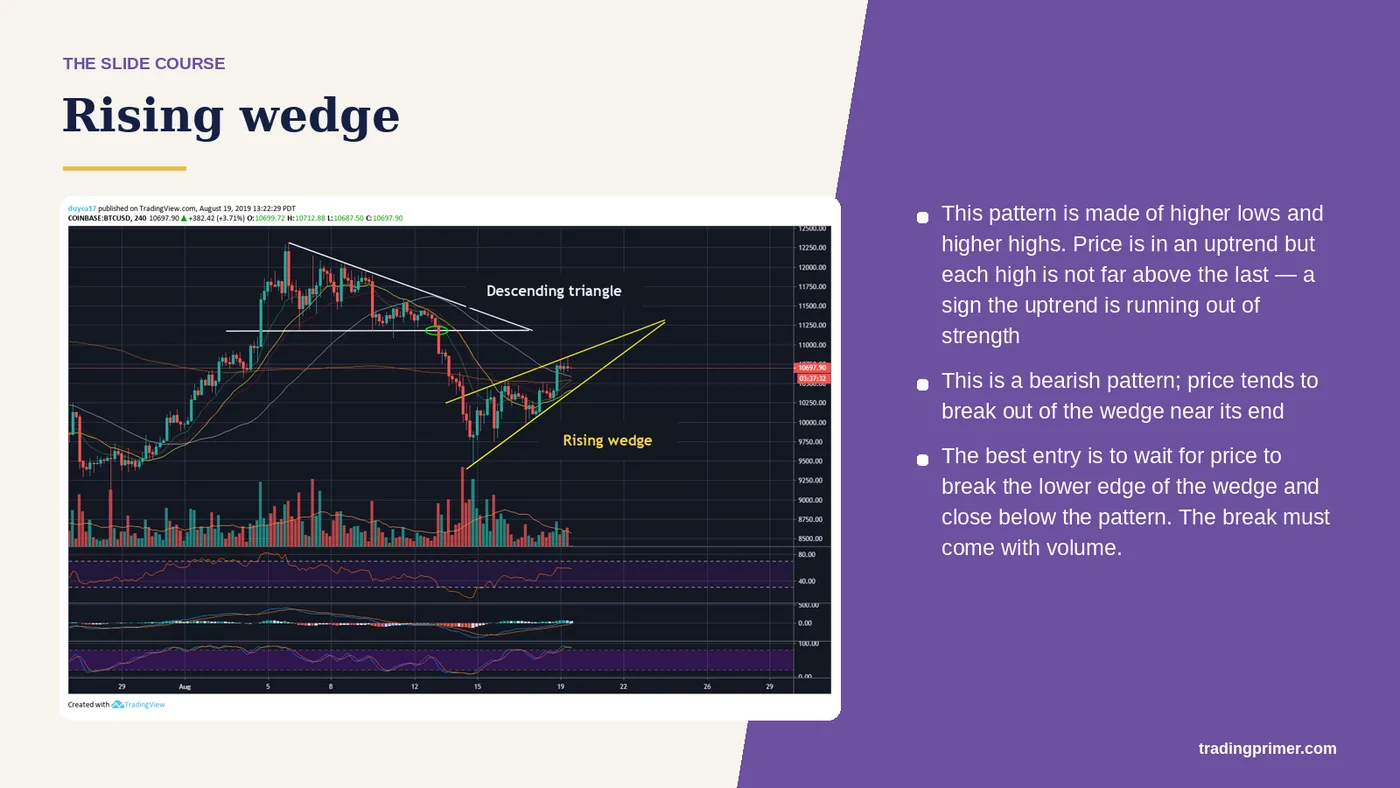
This pattern is made of higher lows and higher highs. Price is in an uptrend but each high is not far above the last — a sign the uptrend is running out of strength — This is a bearish pattern; price tends to break out of the wedge near its end. The best entry is to wait for price to break the lower edge of the wedge and close below the pattern. The break must come with volume. Rising wedge.
Slide 16 of 62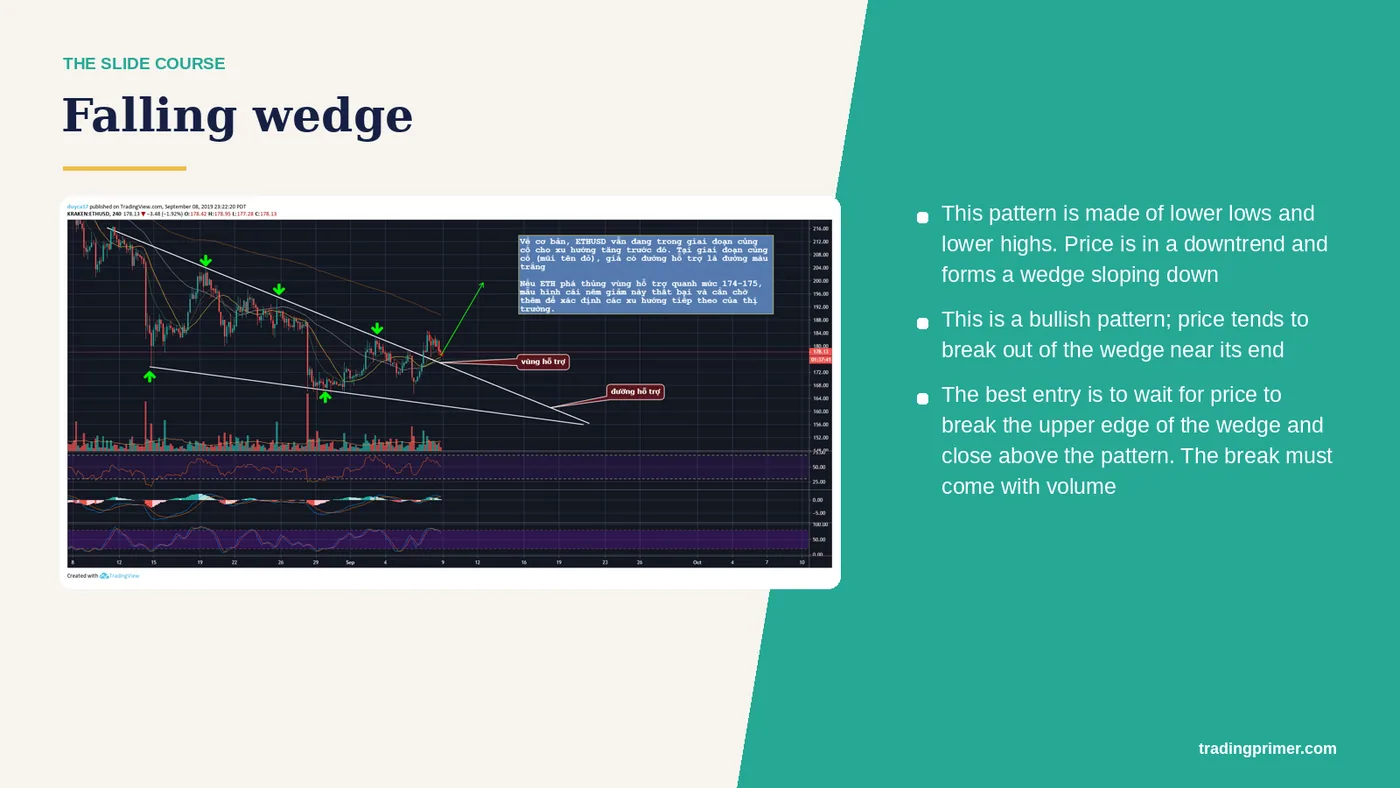
This pattern is made of lower lows and lower highs. Price is in a downtrend and forms a wedge sloping down — This is a bullish pattern; price tends to break out of the wedge near its end. The best entry is to wait for price to break the upper edge of the wedge and close above the pattern. The break must come with volume. Falling wedge.
Slide 17 of 62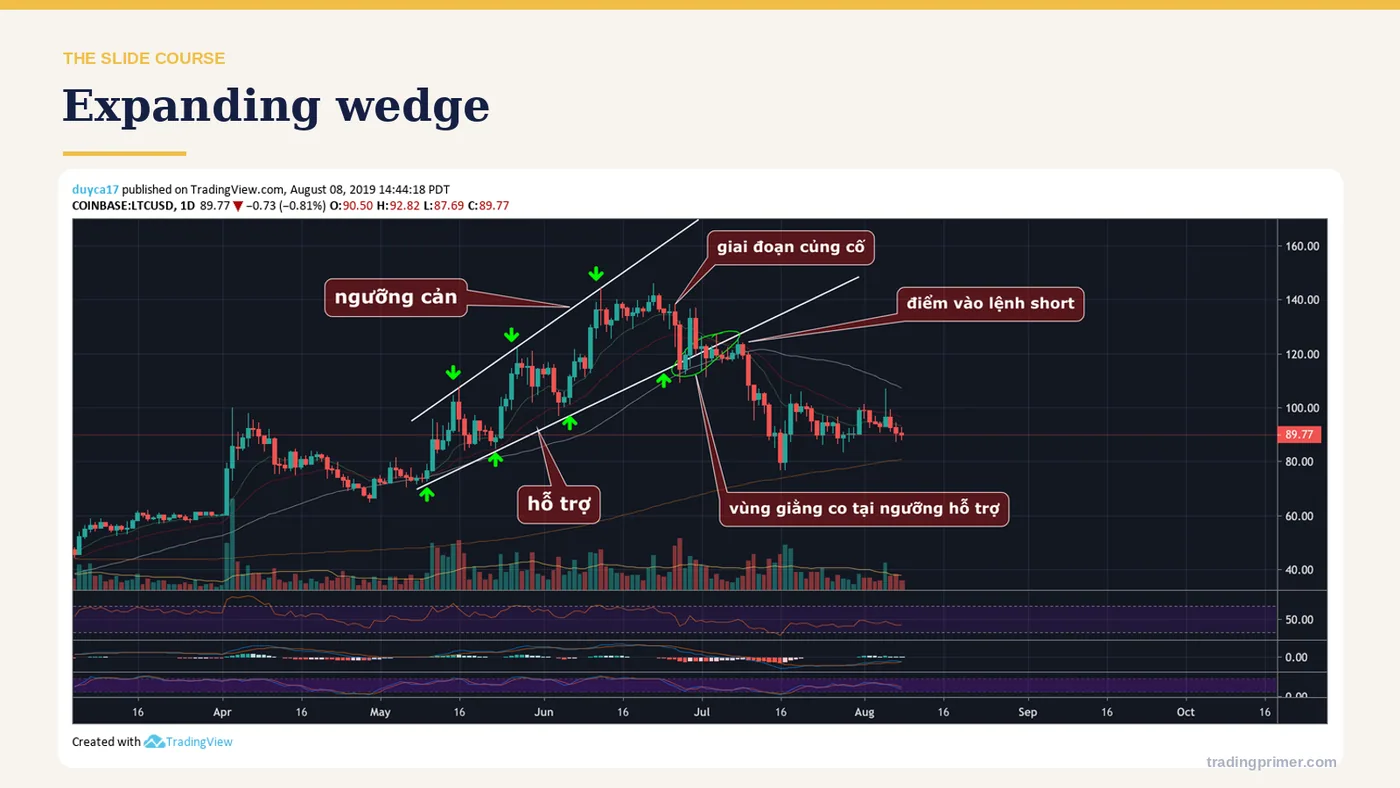
Expanding wedge — The shape is drawn on the chart with the levels that define it. What matters is where it forms and what price does at the boundary, not the name.
Slide 18 of 62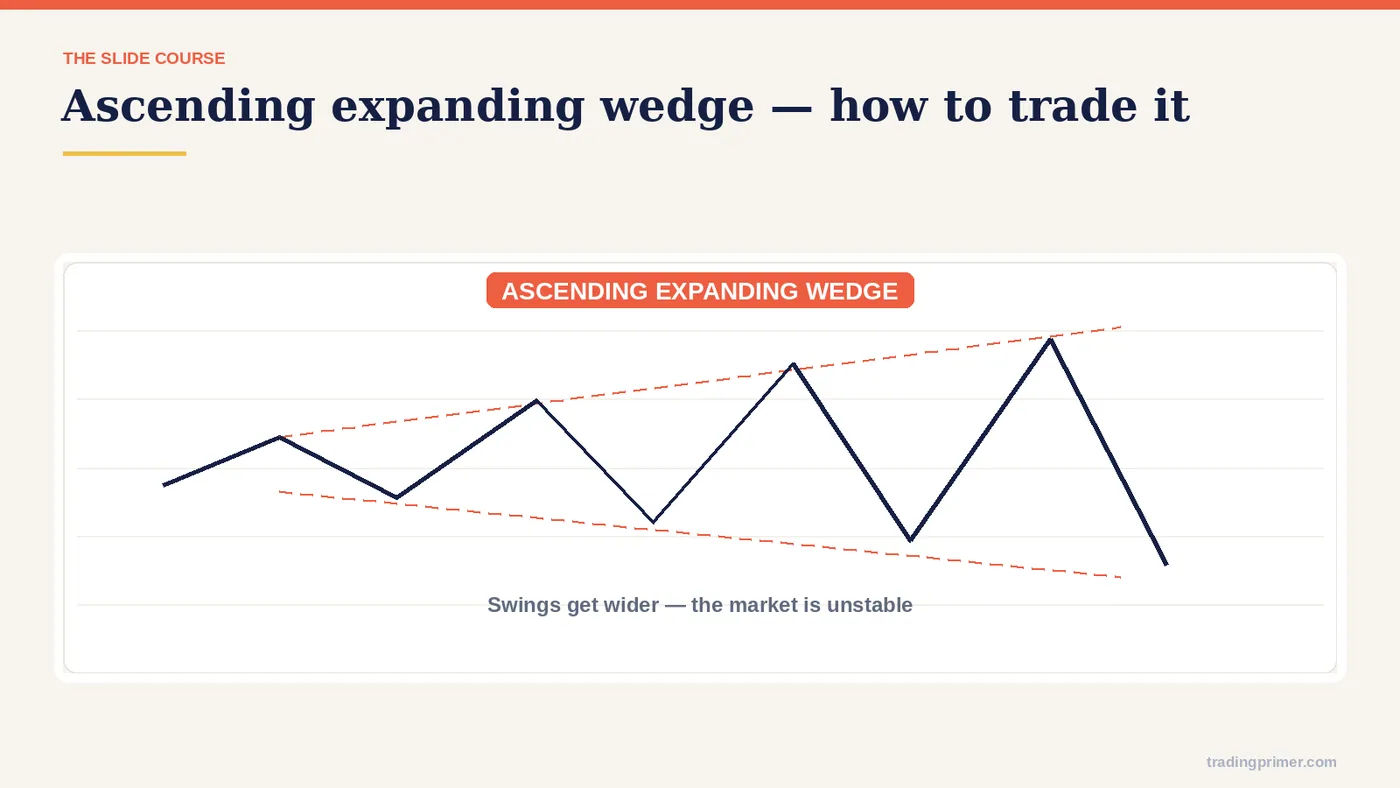
How to trade the pattern — The entry rule is on the chart itself: the course marks where the entry sits, where the stop goes, and what the pattern has to do before the trade is valid. Read the markings before moving on.
Slide 19 of 62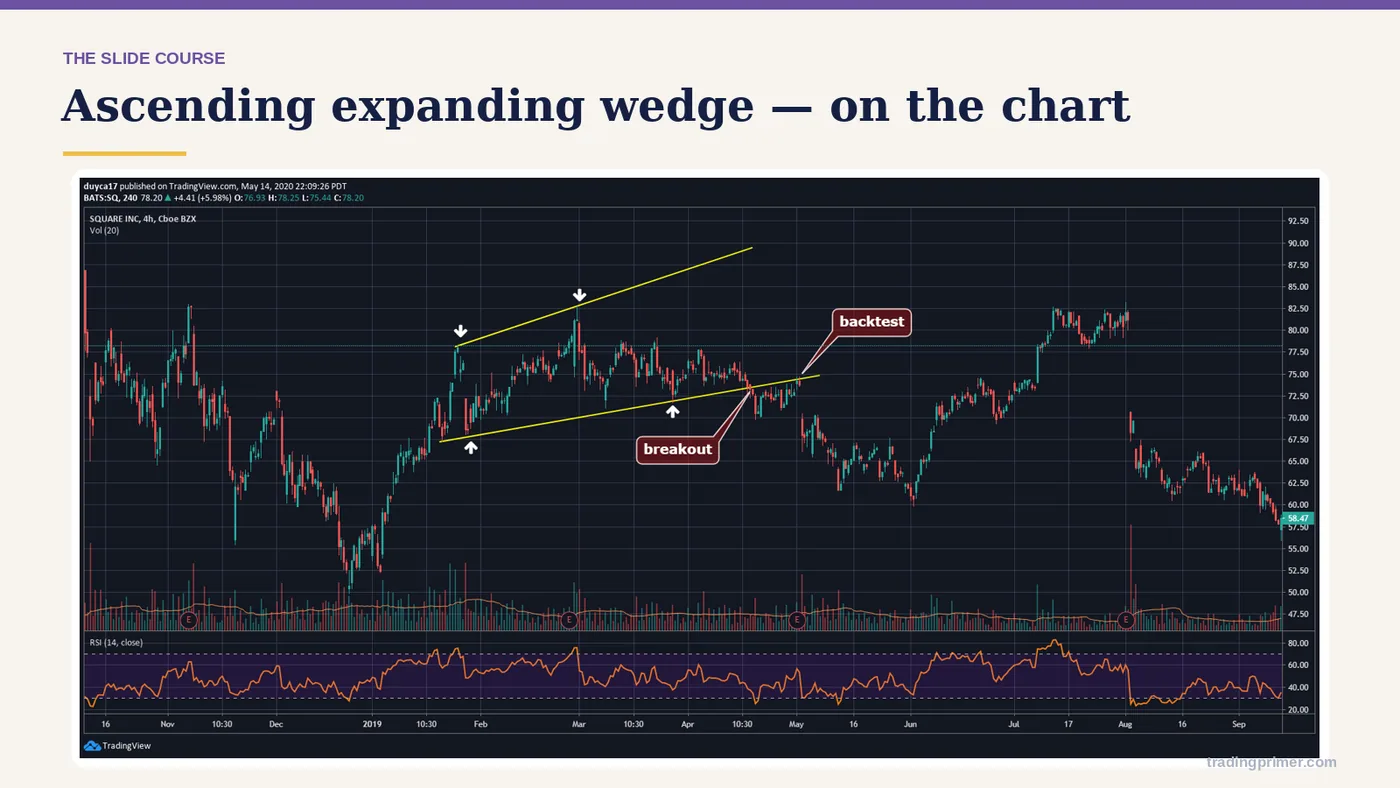
Expanding wedge — a chart from the course deck. The markings on it are the lesson; read them left to right.
Slide 20 of 62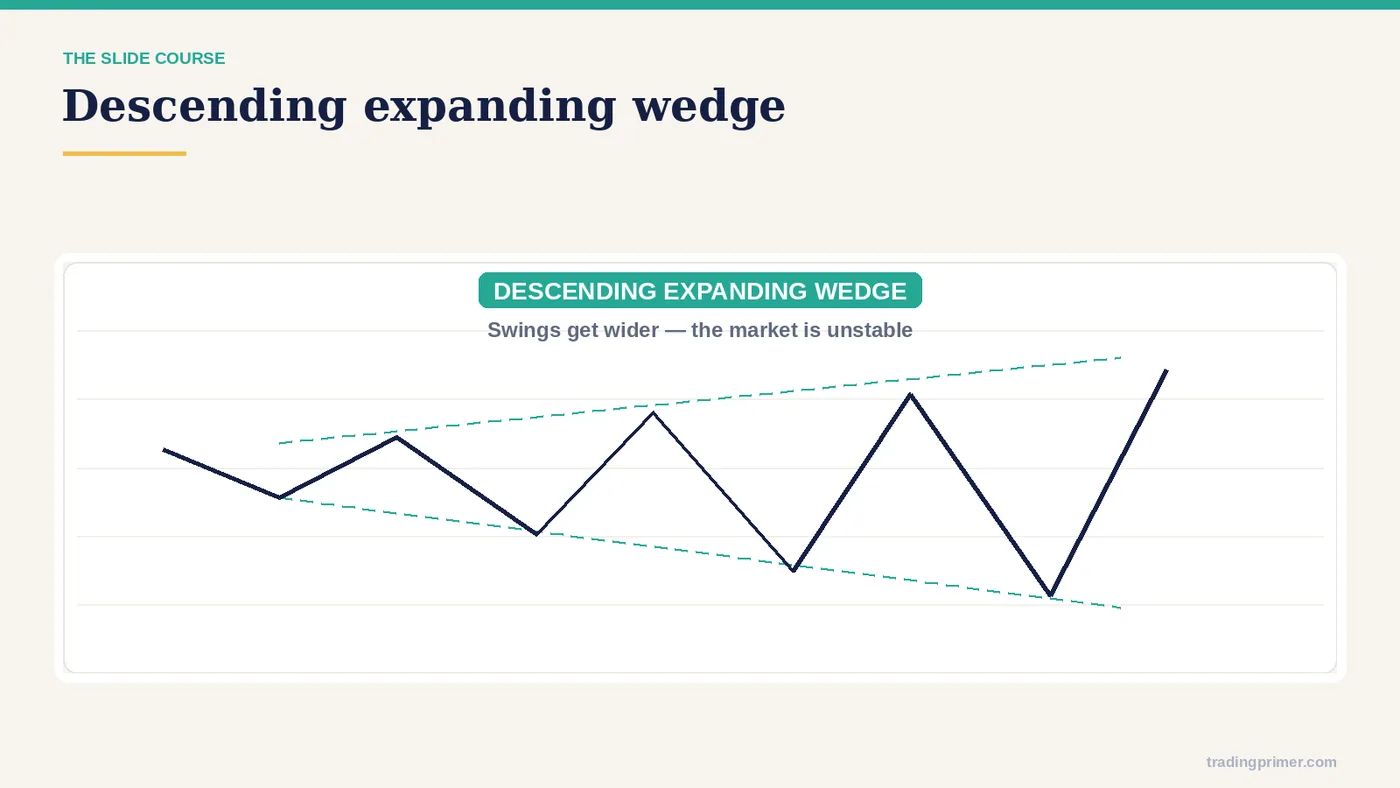
Expanding wedge — a chart from the course deck. The markings on it are the lesson; read them left to right.
Slide 21 of 62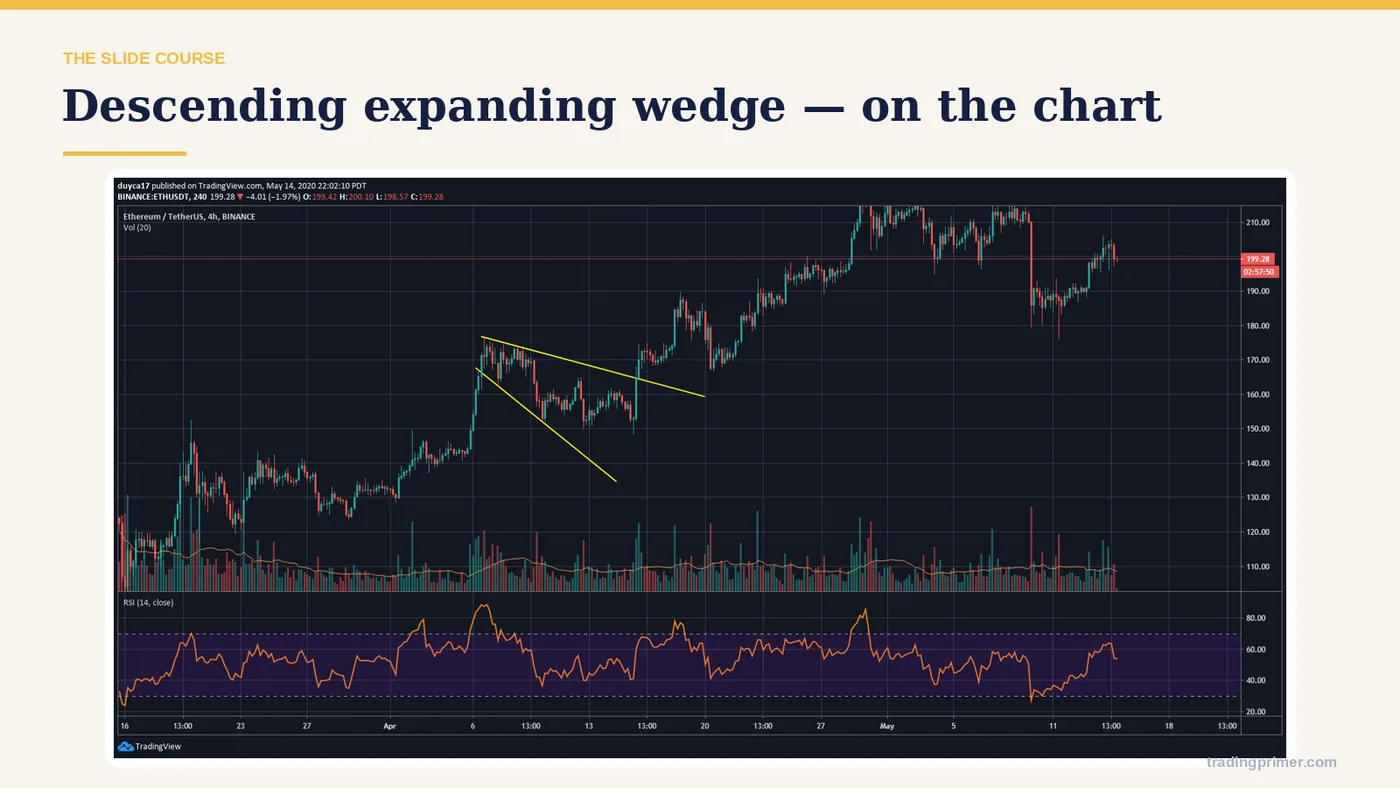
Expanding wedge — a chart from the course deck. The markings on it are the lesson; read them left to right.
Slide 22 of 62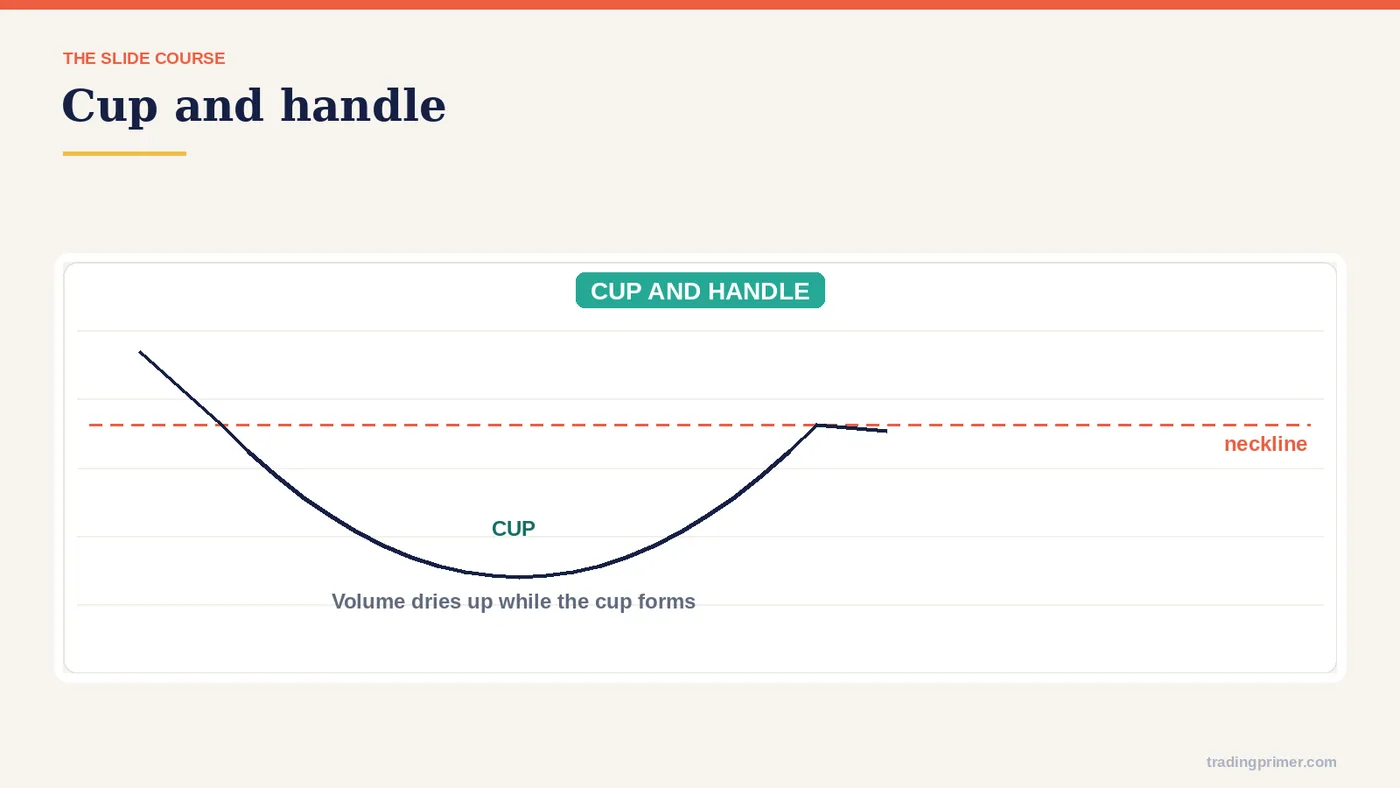
Trend reversal patterns (cont.) — Cup & Handle.
Slide 23 of 62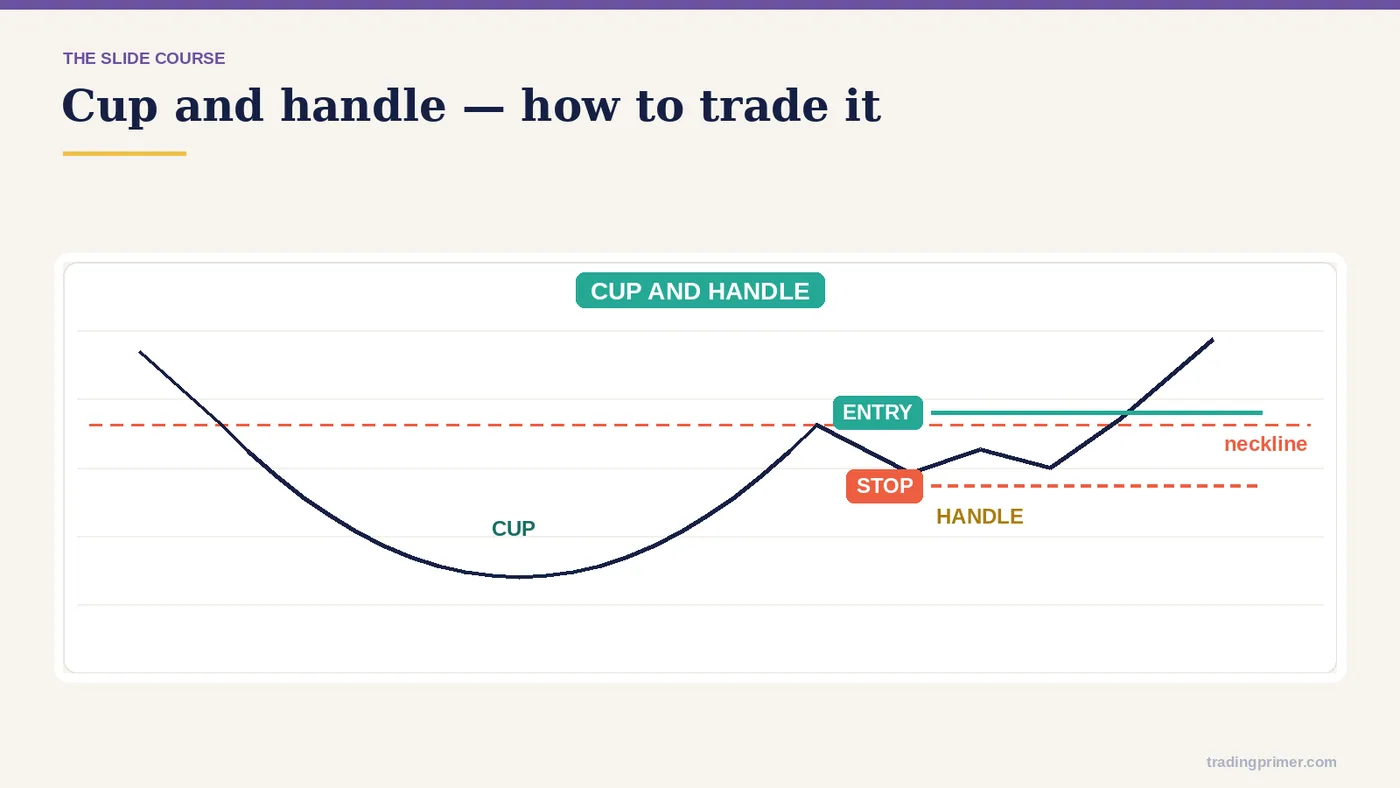
How to trade the pattern — The entry rule is on the chart itself: the course marks where the entry sits, where the stop goes, and what the pattern has to do before the trade is valid. Read the markings before moving on.
Slide 24 of 62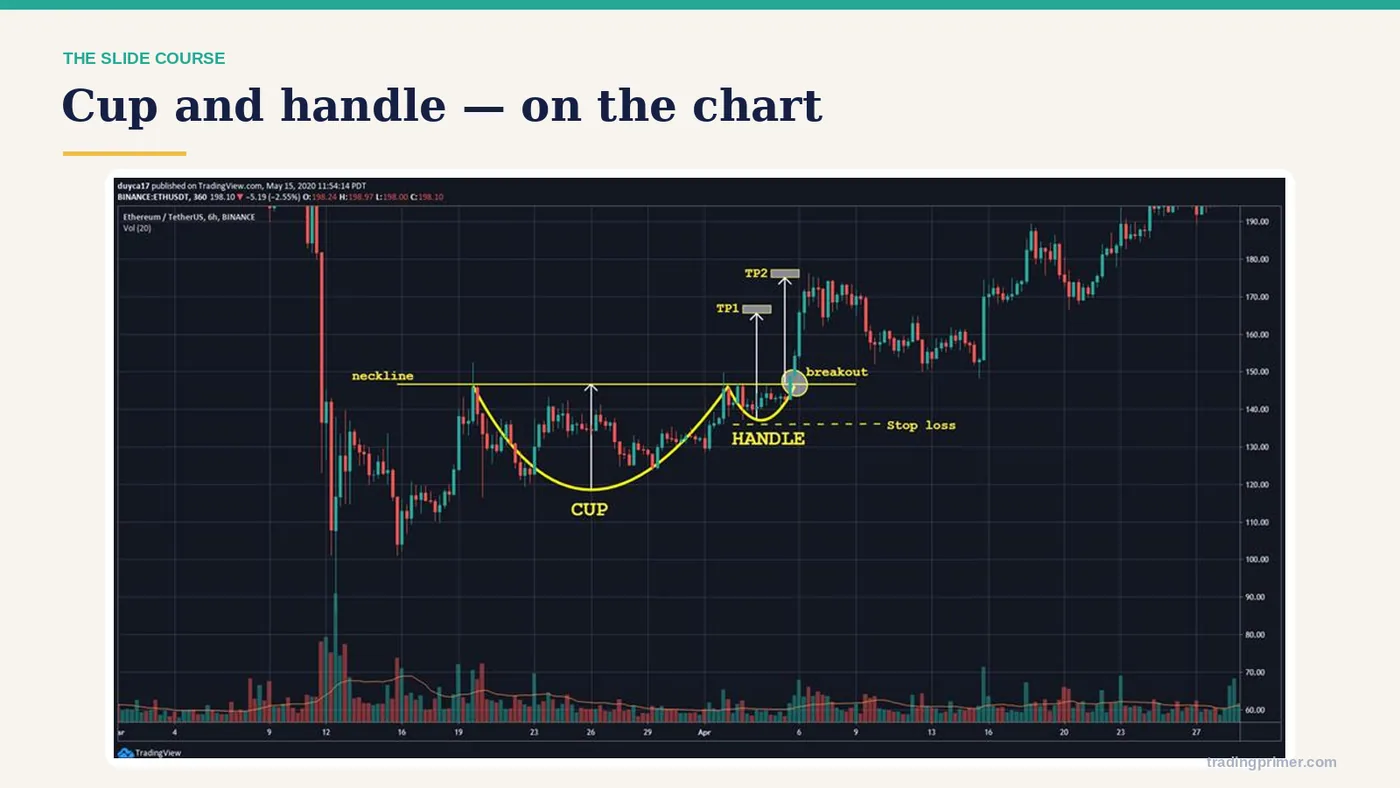
Trend reversal patterns (cont.) — a chart from the course deck. The markings on it are the lesson; read them left to right.
Slide 25 of 62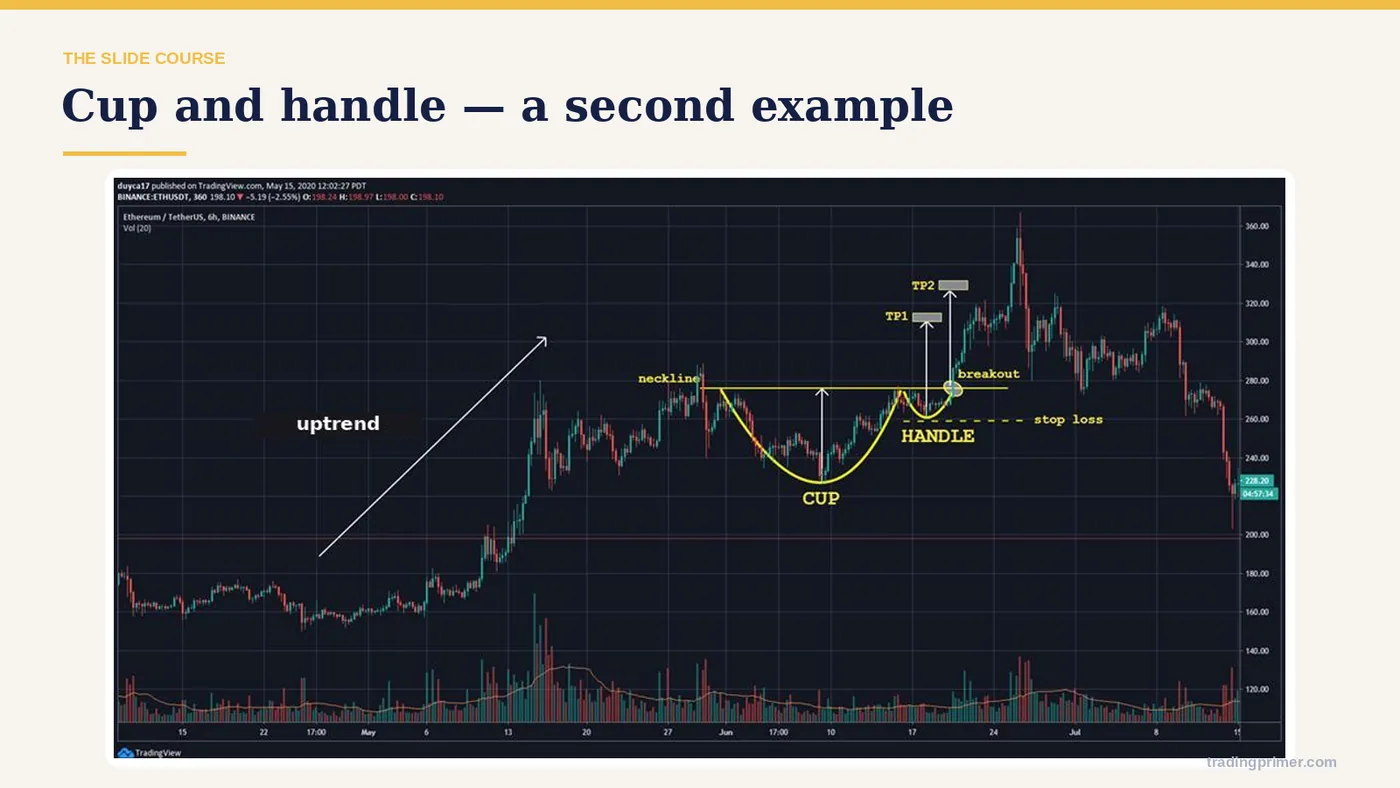
Trend reversal patterns (cont.) — a chart from the course deck. The markings on it are the lesson; read them left to right.
Slide 26 of 62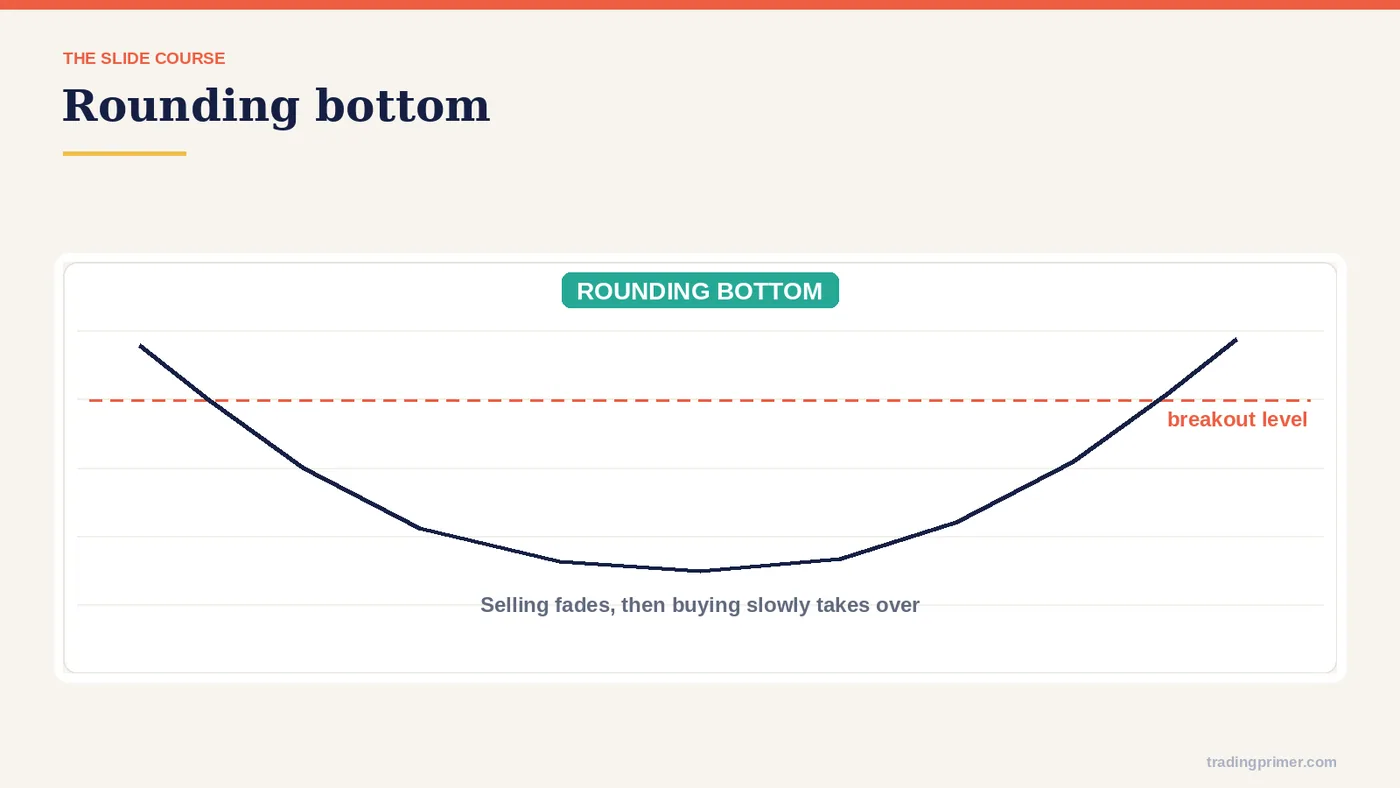
Trend reversal patterns (cont.) — a chart from the course deck. The markings on it are the lesson; read them left to right.
Slide 27 of 62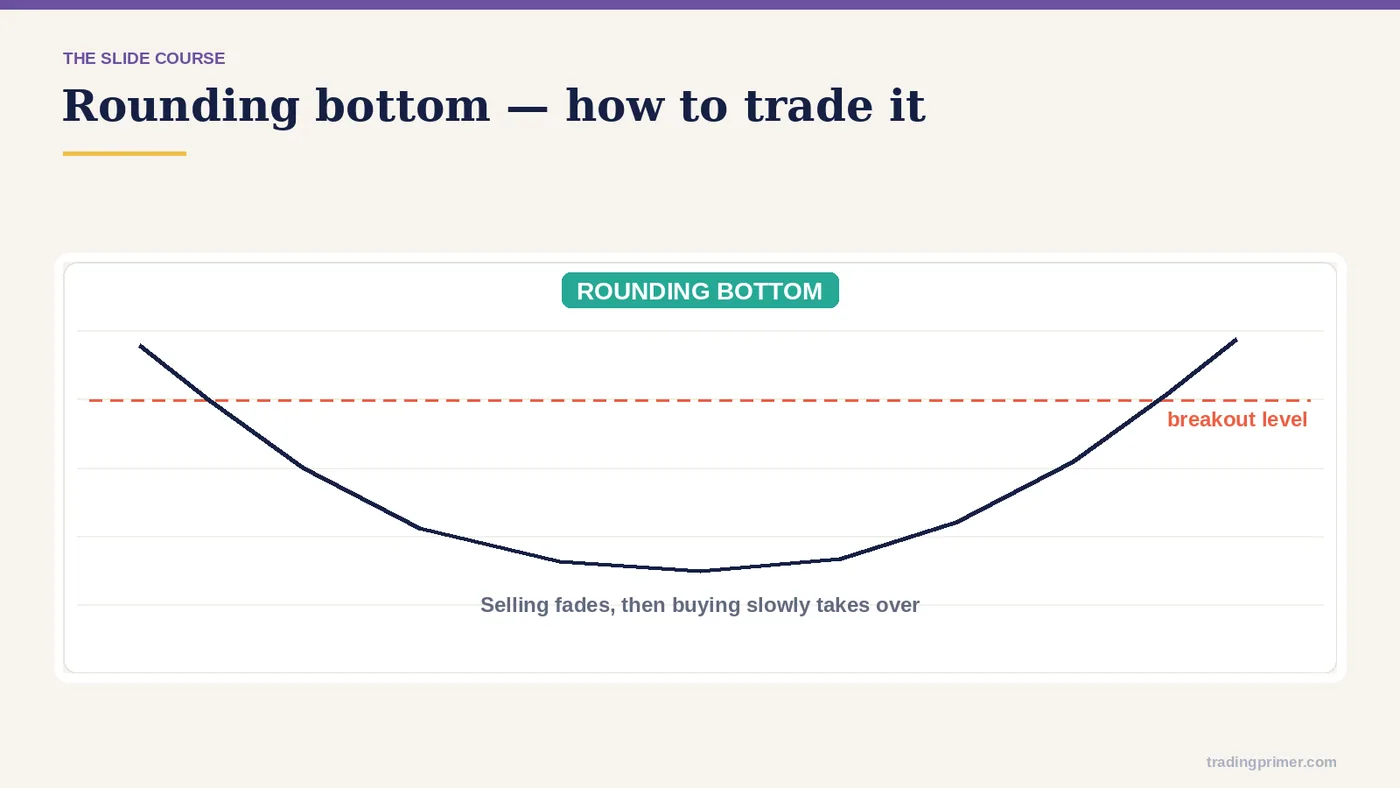
How to trade the pattern — The entry rule is on the chart itself: the course marks where the entry sits, where the stop goes, and what the pattern has to do before the trade is valid. Read the markings before moving on.
Slide 28 of 62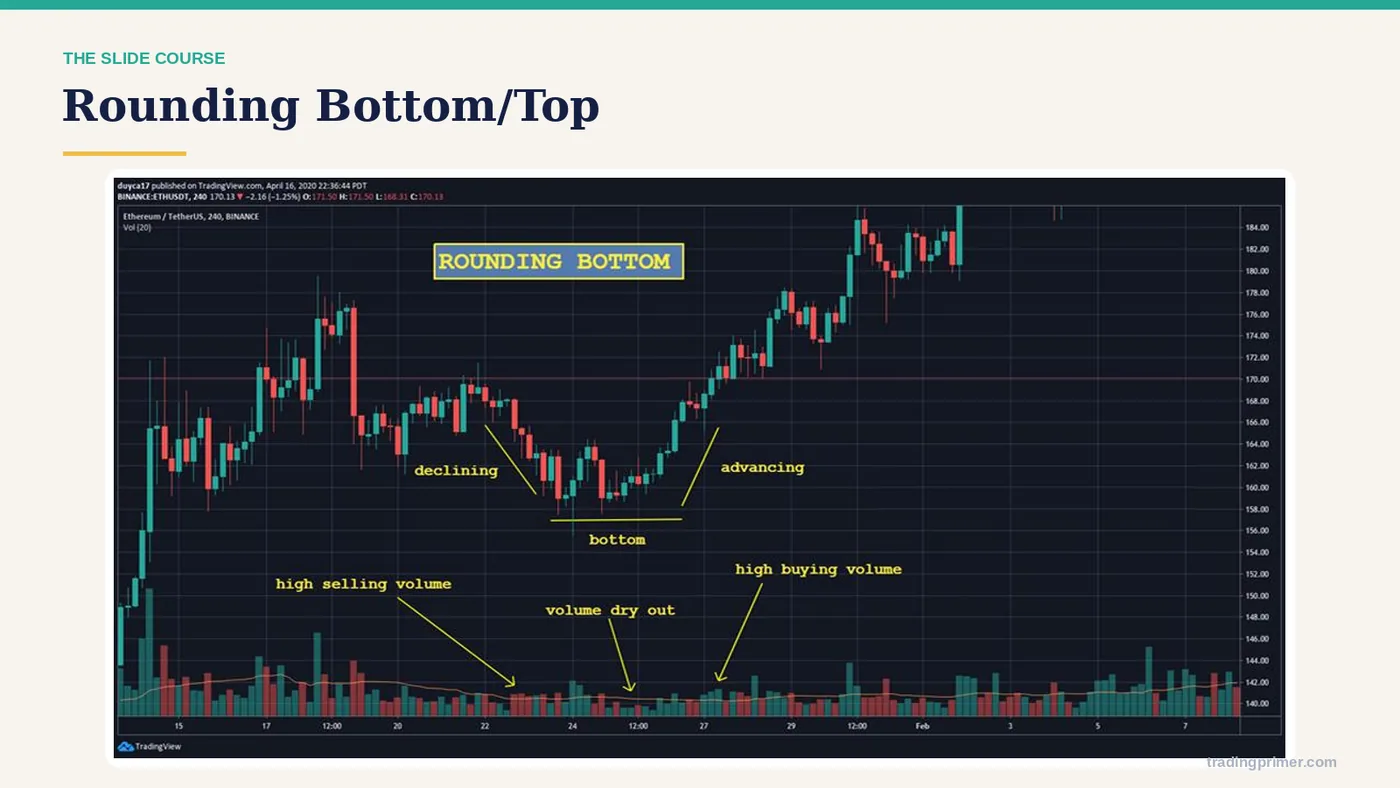
Rounding Bottom/Top — The shape is drawn on the chart with the levels that define it. What matters is where it forms and what price does at the boundary, not the name.
Slide 29 of 62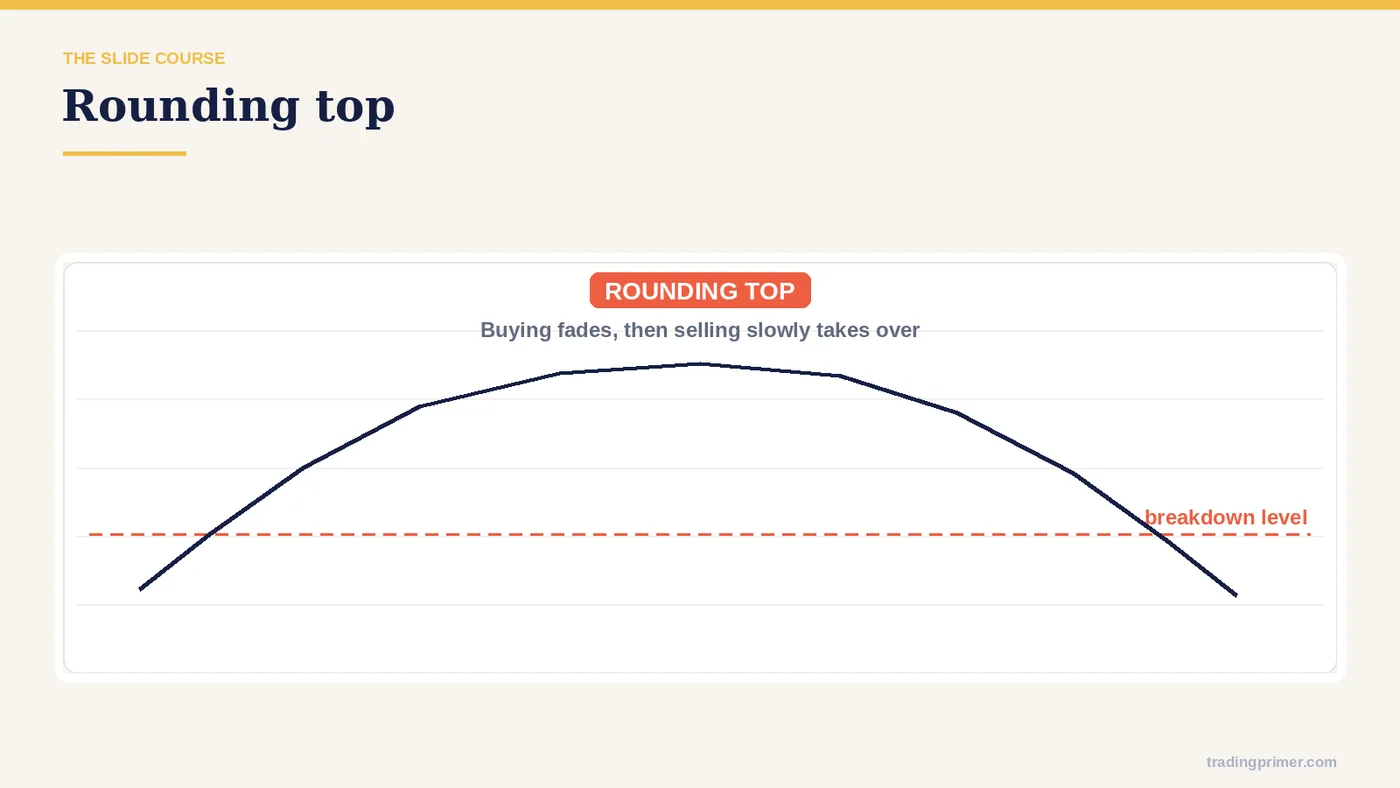
Rounding Bottom/Top — a chart from the course deck. The markings on it are the lesson; read them left to right.
Slide 30 of 62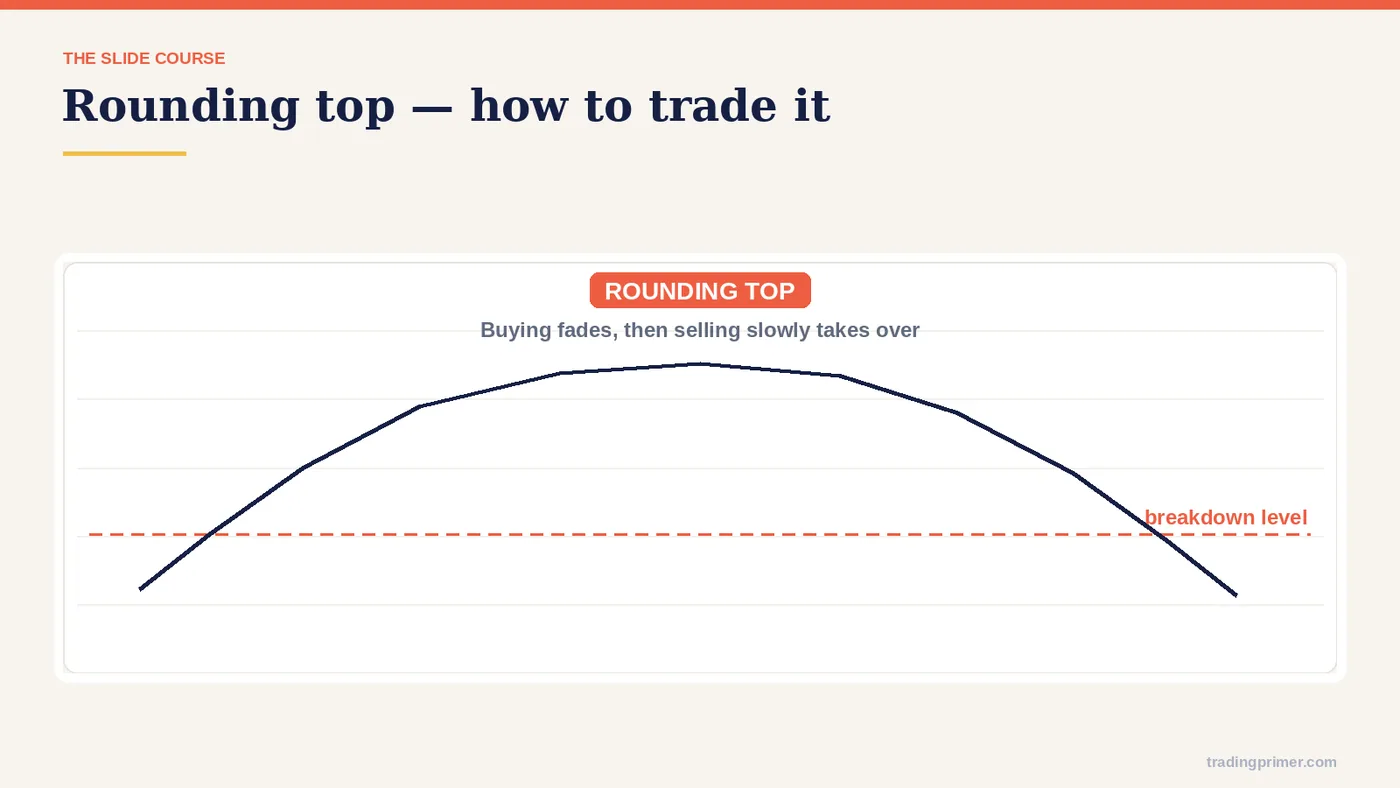
How to trade the pattern — The entry rule is on the chart itself: the course marks where the entry sits, where the stop goes, and what the pattern has to do before the trade is valid. Read the markings before moving on.
Slide 31 of 62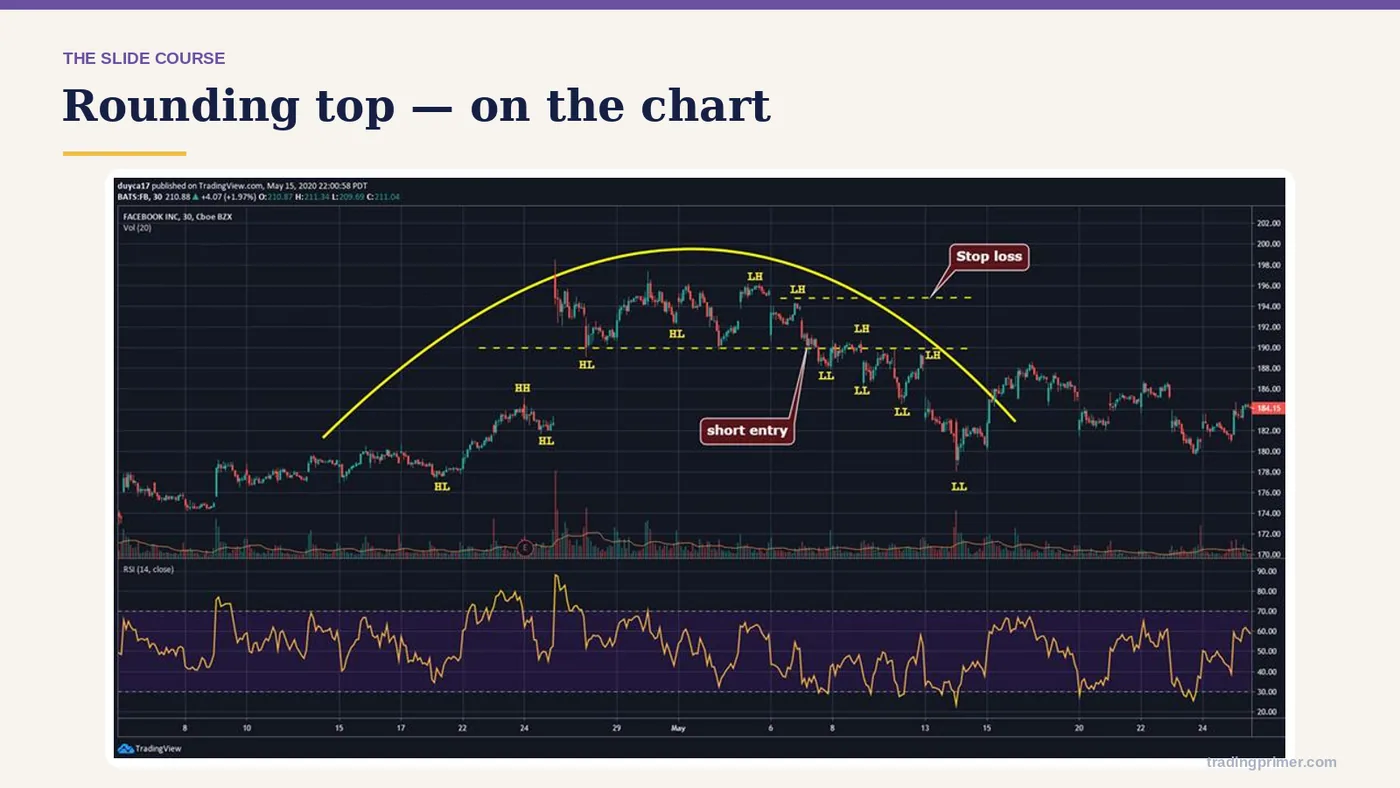
Rounding Bottom/Top — a chart from the course deck. The markings on it are the lesson; read them left to right.
Slide 32 of 62 Tap to enlarge
Continuation patterns are pauses, not turns. The animation shows the anatomy they all share: a strong move (the pole), a controlled drift against it (the flag), and a breakout back in the old direction. The first target is the height of the pole projected from the break.
Slide 33 of 62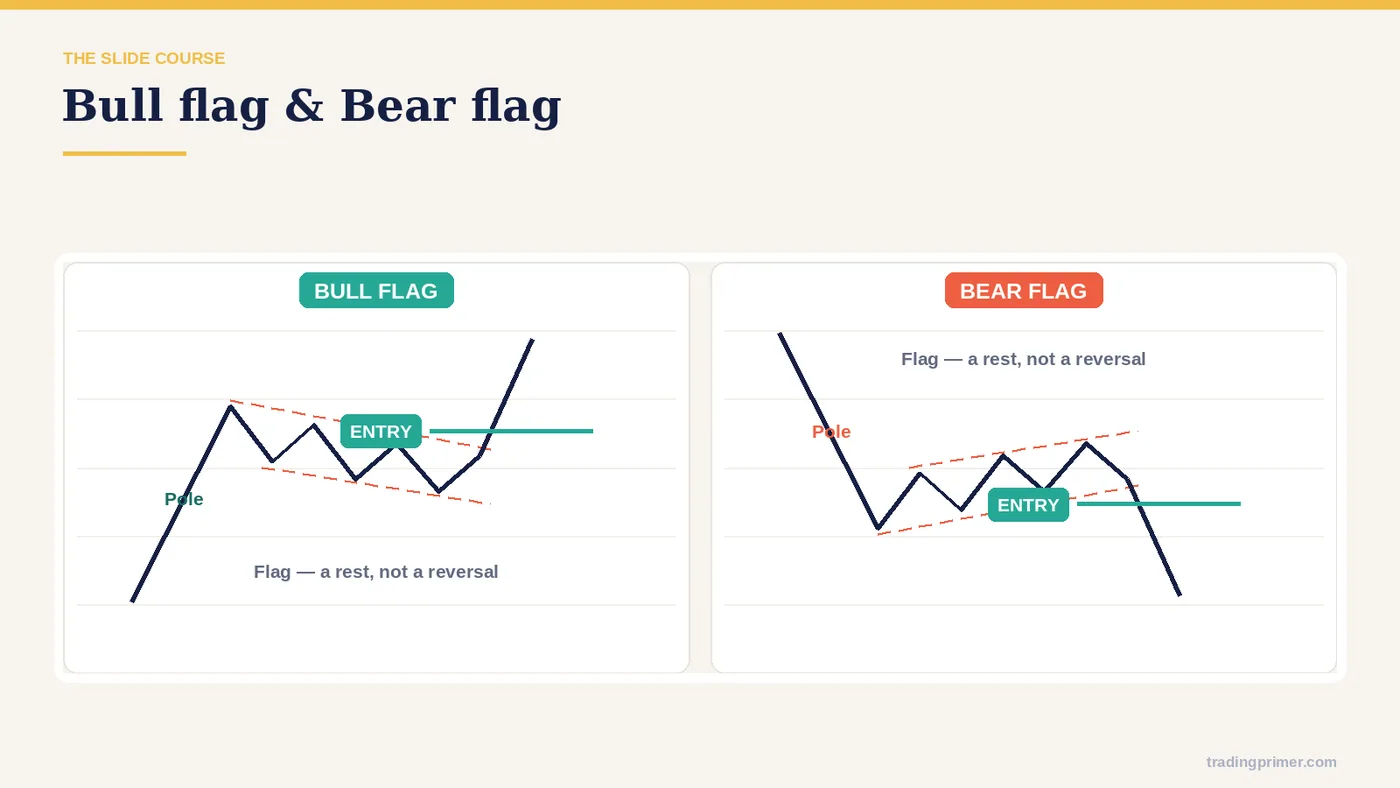
Bull Flag & Bear Flag — The shape is drawn on the chart with the levels that define it. What matters is where it forms and what price does at the boundary, not the name.
Slide 34 of 62
How the course trades a flag. Entry on the close outside the flag channel in the direction of the pole, stop on the far side of the flag, first target the pole's height projected from the break. The next slides walk the same rules on real charts.
Slide 35 of 62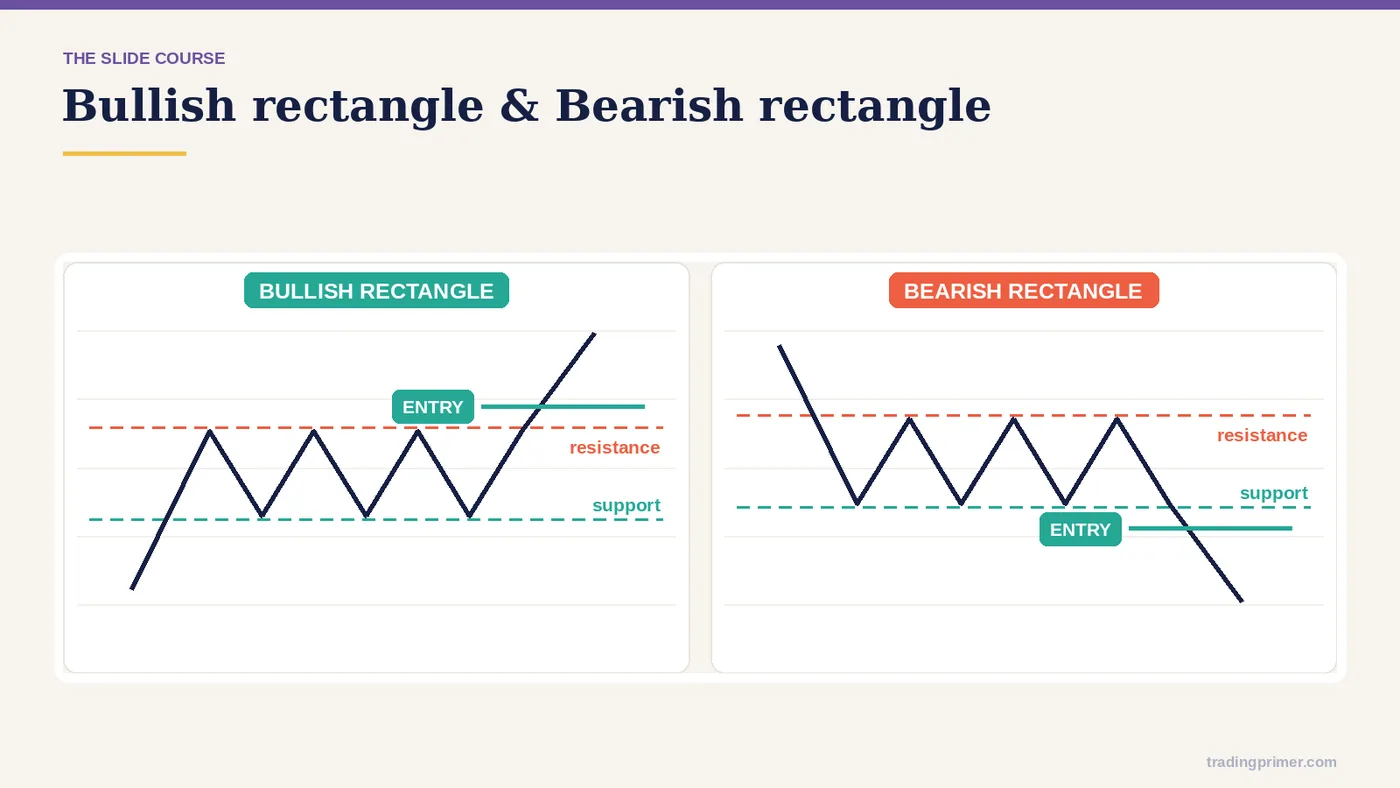
Bullish Rectangle & — Bearish Rectangle.
Slide 36 of 62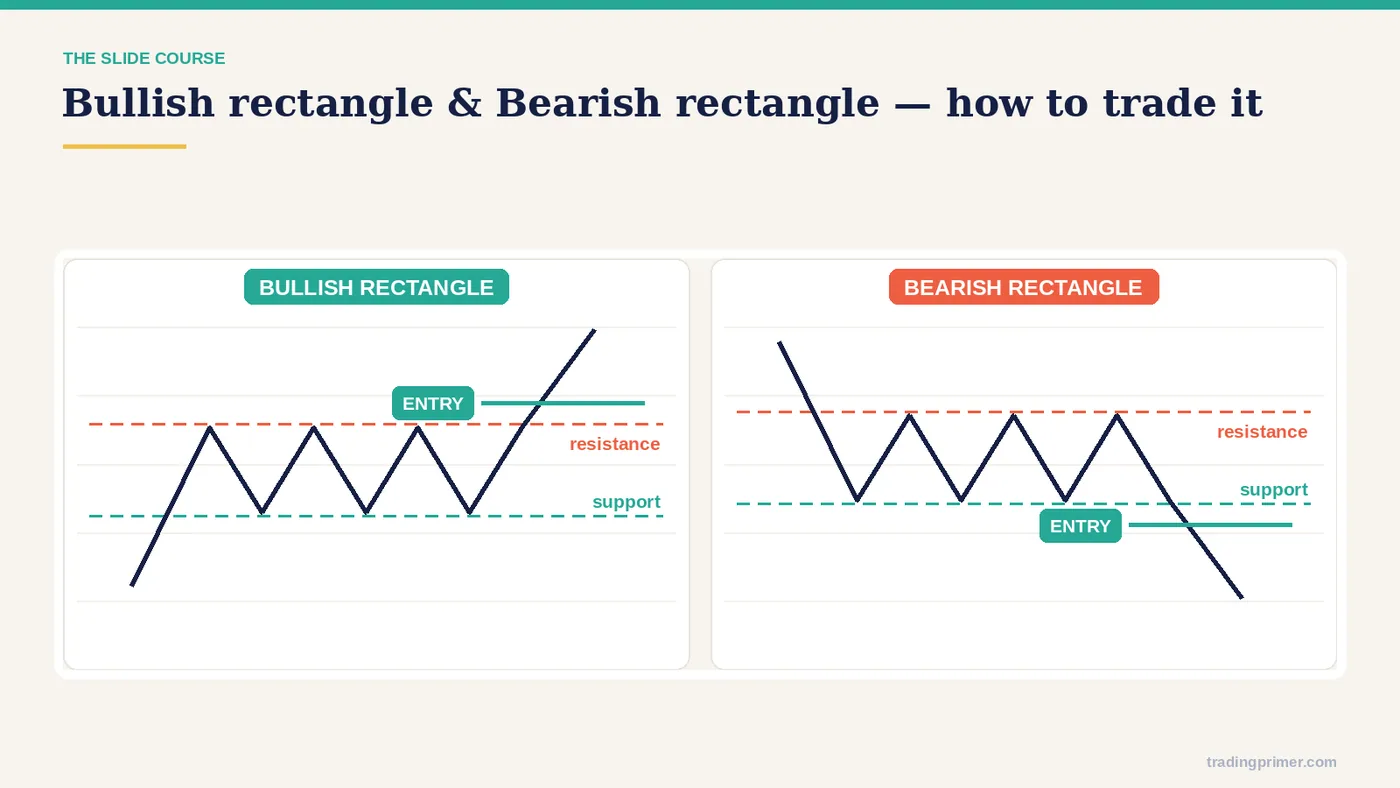
How to trade the pattern — The entry rule is on the chart itself: the course marks where the entry sits, where the stop goes, and what the pattern has to do before the trade is valid. Read the markings before moving on.
Slide 37 of 62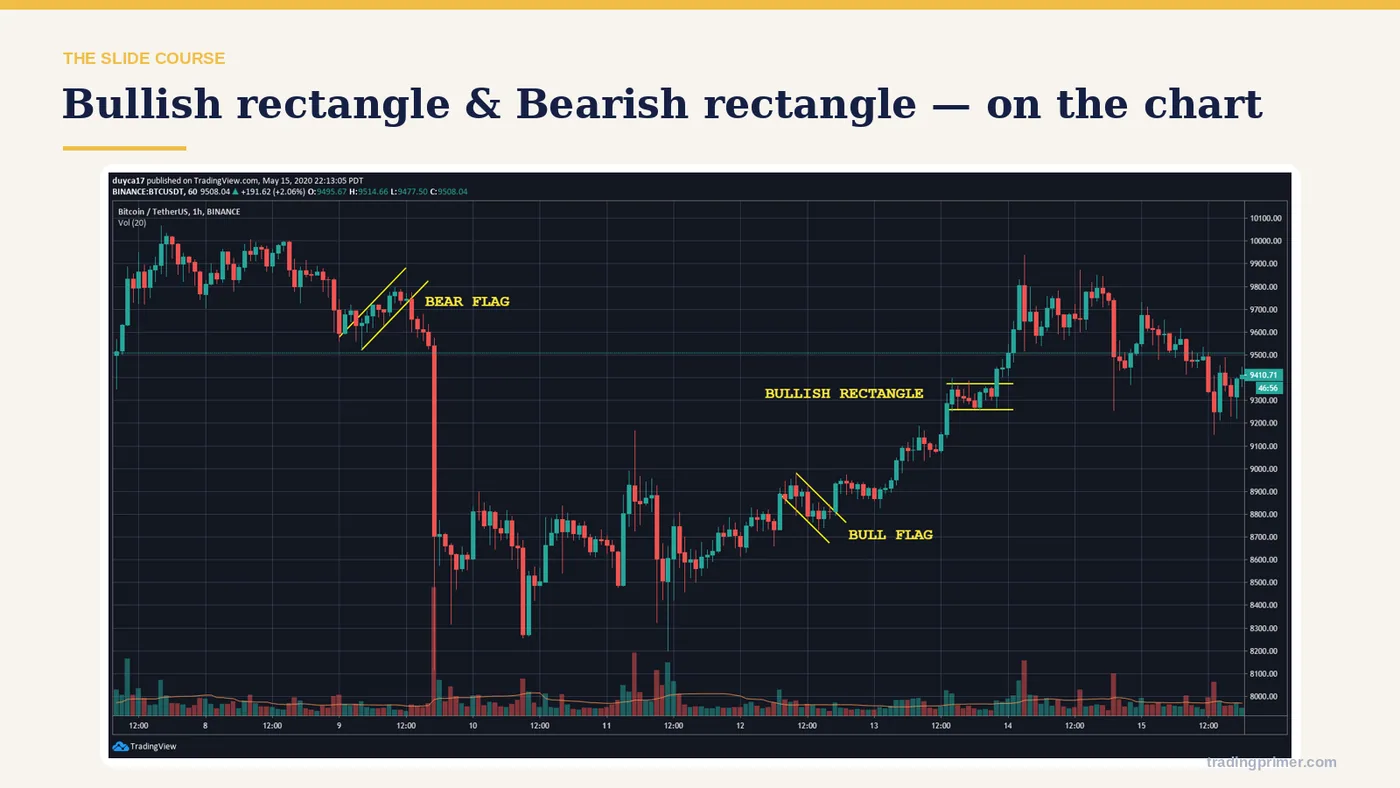
Bullish Rectangle & Bearish Rectangle — a chart from the course deck. The markings on it are the lesson; read them left to right.
Slide 38 of 62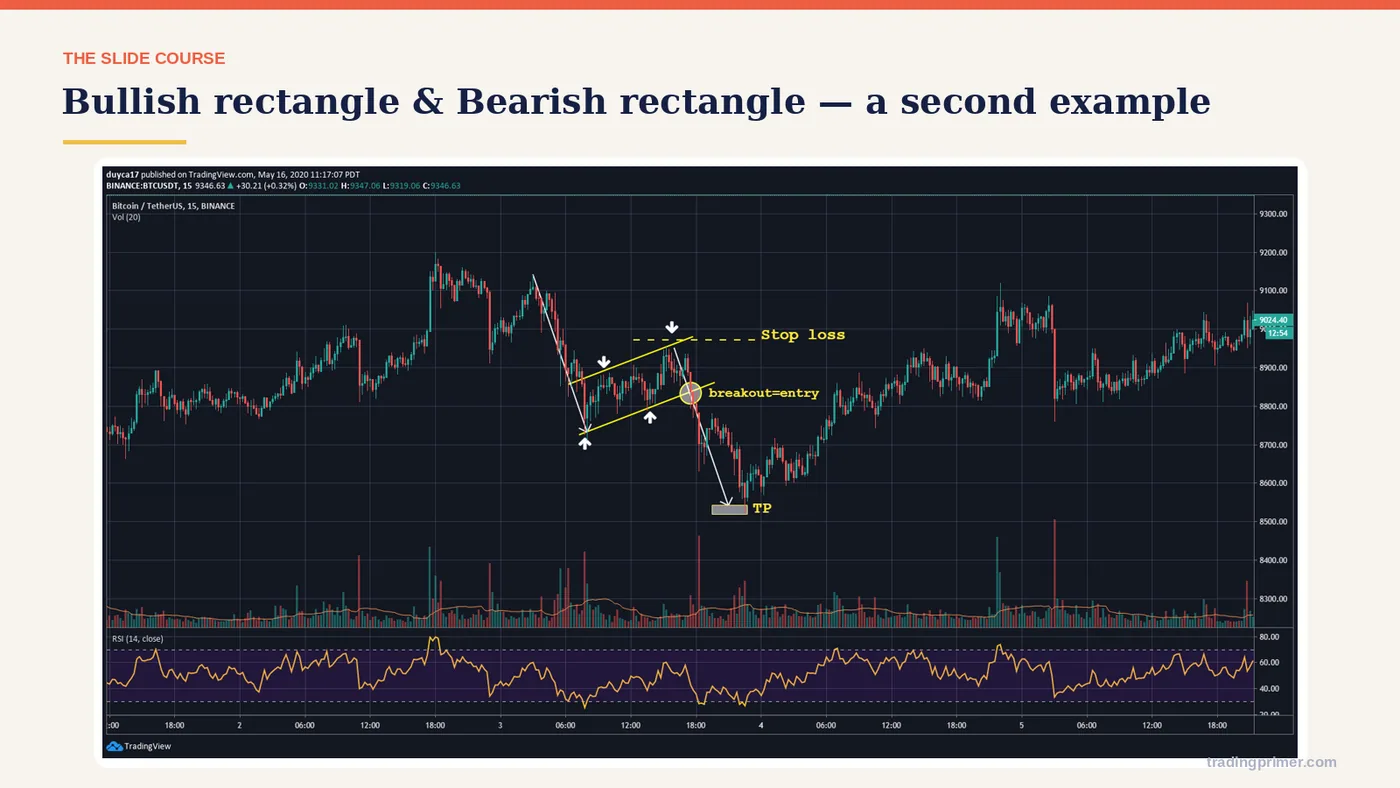
Bullish Rectangle & Bearish Rectangle — a chart from the course deck. The markings on it are the lesson; read them left to right.
Slide 39 of 62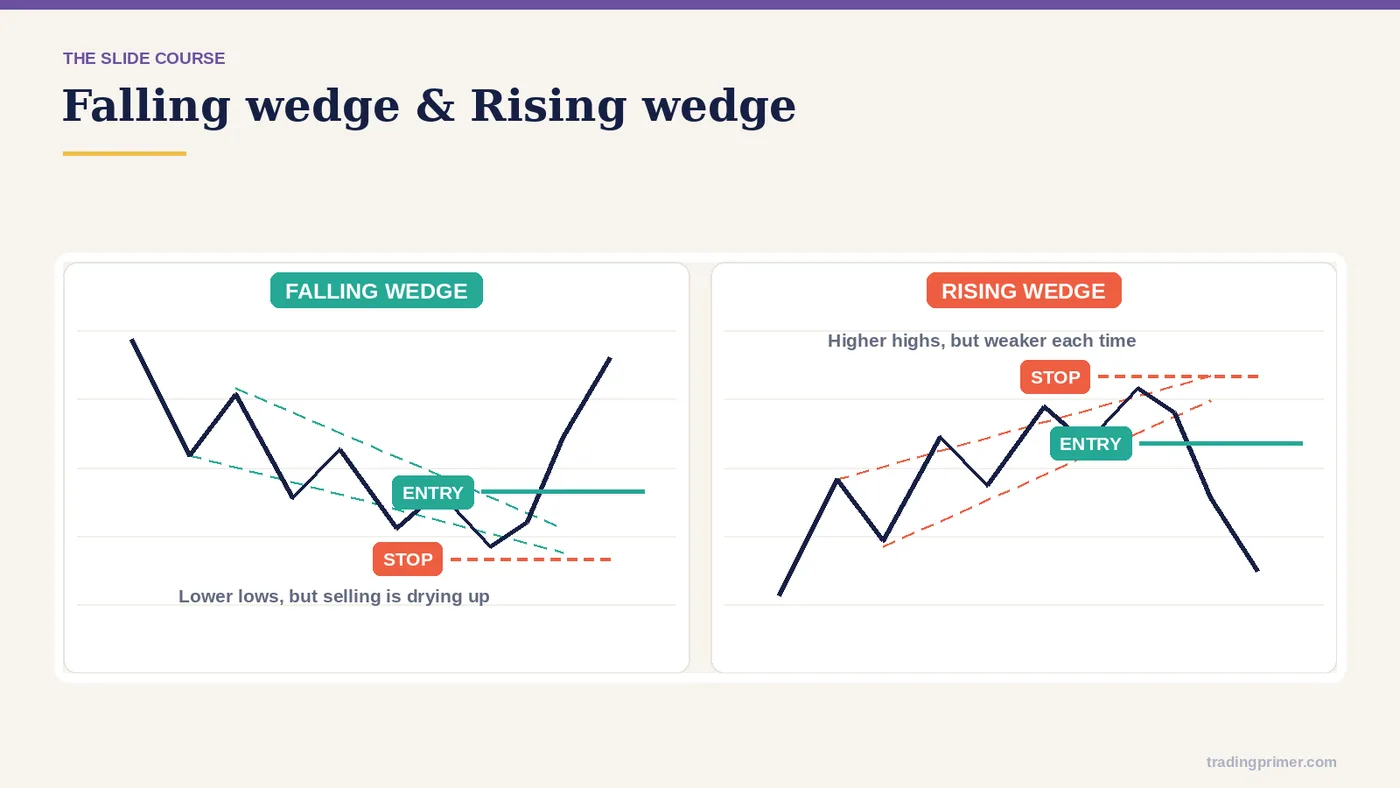
Falling Wedge & Rising Wedge — The shape is drawn on the chart with the levels that define it. What matters is where it forms and what price does at the boundary, not the name.
Slide 40 of 62
How to trade the pattern — The entry rule is on the chart itself: the course marks where the entry sits, where the stop goes, and what the pattern has to do before the trade is valid. Read the markings before moving on.
Slide 41 of 62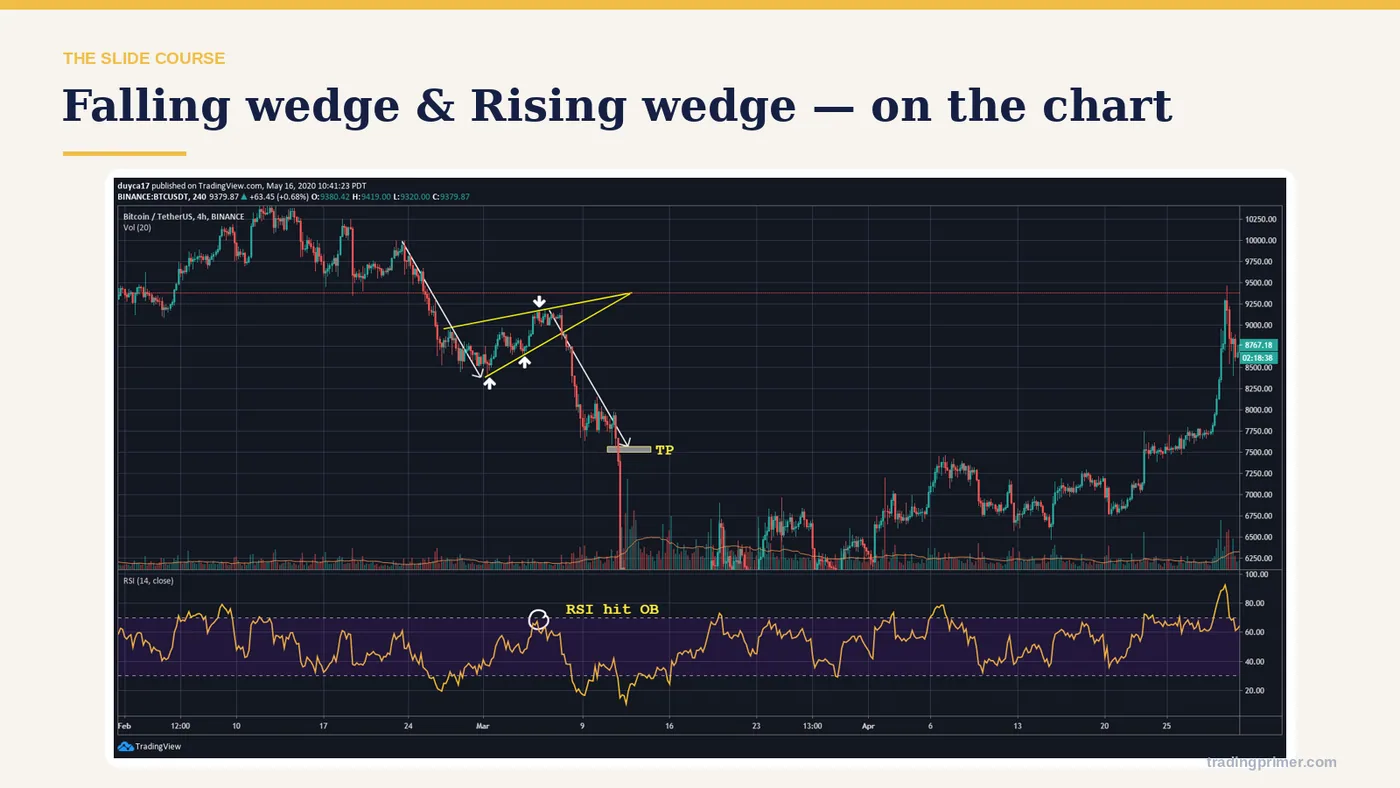
Falling Wedge & Rising Wedge — a chart from the course deck. The markings on it are the lesson; read them left to right.
Slide 42 of 62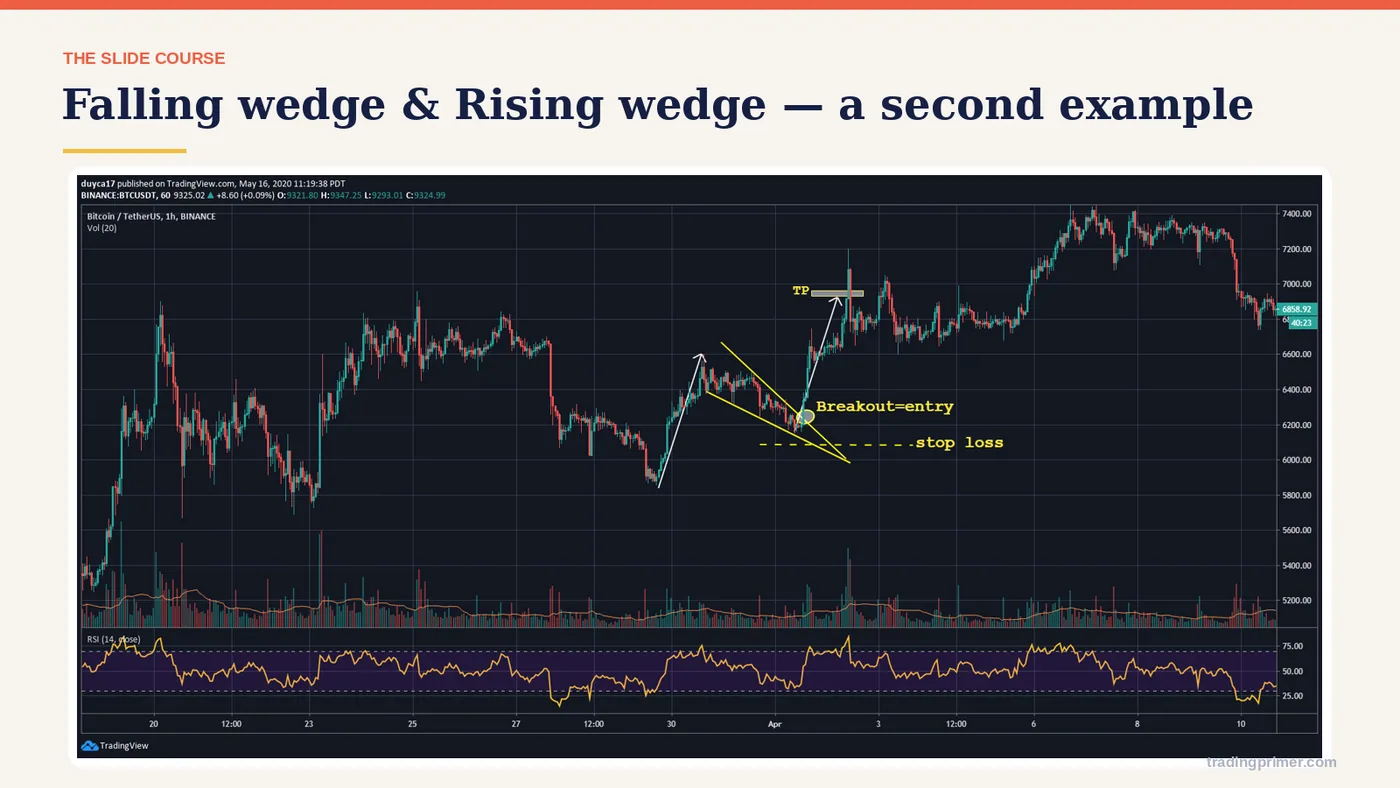
Falling Wedge & Rising Wedge — a chart from the course deck. The markings on it are the lesson; read them left to right.
Slide 43 of 62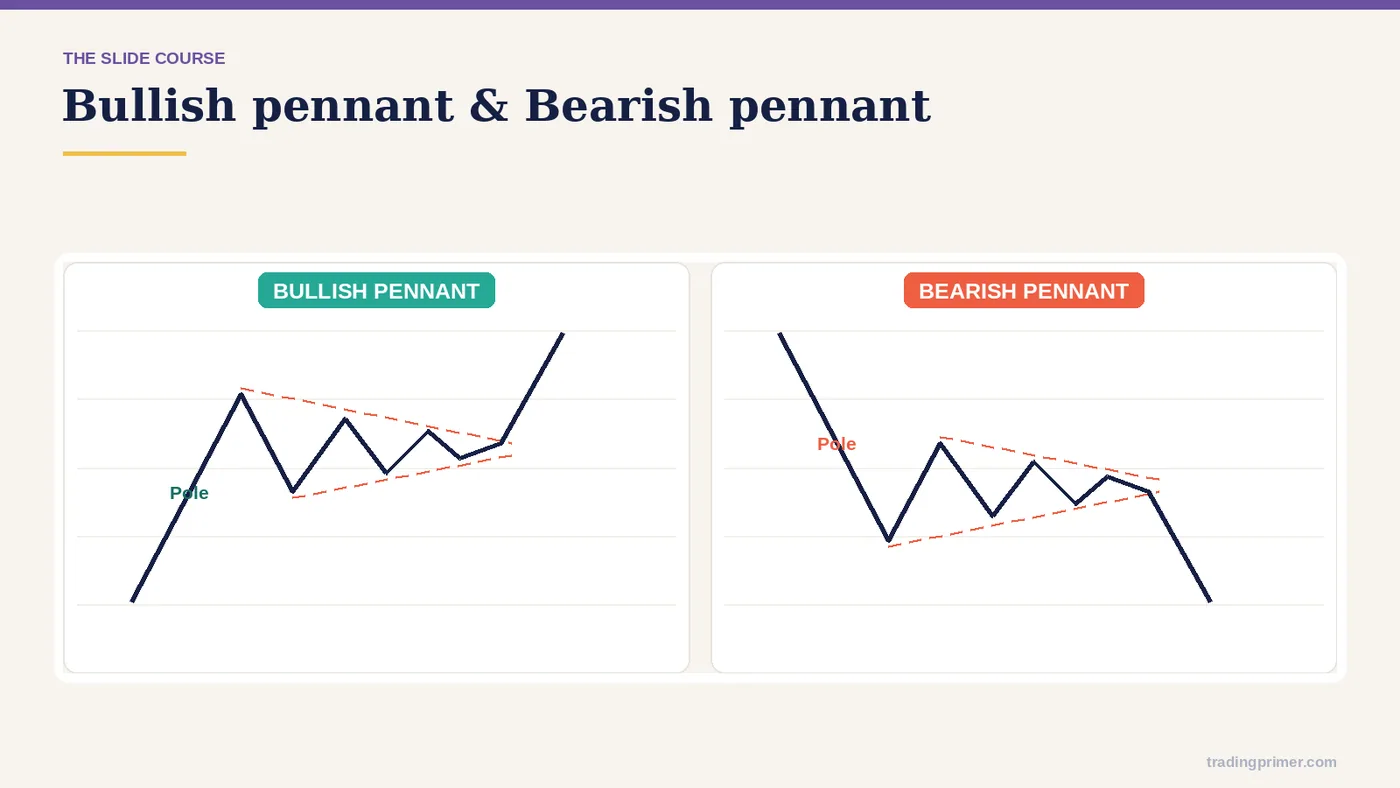
Bullish Pennant & Bearish Pennant — The chart carries the detail; the markings on it are what the course is teaching here.
Slide 44 of 62
How to trade the pattern — The entry rule is on the chart itself: the course marks where the entry sits, where the stop goes, and what the pattern has to do before the trade is valid. Read the markings before moving on.
Slide 45 of 62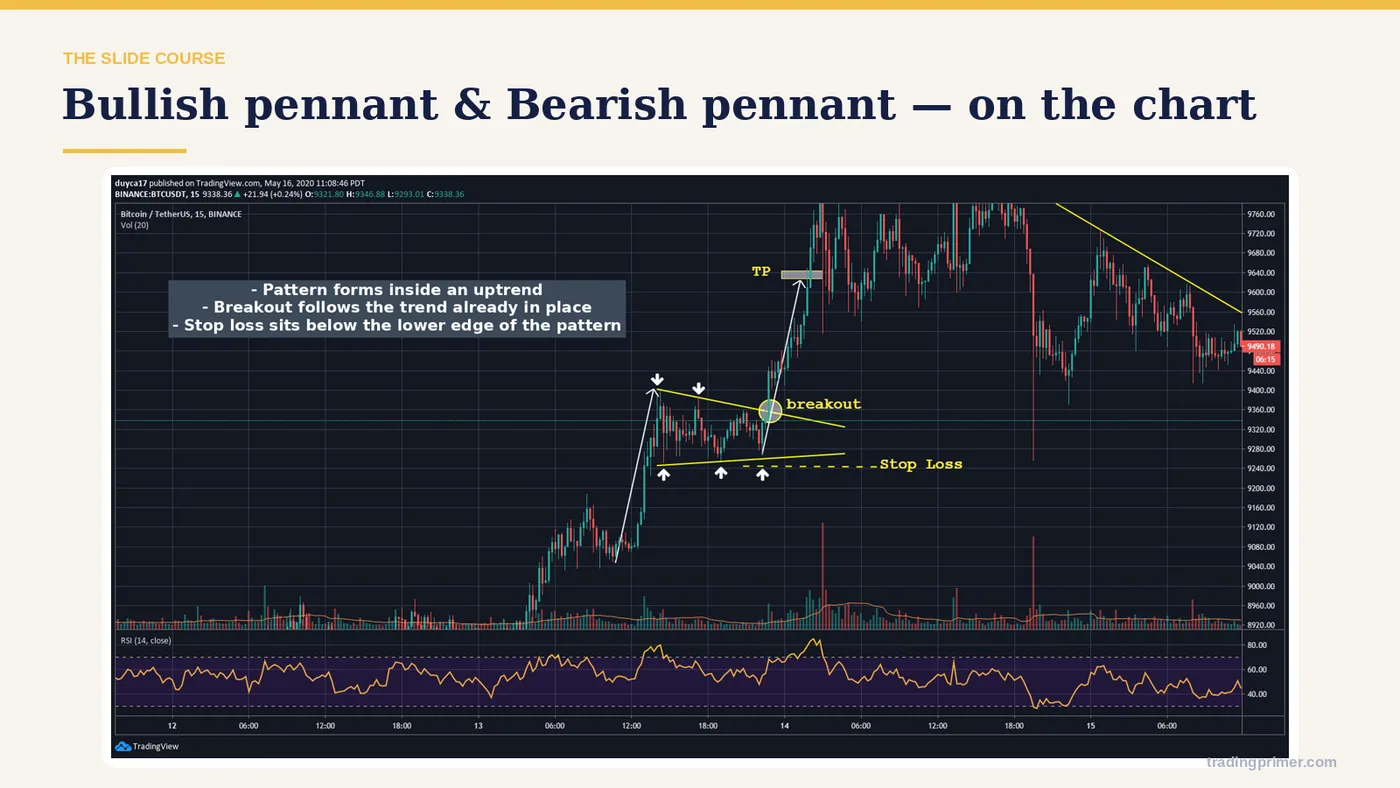
Bullish Pennant & Bearish Pennant — a chart from the course deck. The markings on it are the lesson; read them left to right.
Slide 46 of 62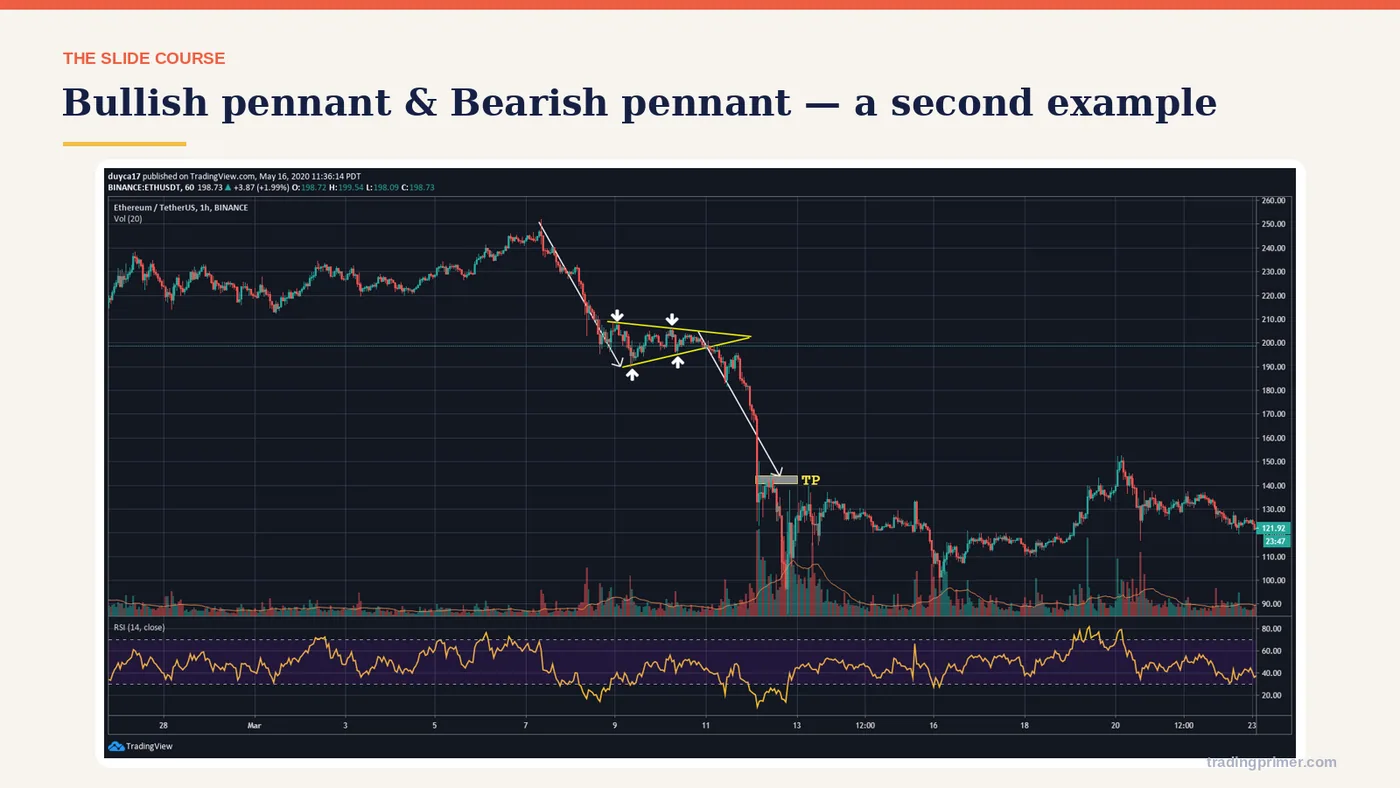
Bullish Pennant & Bearish Pennant — a chart from the course deck. The markings on it are the lesson; read them left to right.
Slide 47 of 62 Tap to enlarge
Bilateral means both sides are live. Lower highs squeeze against higher lows until one side gives way. The point of the animation is the discipline, not the shape: you do not pick the winner in advance — you wait for a full candle close outside the lines and trade that side only.
Slide 48 of 62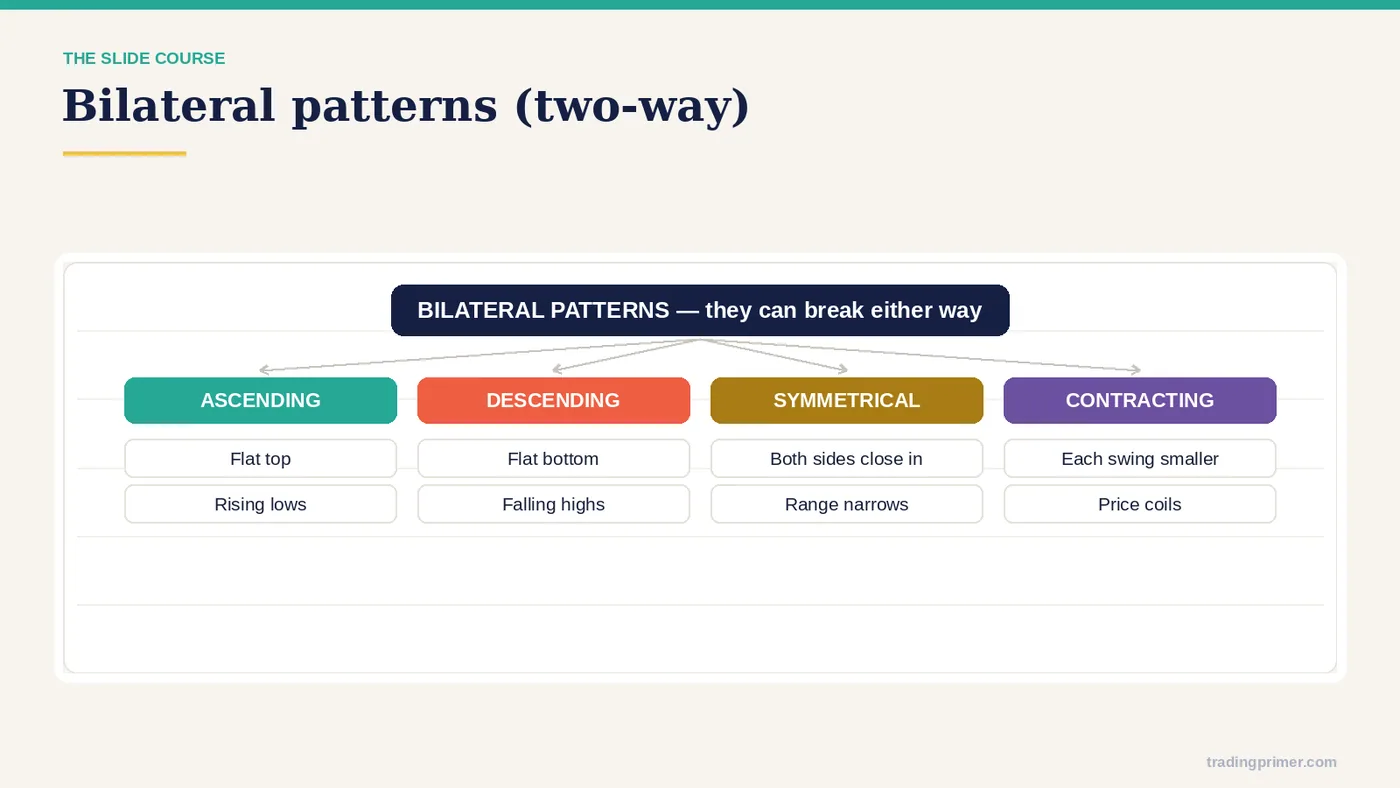
The bilateral family. Symmetrical triangles and their relatives can resolve in either direction. Treat each one like a pending order on both sides: mark the two lines, define the two triggers, and let the closing candle choose which trade exists.
Slide 49 of 62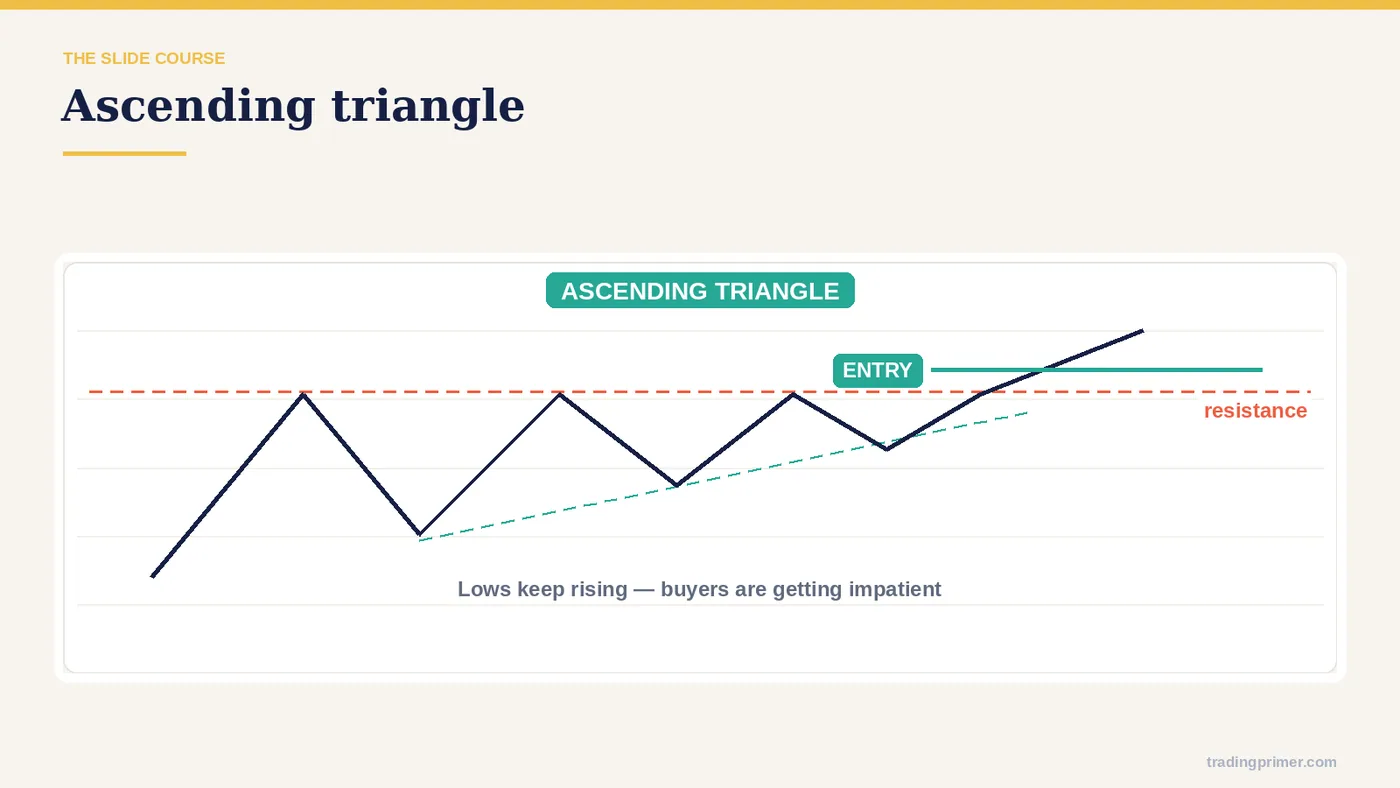
Bilateral patterns (continuation / reversal) — Ascending triangle.
Slide 50 of 62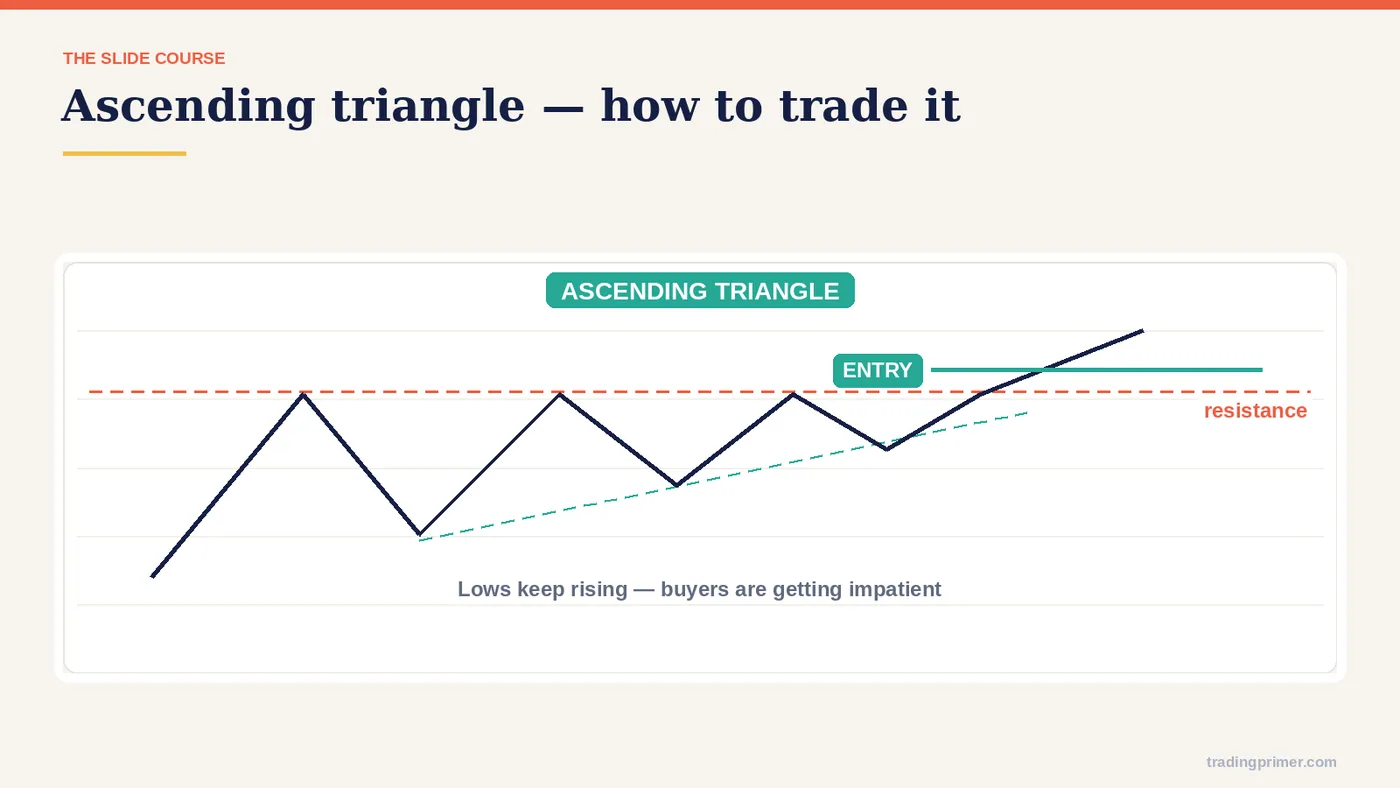
How to trade the pattern — The entry rule is on the chart itself: the course marks where the entry sits, where the stop goes, and what the pattern has to do before the trade is valid. Read the markings before moving on.
Slide 51 of 62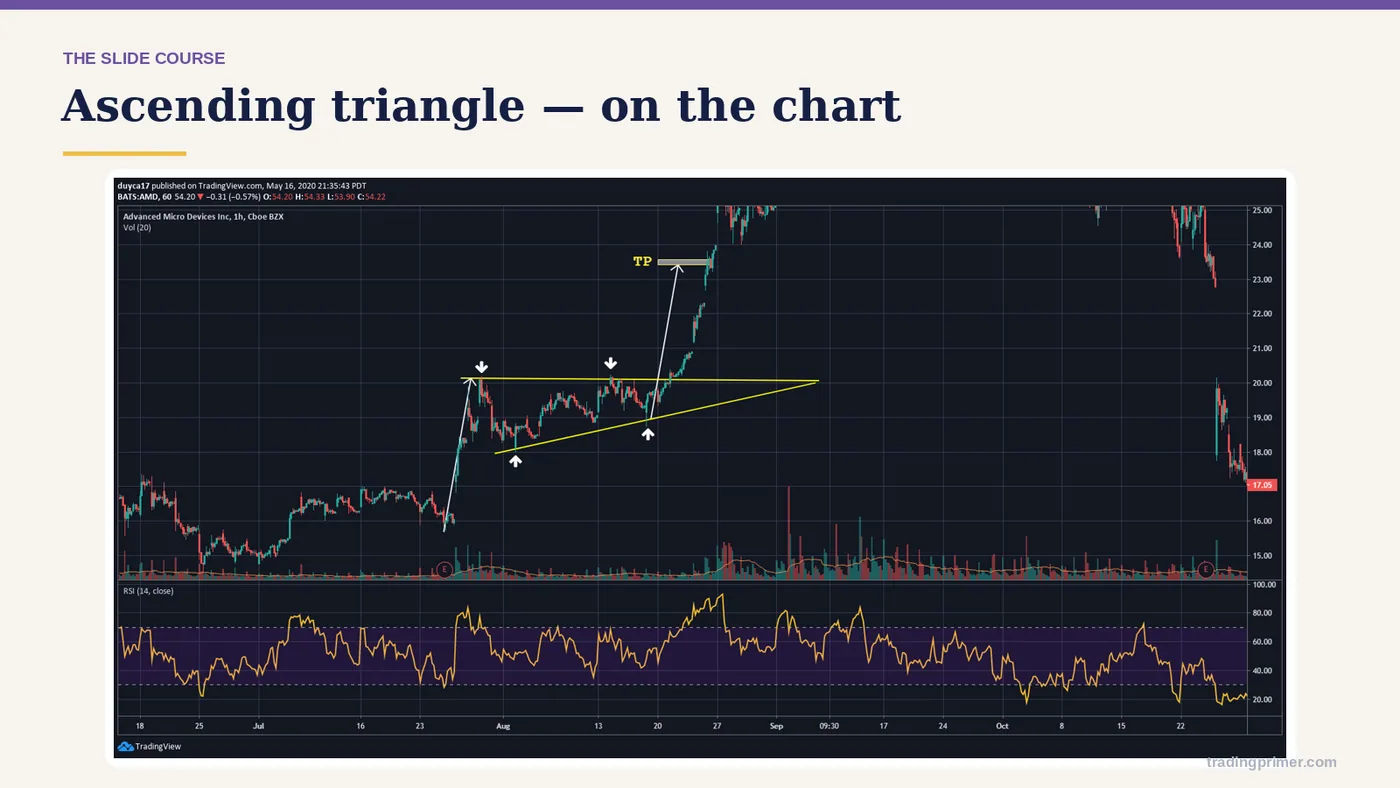
Bilateral patterns (continuation / reversal) — a chart from the course deck. The markings on it are the lesson; read them left to right.
Slide 52 of 62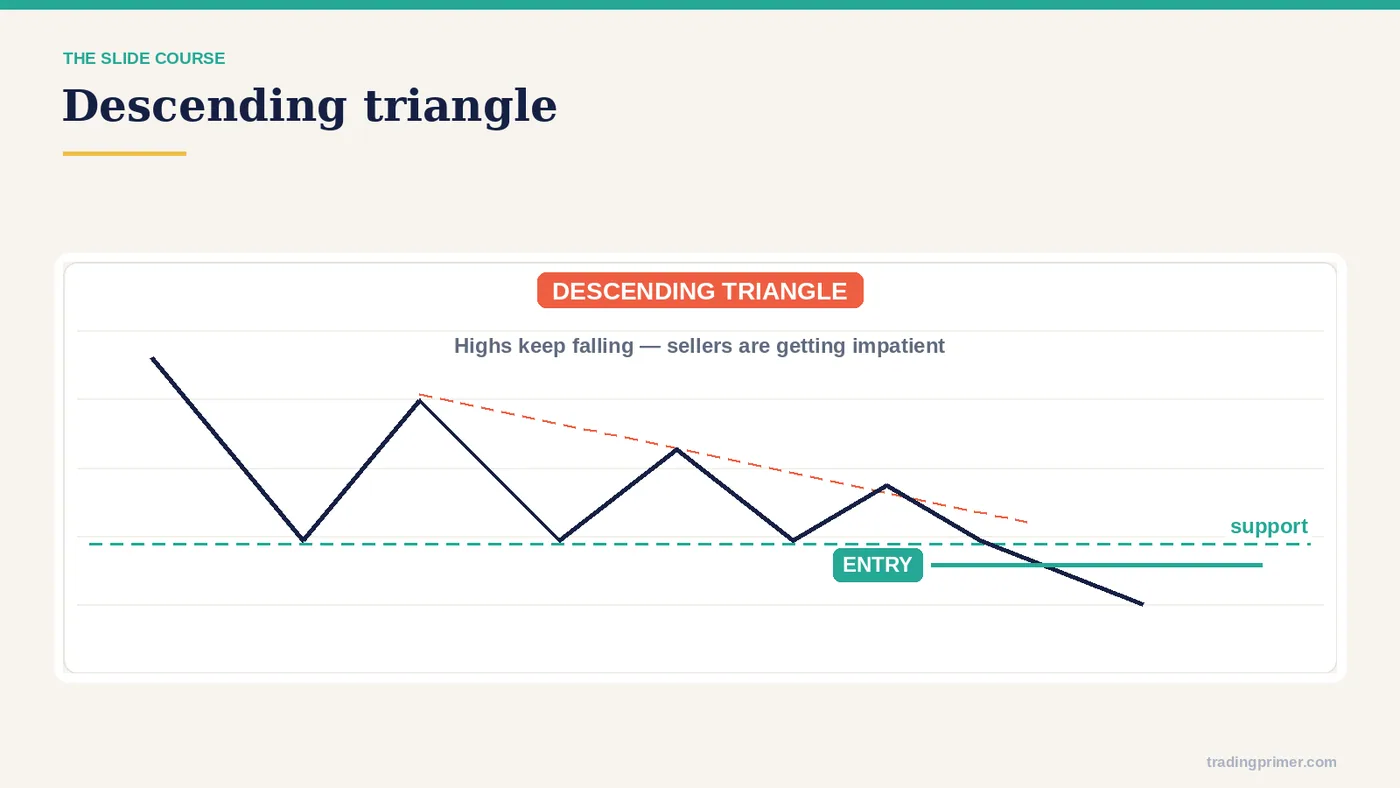
Bilateral patterns (continuation / reversal) — Descending triangle.
Slide 53 of 62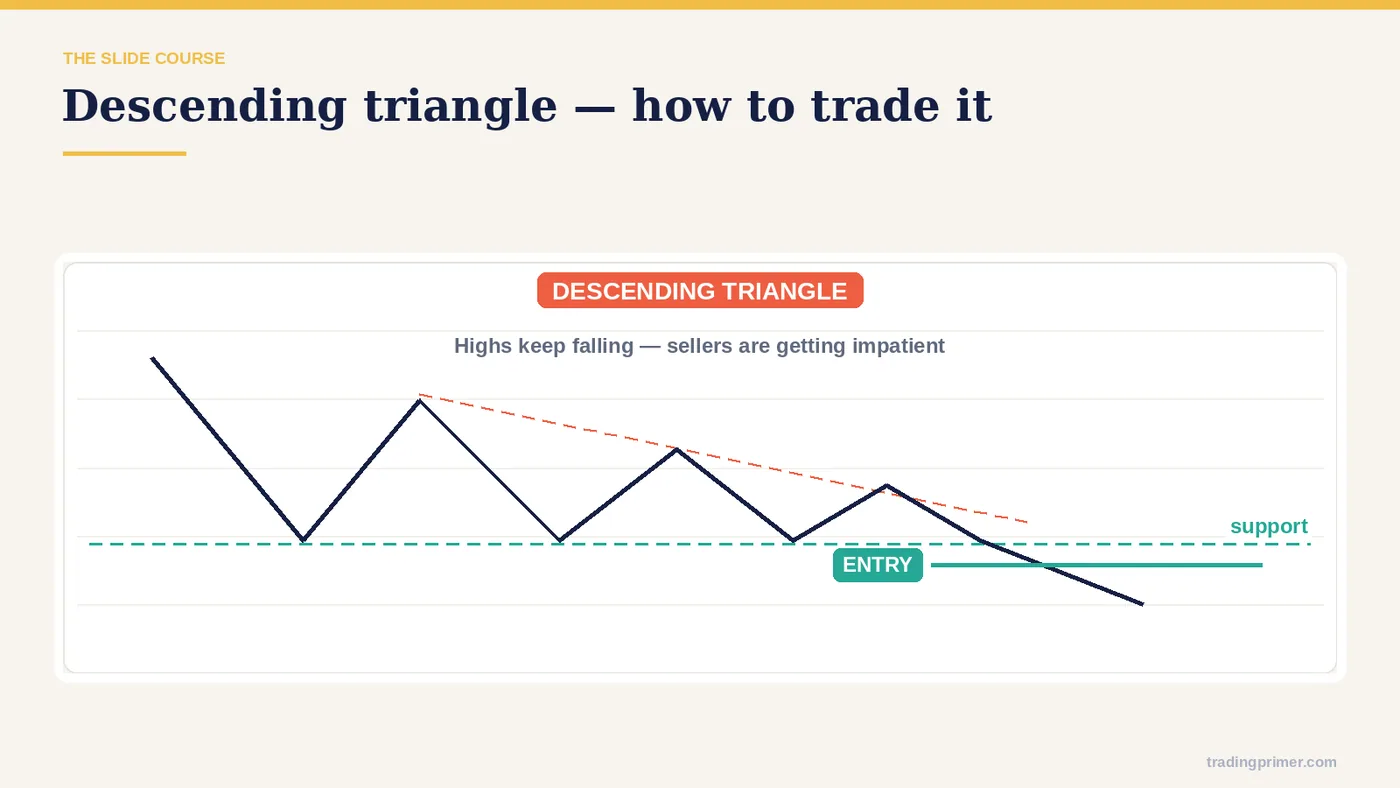
How to trade the pattern — The entry rule is on the chart itself: the course marks where the entry sits, where the stop goes, and what the pattern has to do before the trade is valid. Read the markings before moving on.
Slide 54 of 62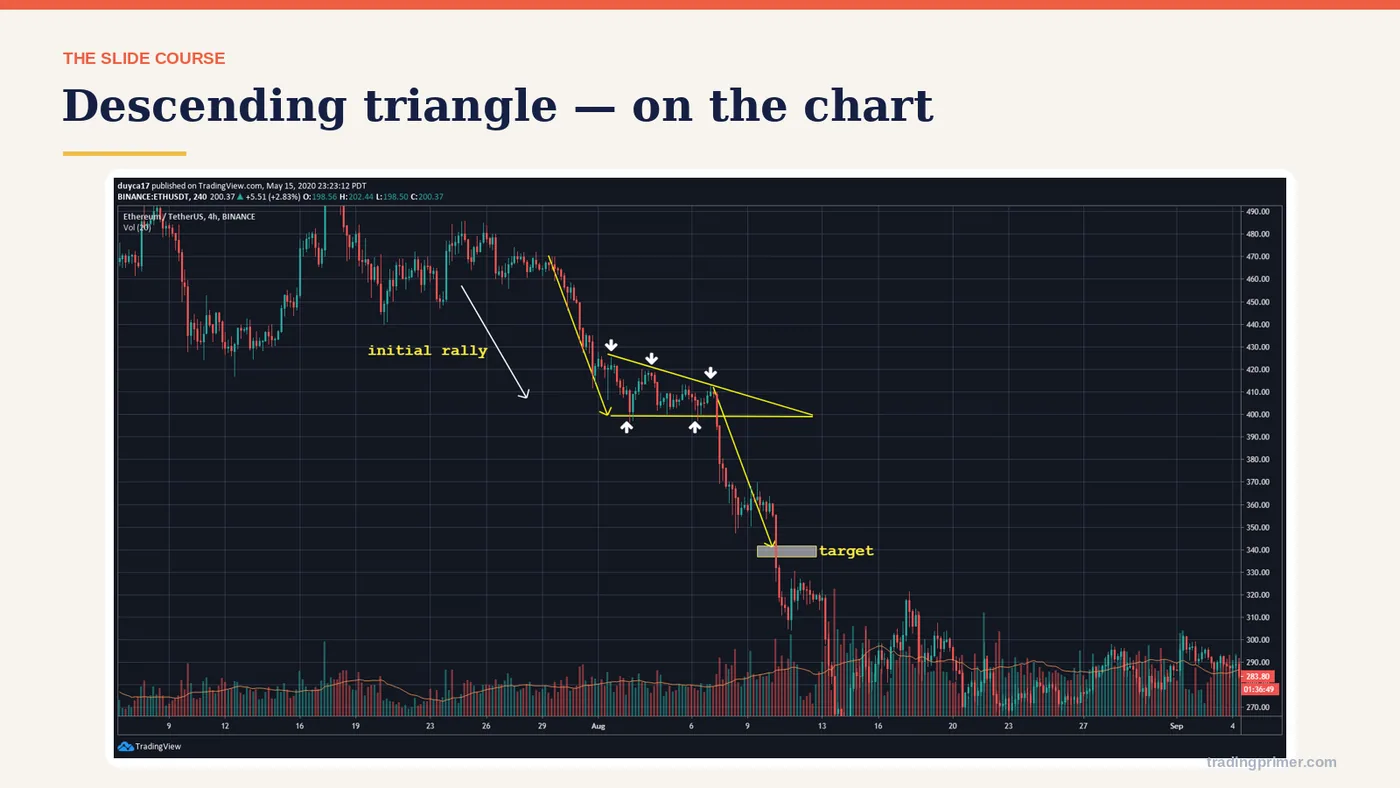
Bilateral patterns (continuation / reversal) — a chart from the course deck. The markings on it are the lesson; read them left to right.
Slide 55 of 62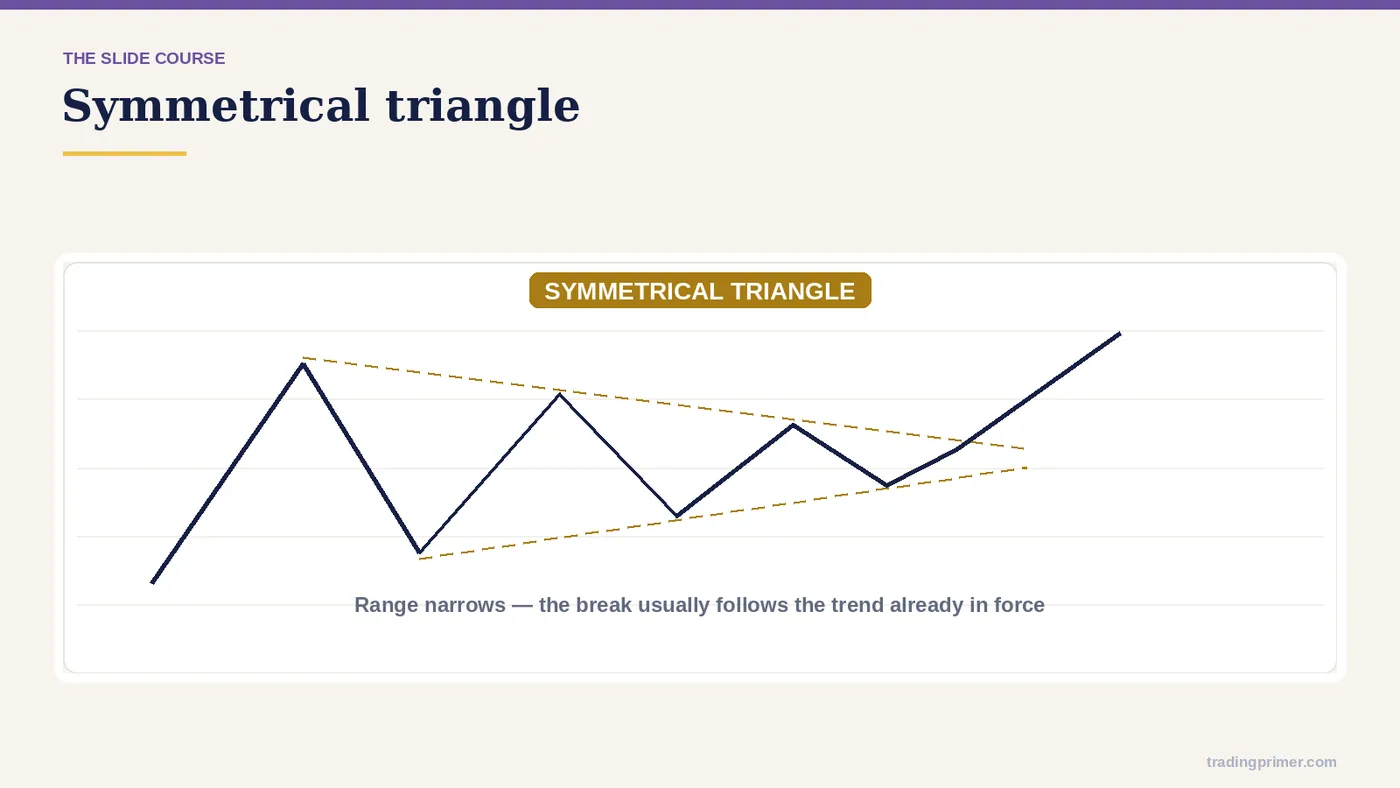
Bilateral patterns (continuation / reversal) — Symmetrical triangle.
Slide 56 of 62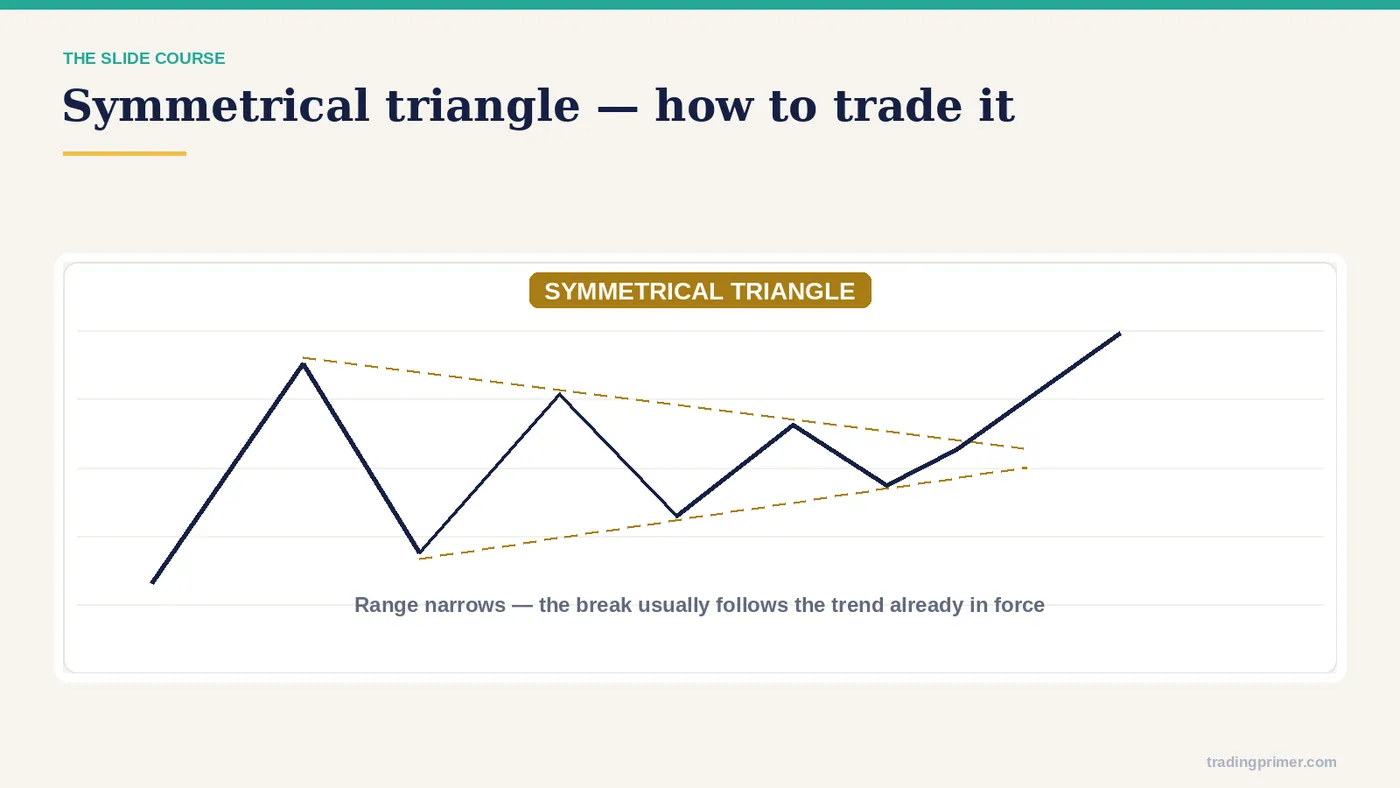
How to trade the pattern — The entry rule is on the chart itself: the course marks where the entry sits, where the stop goes, and what the pattern has to do before the trade is valid. Read the markings before moving on.
Slide 57 of 62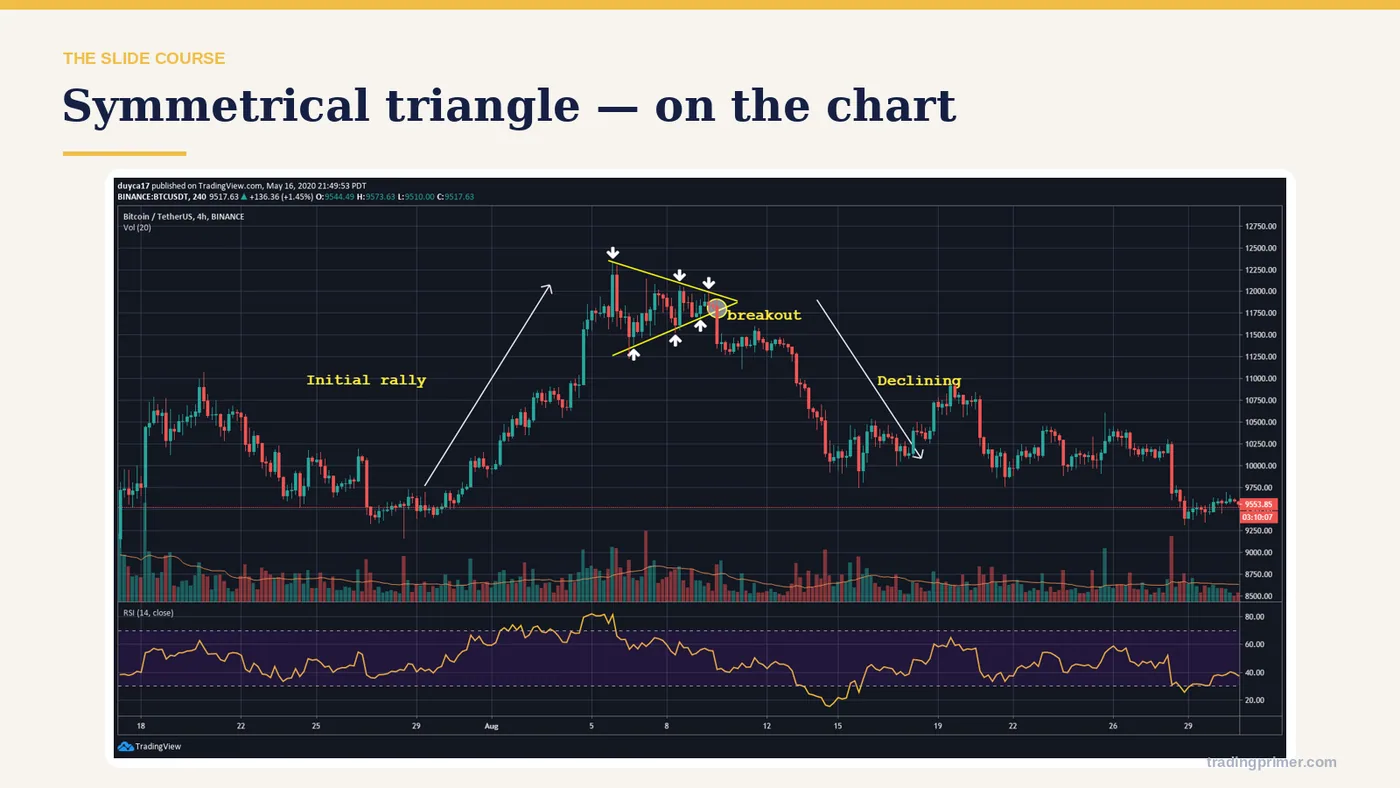
Bilateral patterns (continuation / reversal) — a chart from the course deck. The markings on it are the lesson; read them left to right.
Slide 58 of 62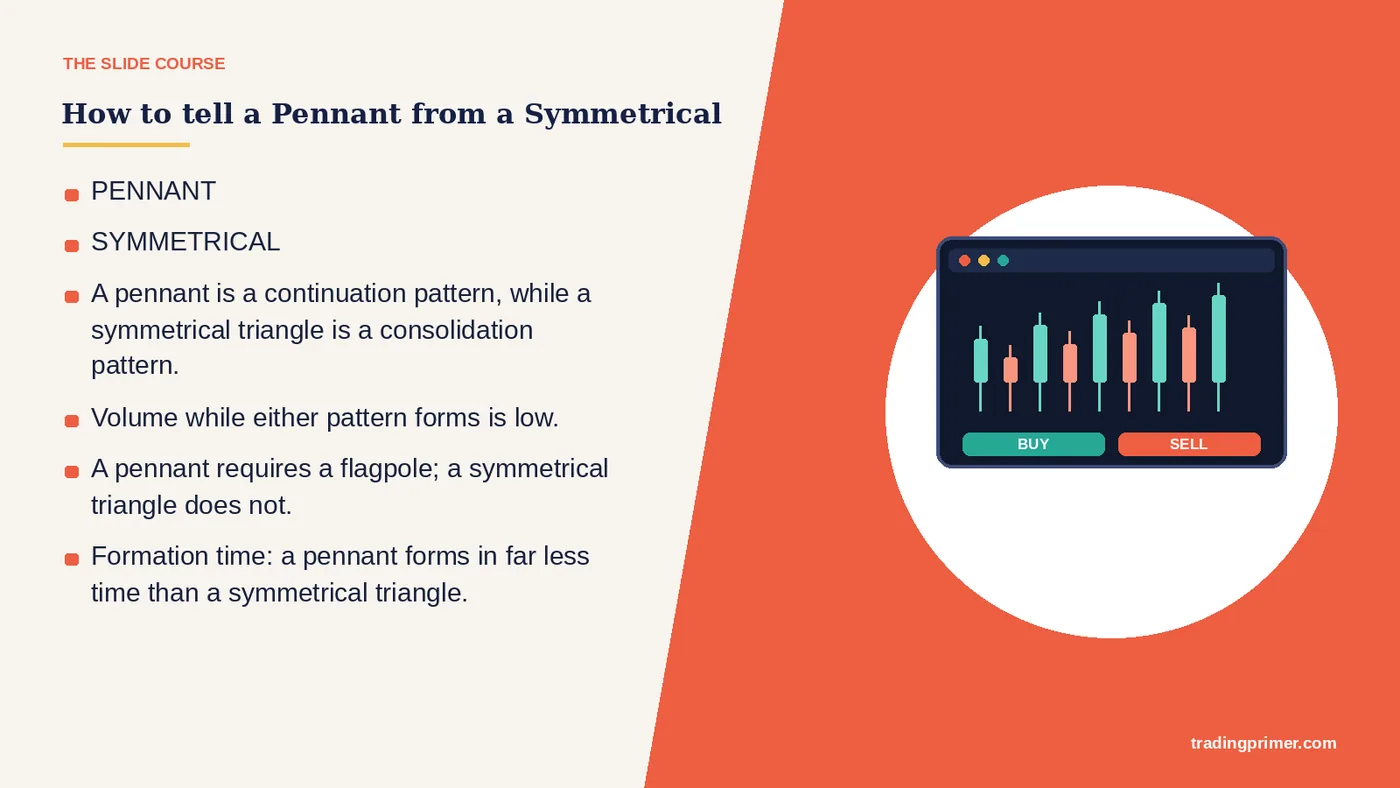
Pennant or symmetrical triangle? Same converging shape, different context. A pennant hangs off a pole after a sharp move and leans toward continuation; a symmetrical triangle stands alone and stays two-sided until the close. Look for the pole first — it decides which family's rules apply.
Slide 59 of 62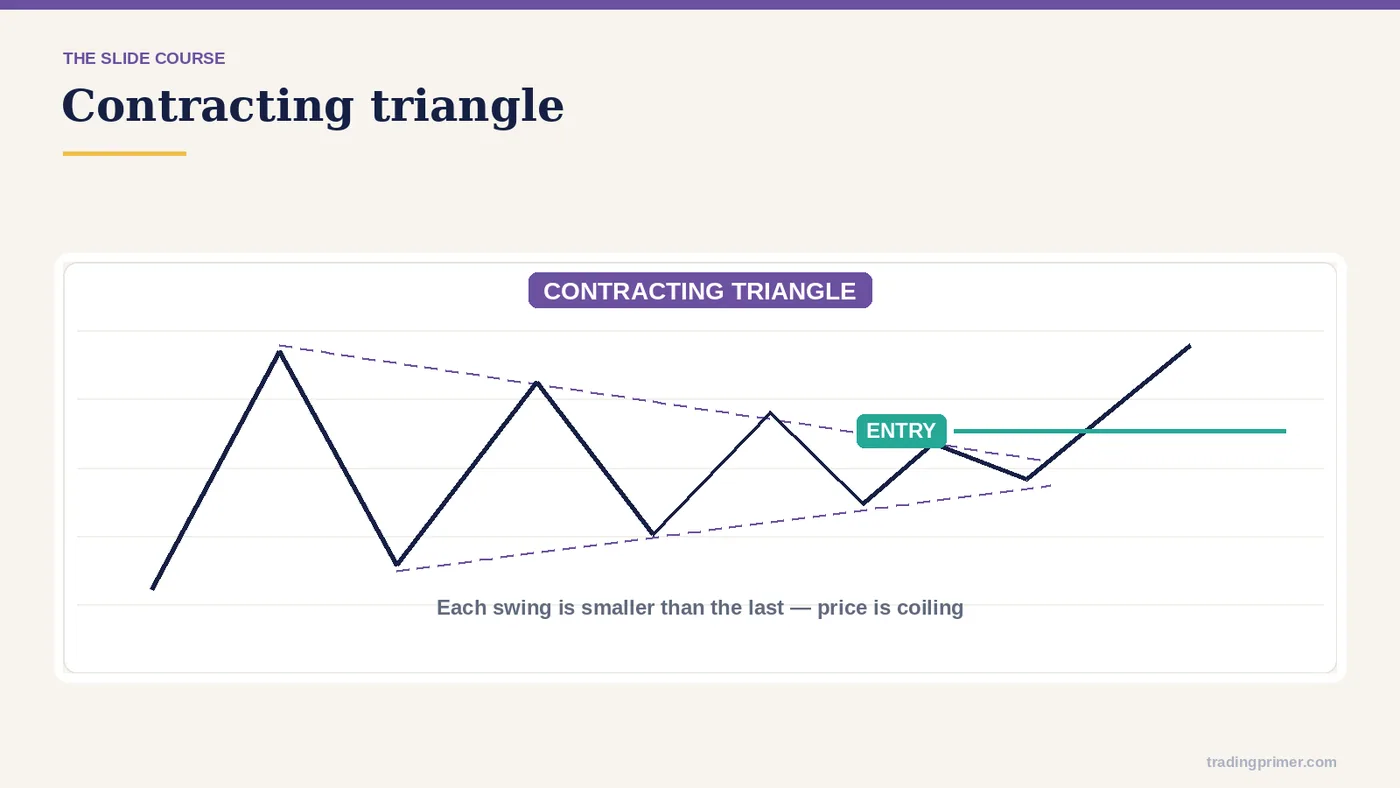
Bilateral patterns (continuation / reversal) — Contracting triangle.
Slide 60 of 62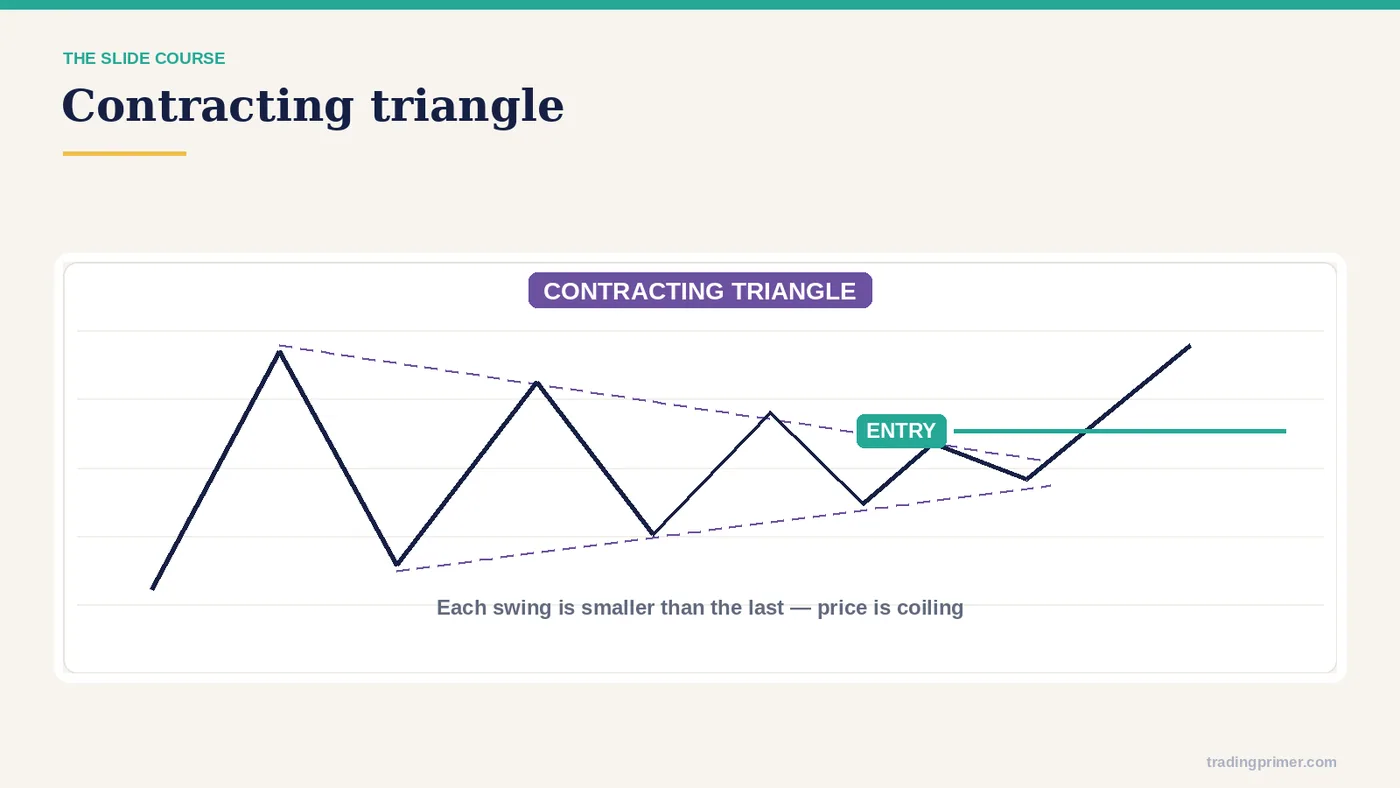
Bilateral patterns (continuation / reversal) — a chart from the course deck. The markings on it are the lesson; read them left to right.
Slide 61 of 62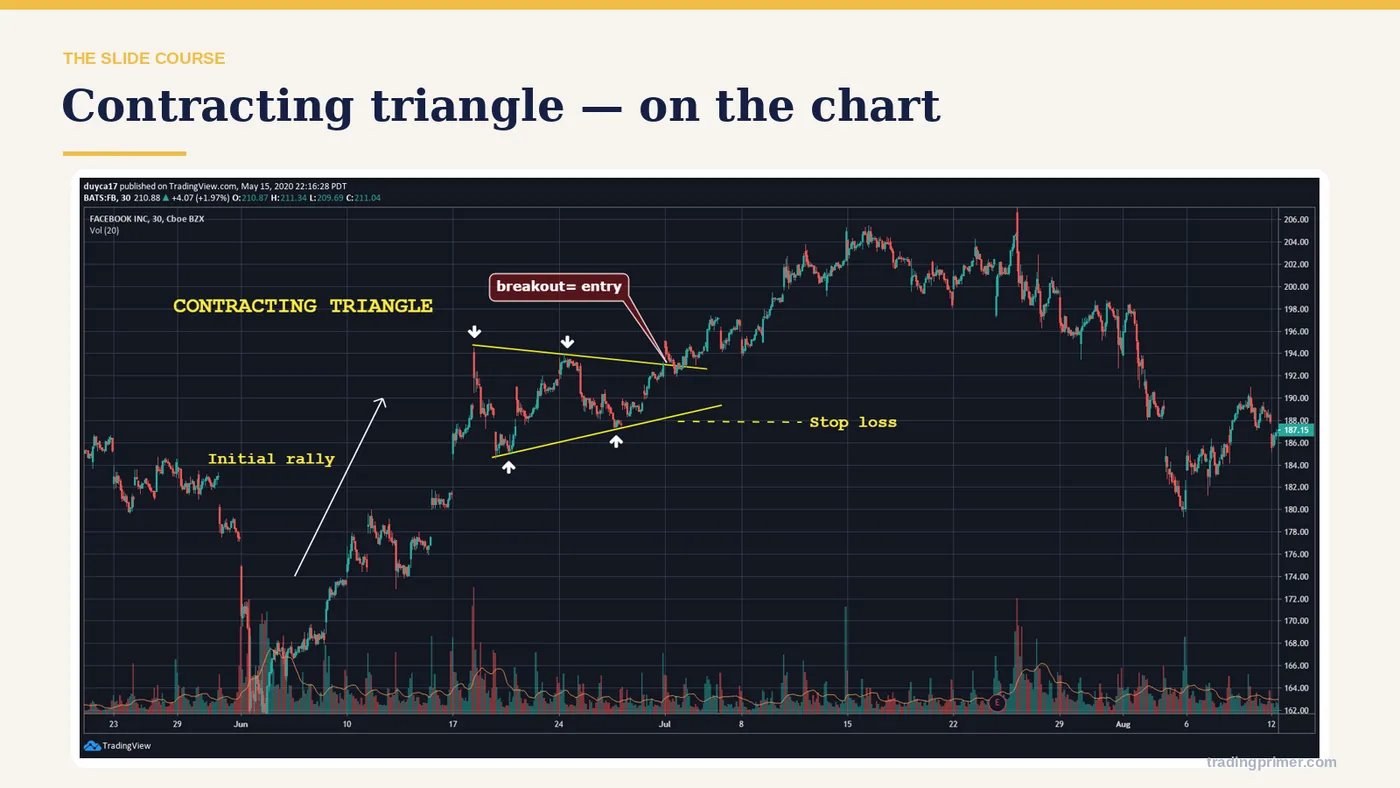
Bilateral patterns (continuation / reversal) — a chart from the course deck. The markings on it are the lesson; read them left to right.
Slide 62 of 62What this part covers
21 topics, in order. Each link jumps straight to that slide.
Prefer it as a PDF?
The same ten parts, downloadable, to keep next to your charts.