Part 6 — Japanese candlesticks
Every candle pattern the course teaches, each with its own entry method. All 72 slides in the order the course teaches them — each one explained underneath.
Japanese Candlesticks — How To Trade. Each Candle Pattern. PART VI.
Slide 1 of 72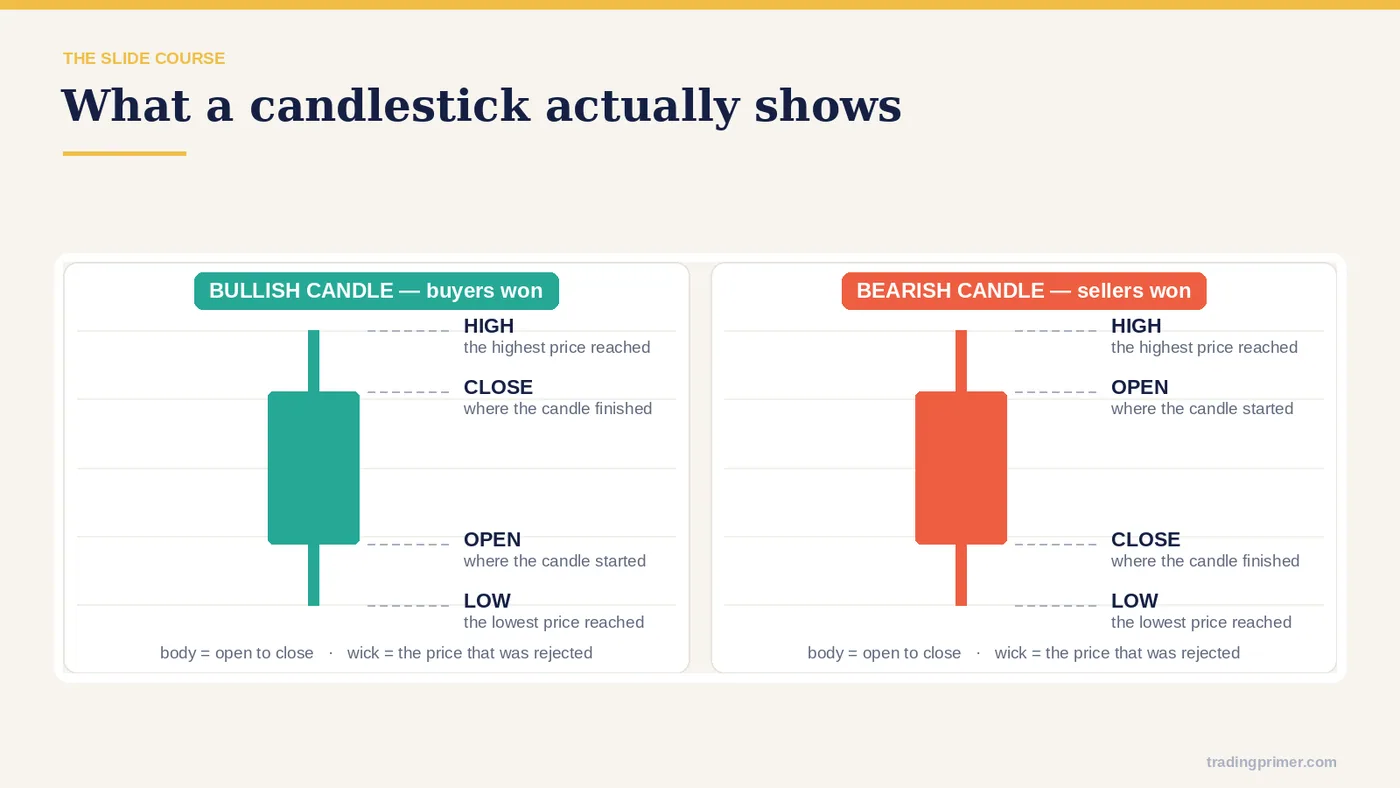
Open — Close. High. What is a candle pattern?
Slide 2 of 72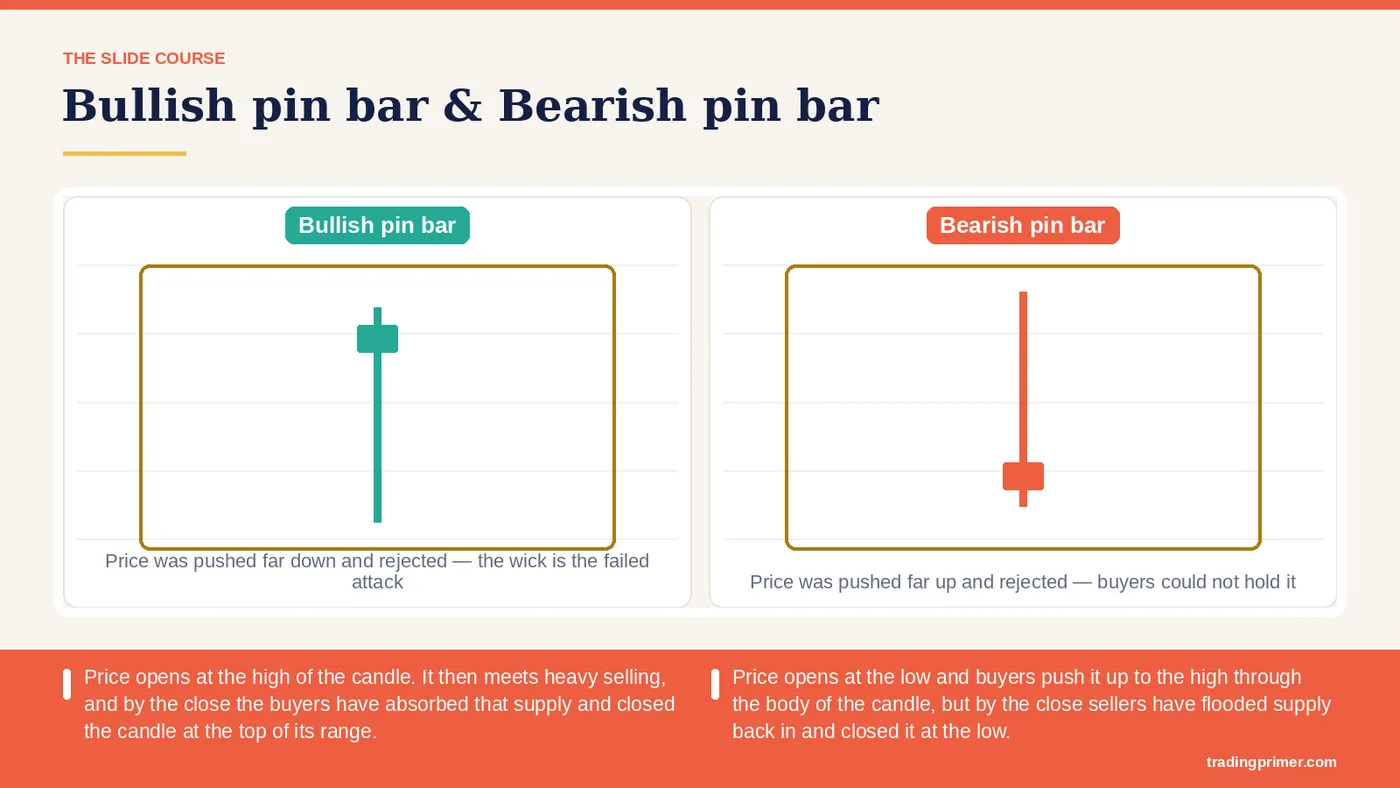
Price opens at the high of the candle. It then meets heavy selling, and by the close the buyers have absorbed that supply and closed the candle at the top of its range. — Price opens at the low and buyers push it up to the high through the body of the candle, but by the close sellers have flooded supply back in and closed it at the low. What does a Pin Bar mean? Bullish pin bar. Bearish pin bar.
Slide 3 of 72
Any single candle, or any run of candles together, tells you something about what the market is about to do — Reading candles shows you which side is in control of the market. It reads the market's direction reasonably accurately. Alongside the technical indicators, reading candles raises your confidence when two or more signs point to the same coming move. Candles combined with volume can keep a trader out of false signals — the bull traps and bear traps. What reading candles does for you. in trading.
Slide 4 of 72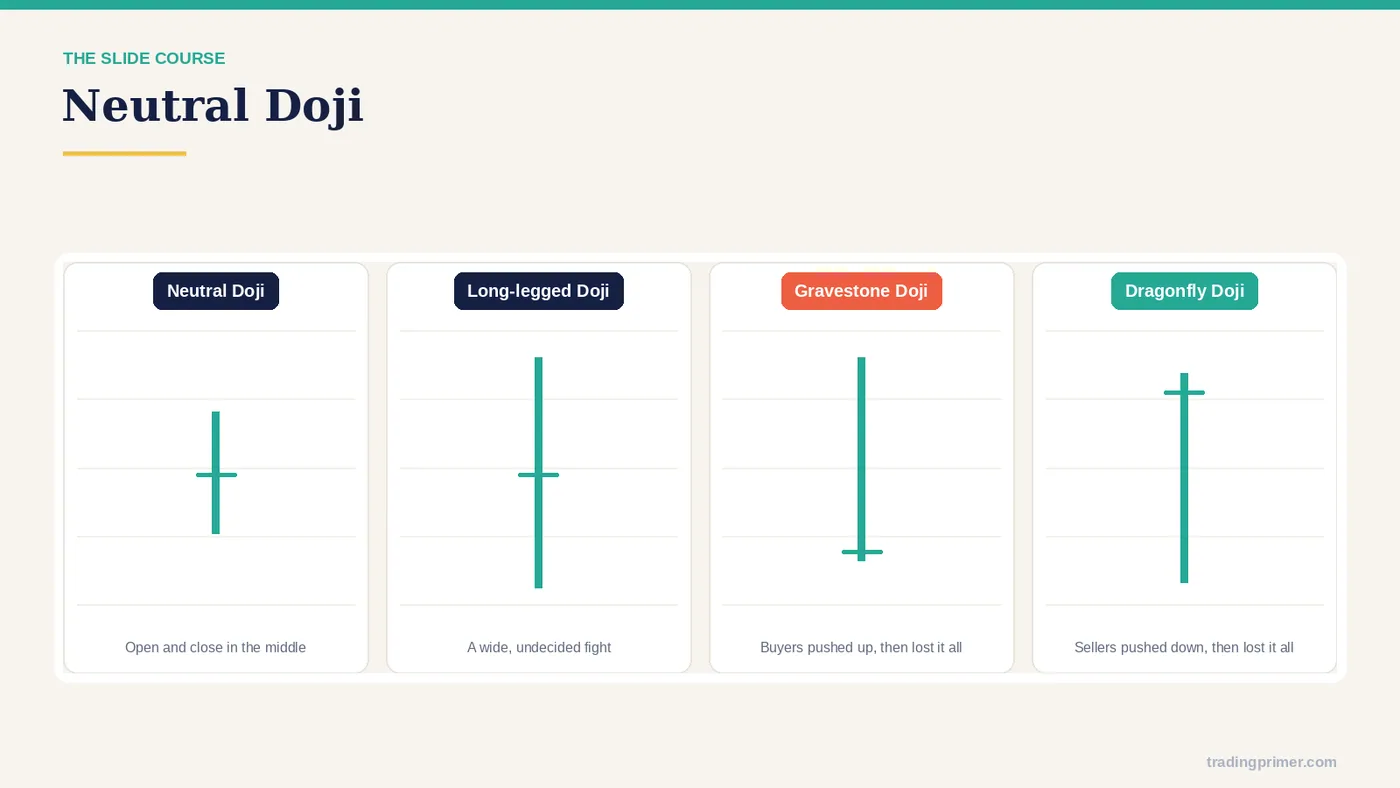
The most common — Japanese candle patterns.
Slide 5 of 72
The most common Japanese candle patterns — a chart from the course deck. The markings on it are the lesson; read them left to right.
Slide 6 of 72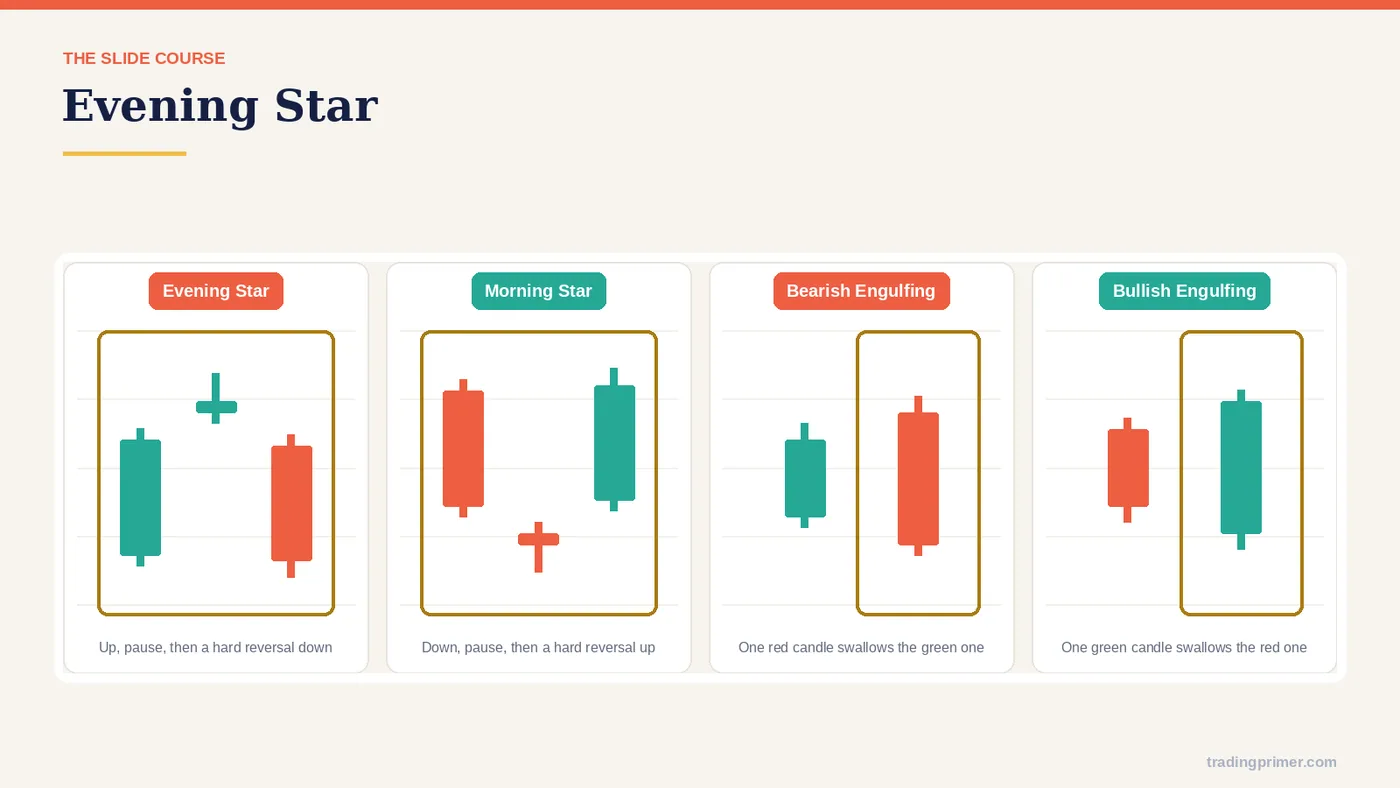
The most common Japanese candle patterns — a chart from the course deck. The markings on it are the lesson; read them left to right.
Slide 7 of 72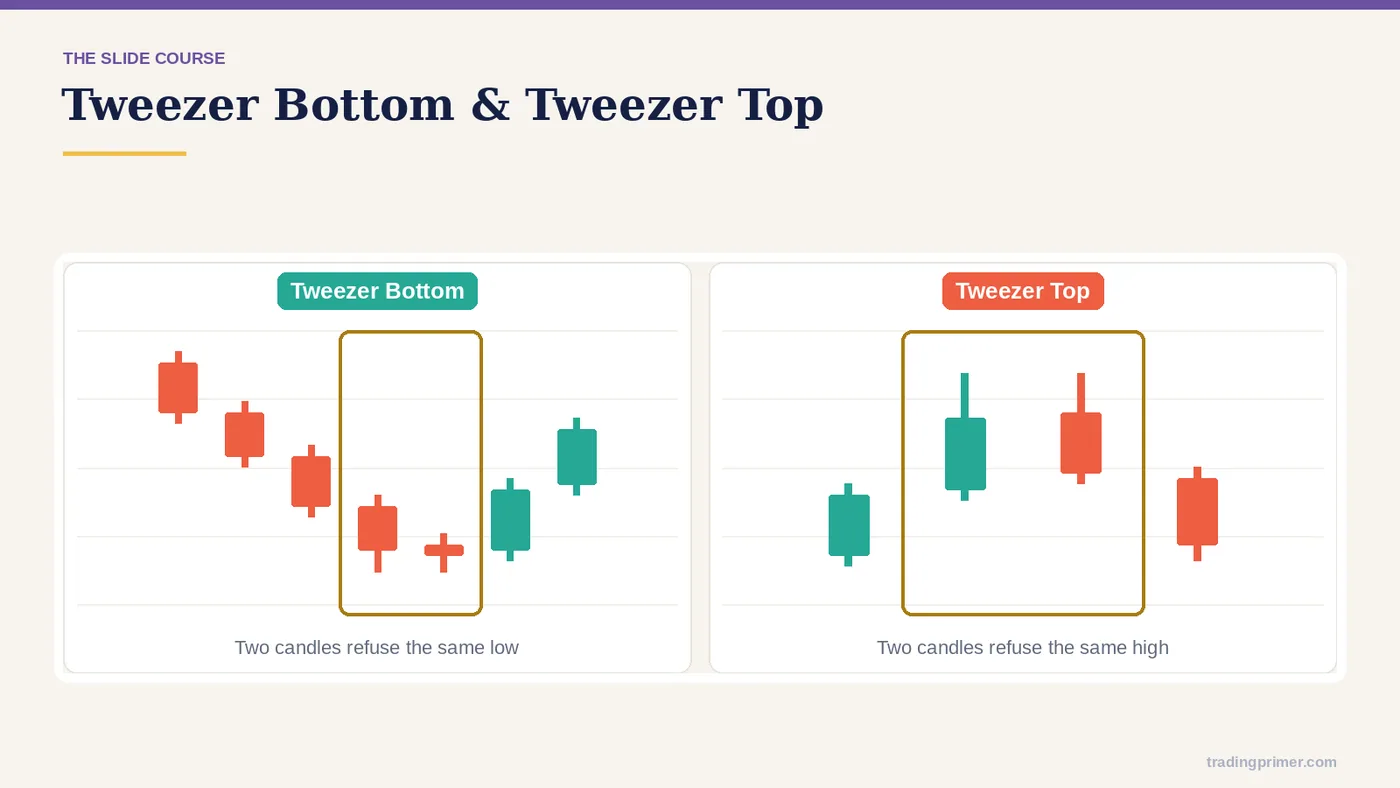
The most common Japanese candle patterns — a chart from the course deck. The markings on it are the lesson; read them left to right.
Slide 8 of 72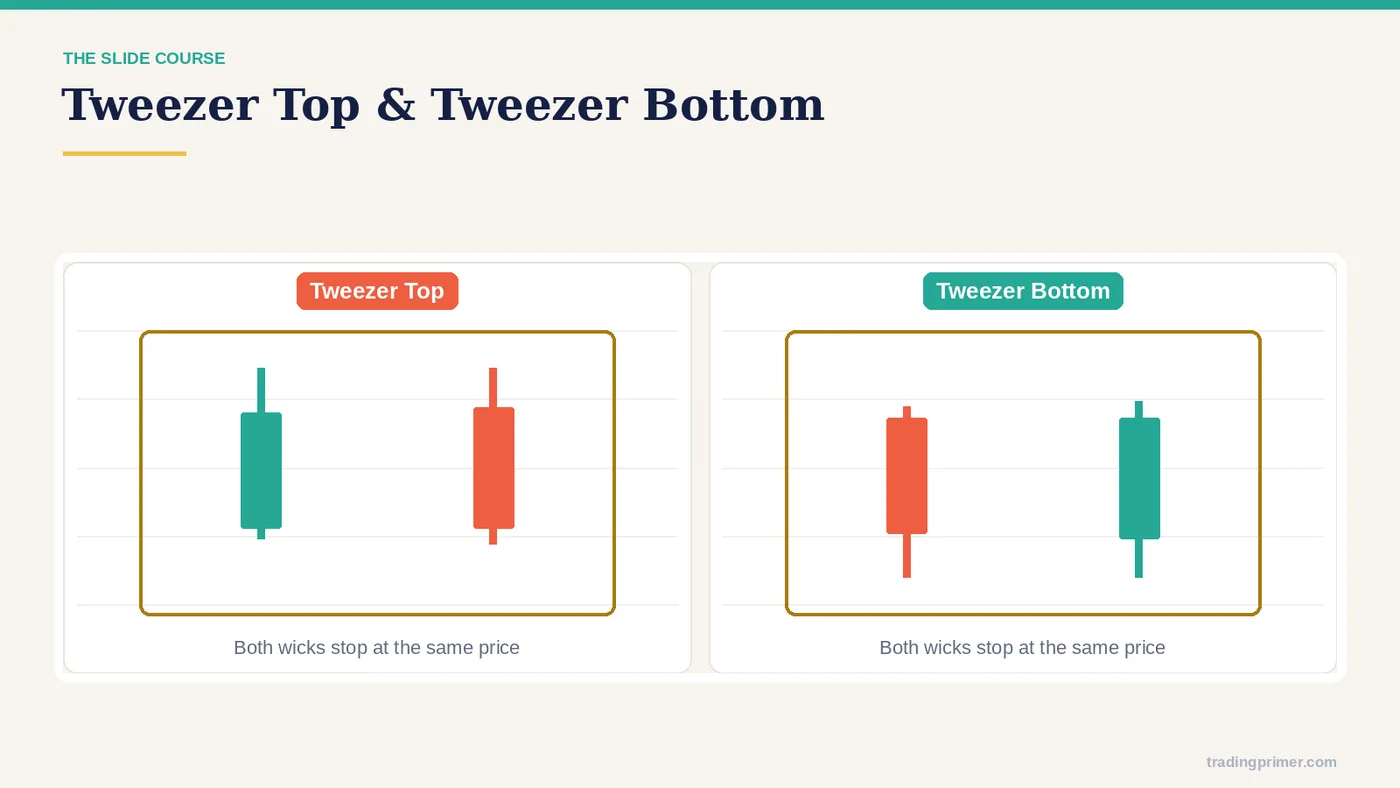
The most common Japanese candle patterns — a chart from the course deck. The markings on it are the lesson; read them left to right.
Slide 9 of 72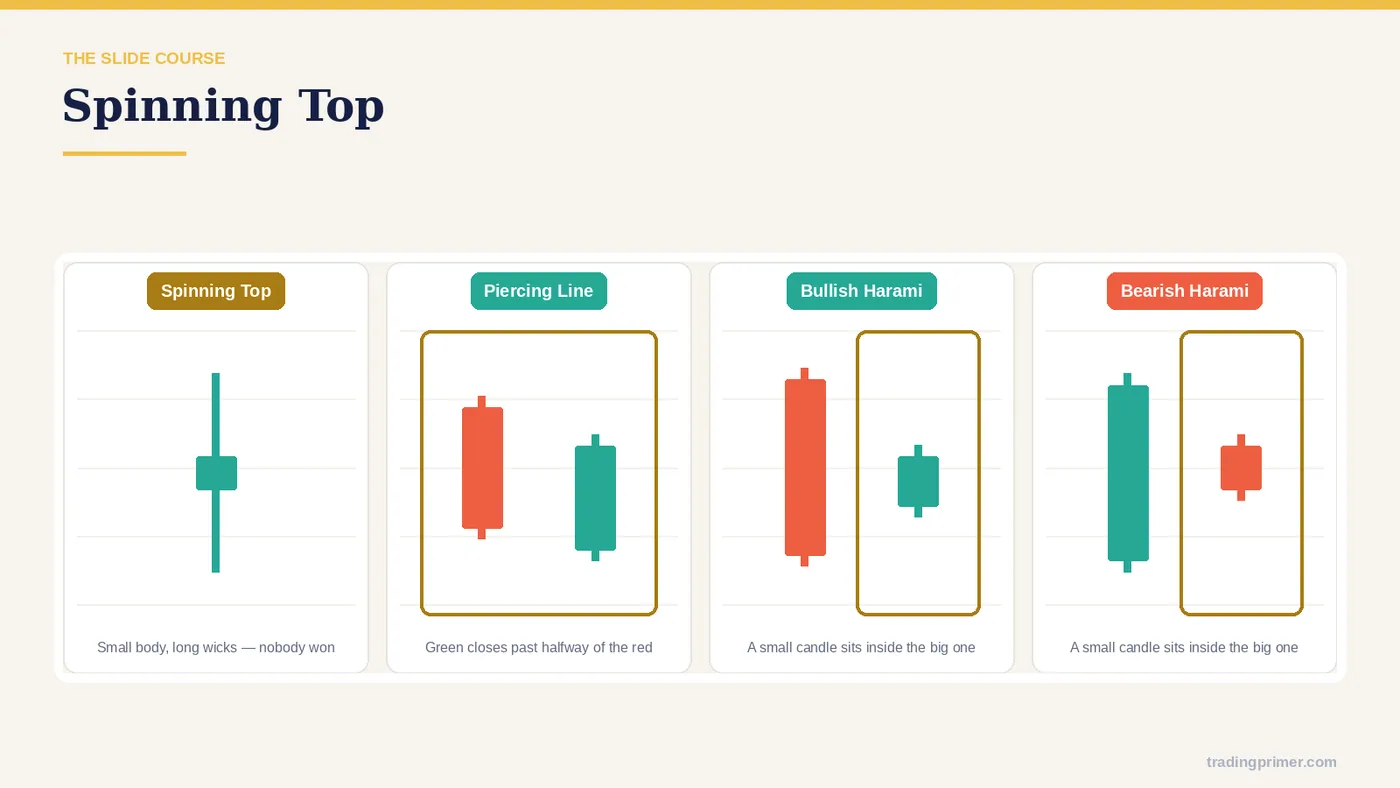
The most common Japanese candle patterns — a chart from the course deck. The markings on it are the lesson; read them left to right.
Slide 10 of 72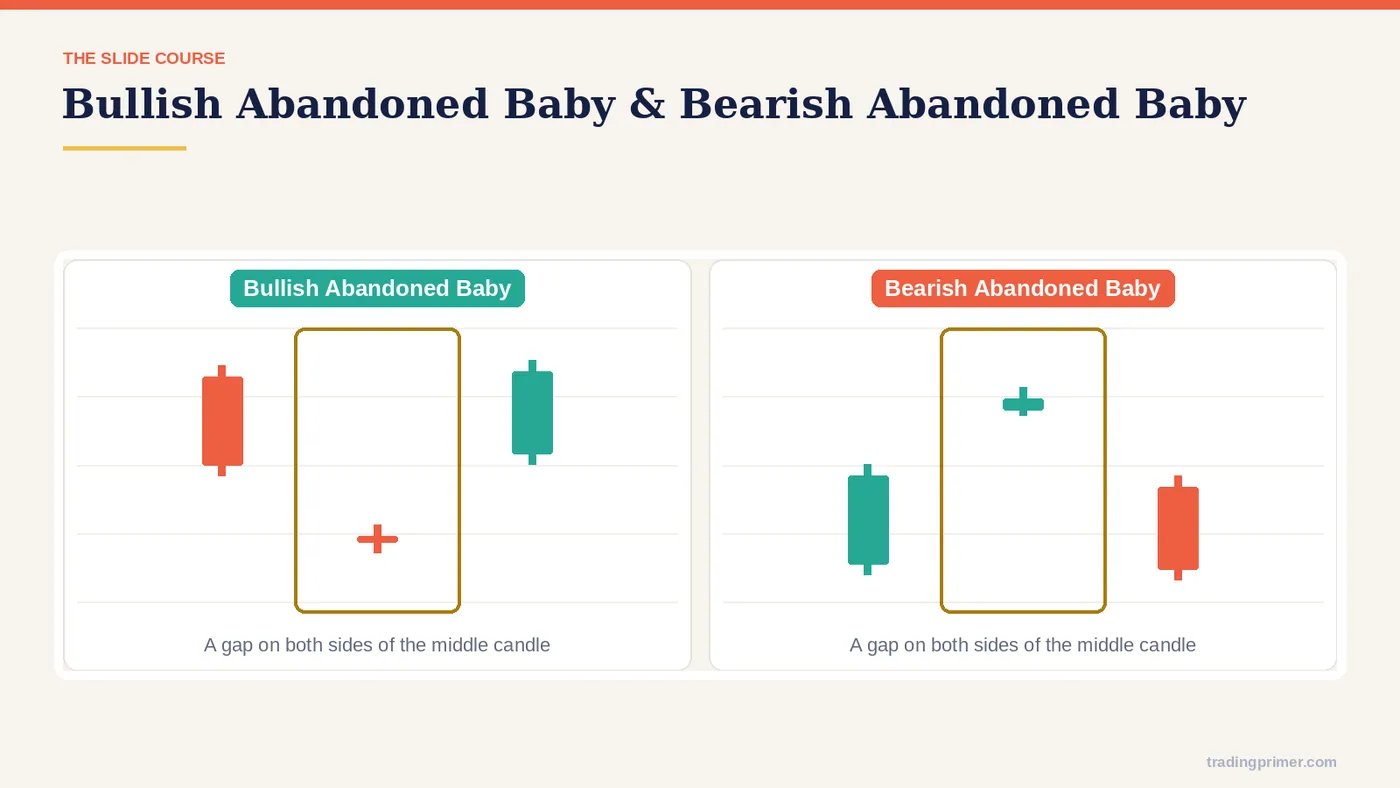
The most common Japanese candle patterns — a chart from the course deck. The markings on it are the lesson; read them left to right.
Slide 11 of 72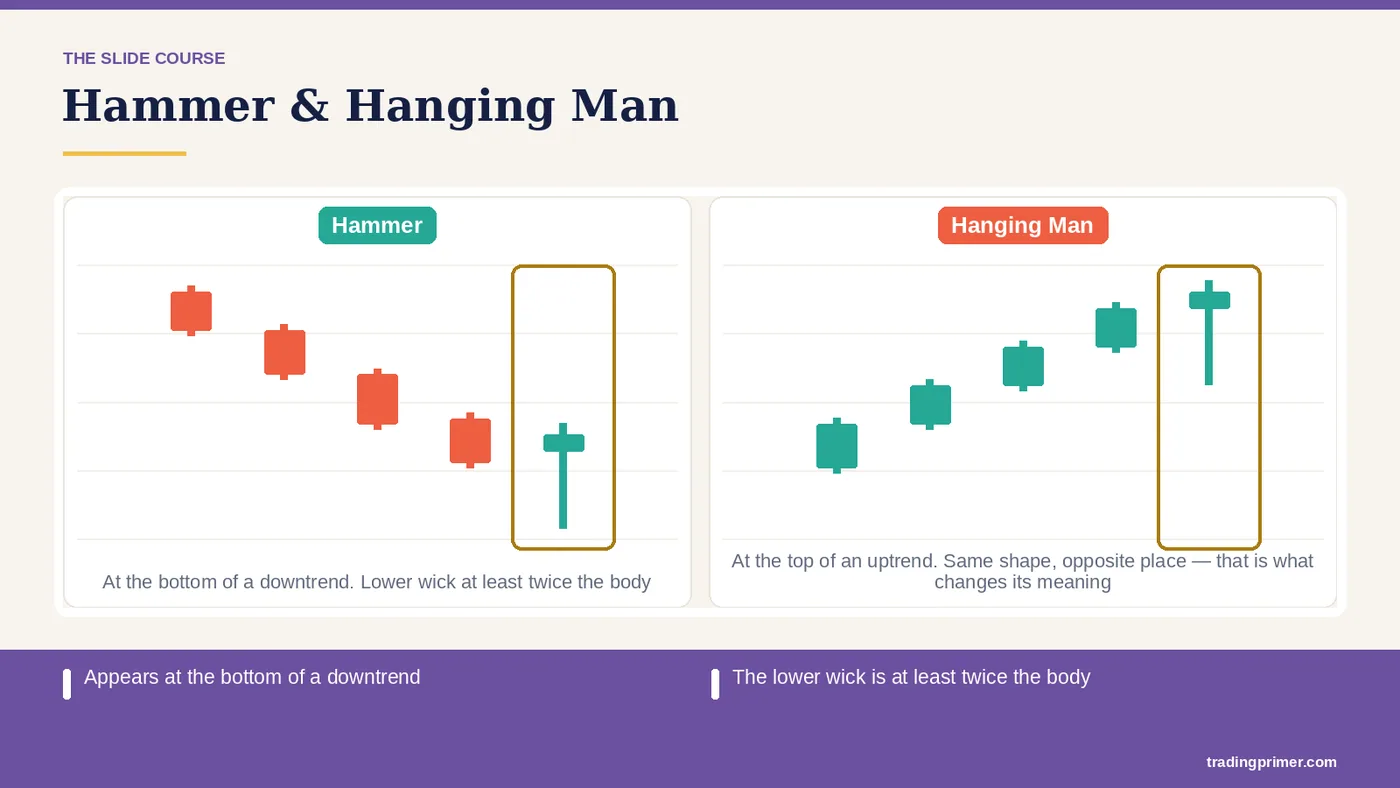
Appears at the bottom of a downtrend — The lower wick is at least twice the body. The body may be green or red. The entry signal comes on the following candle. Appears at the top of an uptrend. Hammer. Hanging man. Hammer / Hanging Man.
Slide 12 of 72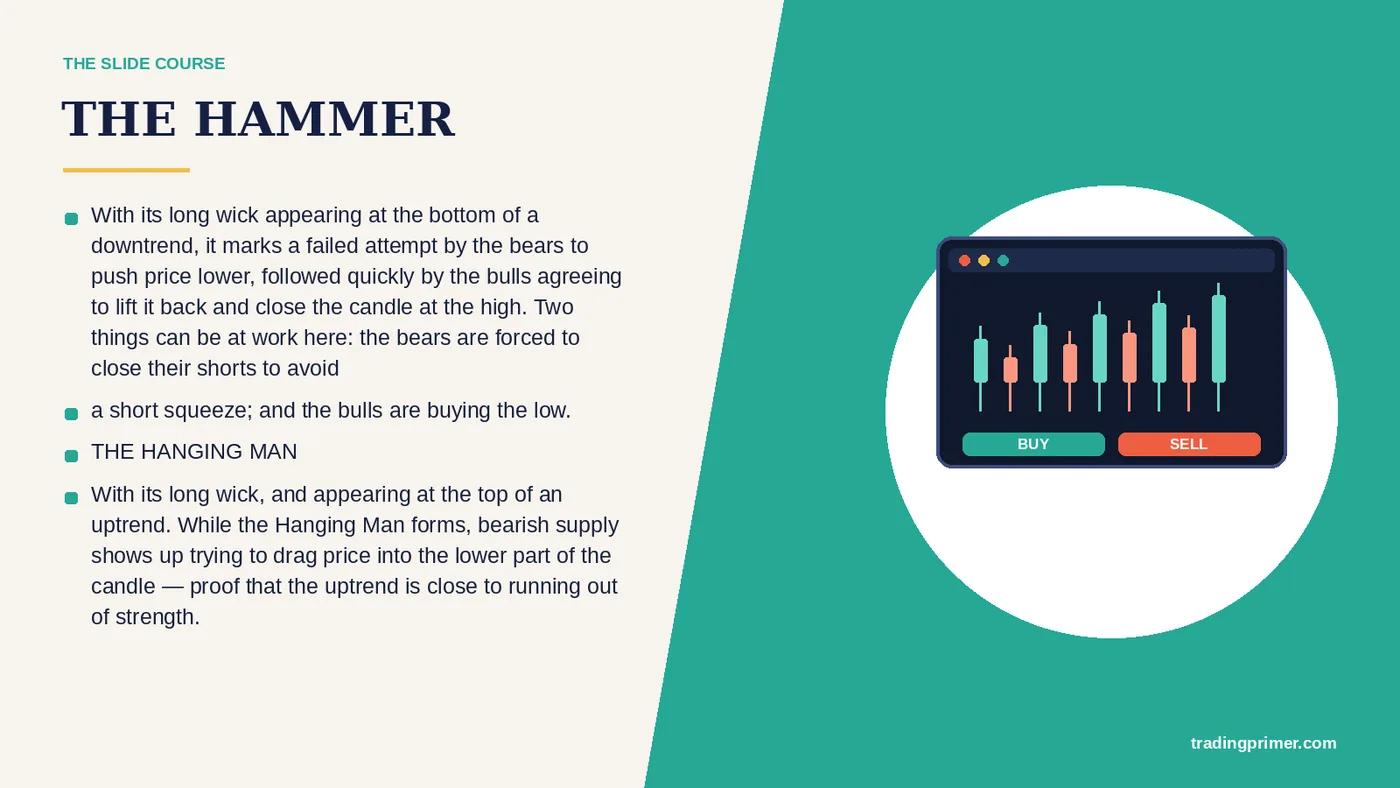
With its long wick, and appearing at the top of an uptrend. While the Hanging Man forms, bearish supply shows up trying to drag price into the lower part of the candle — proof that the uptrend is close to running out of strength. — THE HAMMER. With its long wick appearing at the bottom of a downtrend, it marks a failed attempt by the bears to push price lower, followed quickly by the bulls agreeing to lift it back and close the candle at the high. Two things can be at work here: the bears are forced to close their shorts to avoid. a short squeeze; and the bulls are buying the low. THE HANGING MAN.
Slide 13 of 72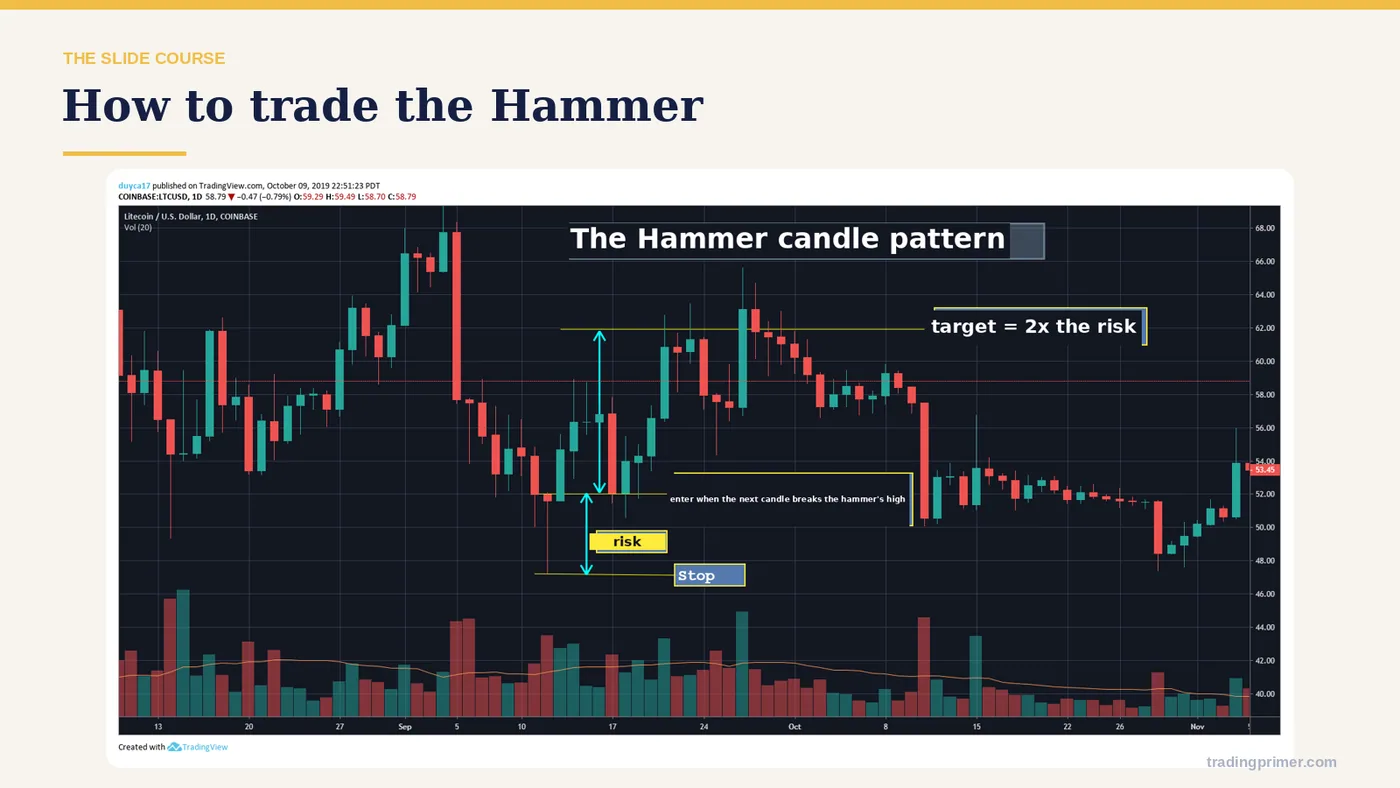
How to trade the Hammer — The entry rule is on the chart itself: the course marks where the entry sits, where the stop goes, and what the pattern has to do before the trade is valid. Read the markings before moving on.
Slide 14 of 72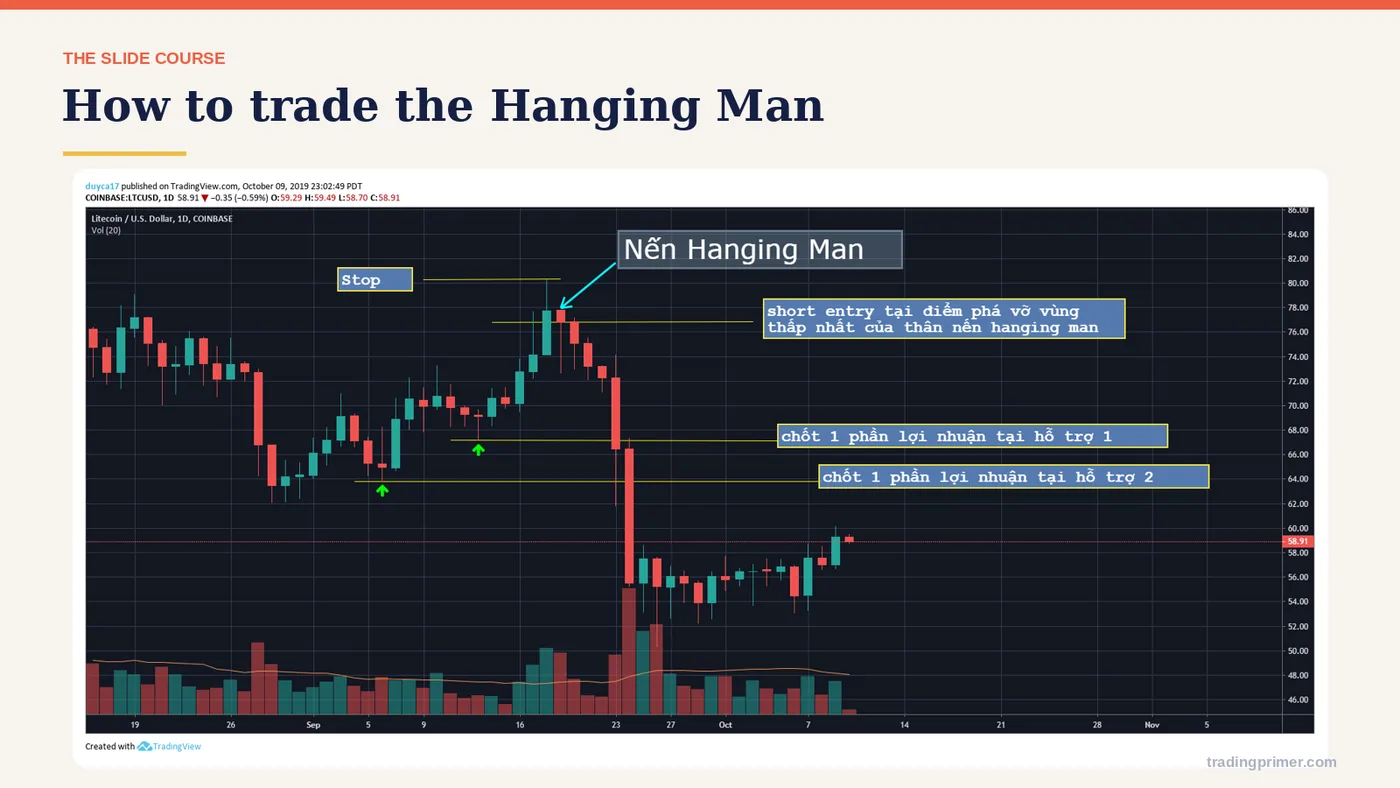
How to trade the Hanging Man — The entry rule is on the chart itself: the course marks where the entry sits, where the stop goes, and what the pattern has to do before the trade is valid. Read the markings before moving on.
Slide 15 of 72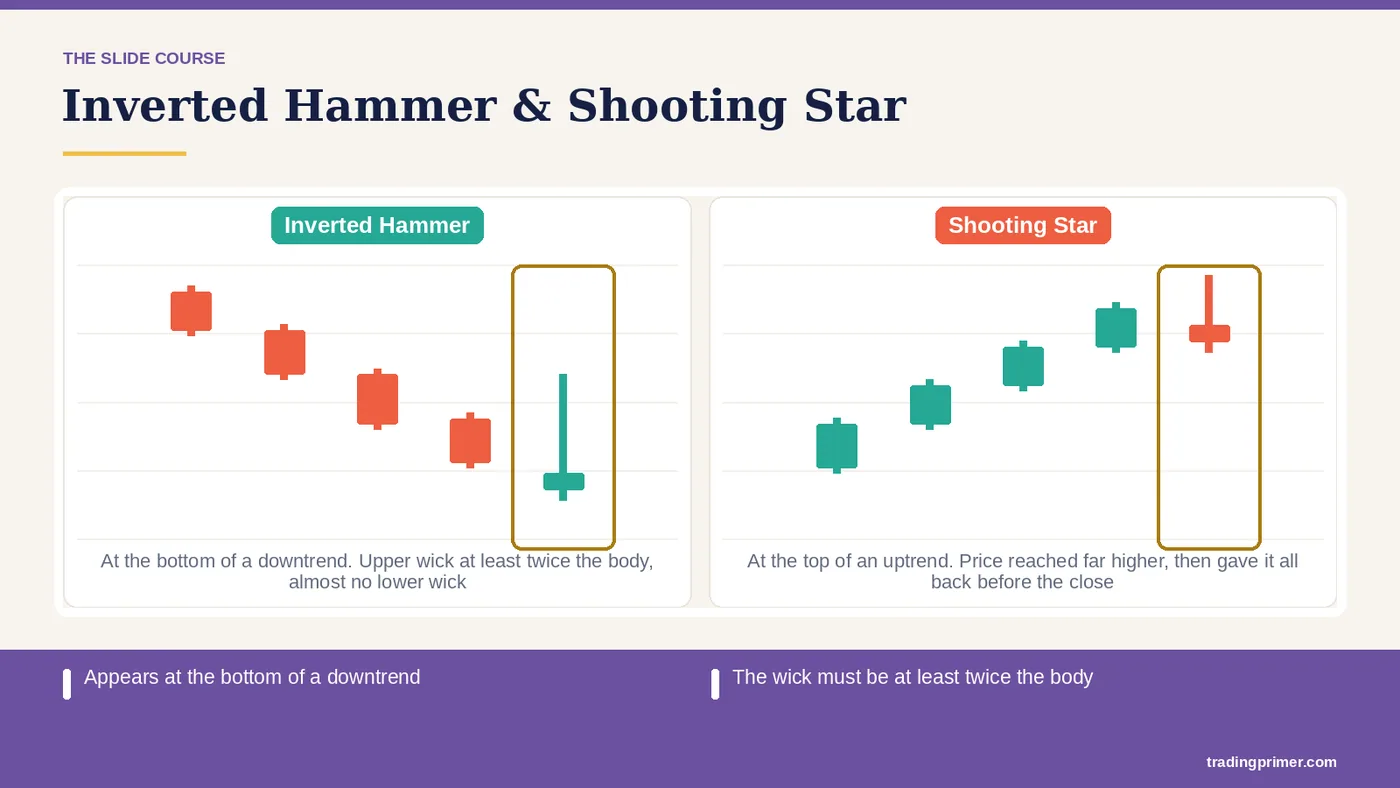
Appears at the bottom of a downtrend — The wick must be at least twice the body. The body may be red or green. Appears at the top of an uptrend. The long wick sits above the body. The candle usually closes red. Inverted Hammer. Shooting Star. Inverted Hammer / Shooting Star.
Slide 16 of 72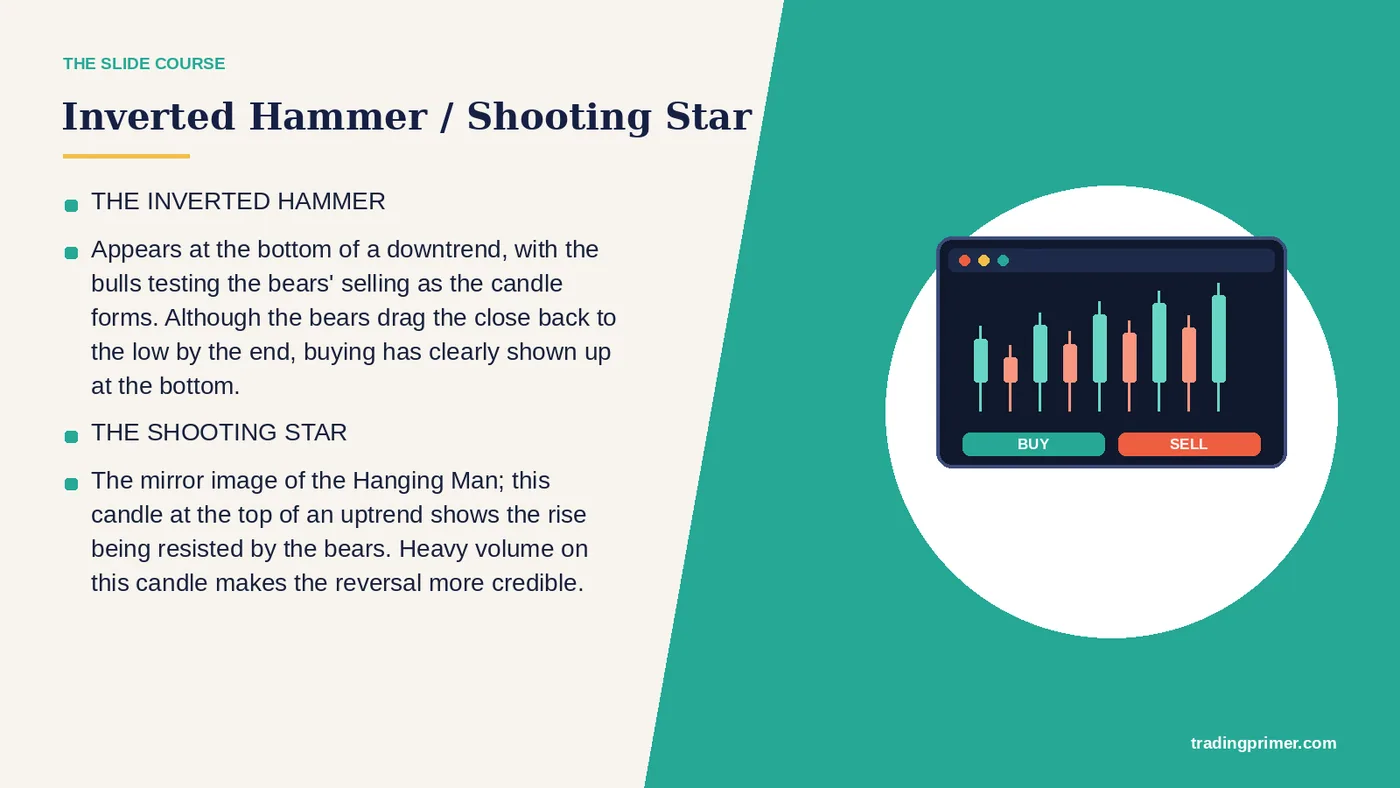
Inverted Hammer / Shooting Star — THE INVERTED HAMMER. Appears at the bottom of a downtrend, with the bulls testing the bears' selling as the candle forms. Although the bears drag the close back to the low by the end, buying has clearly shown up at the bottom. THE SHOOTING STAR. The mirror image of the Hanging Man; this candle at the top of an uptrend shows the rise being resisted by the bears. Heavy volume on this candle makes the reversal more credible.
Slide 17 of 72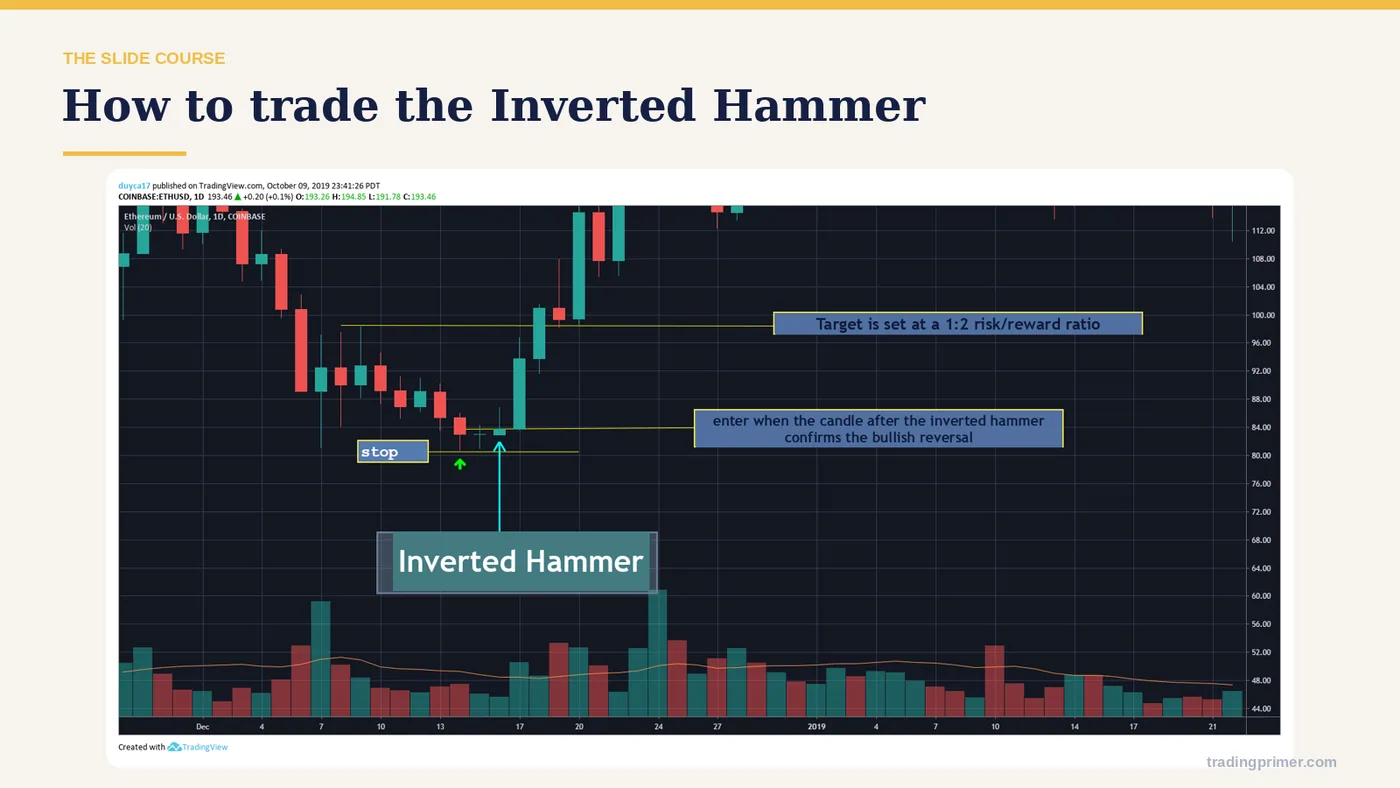
How to trade the Inverted Hammer — The entry rule is on the chart itself: the course marks where the entry sits, where the stop goes, and what the pattern has to do before the trade is valid. Read the markings before moving on.
Slide 18 of 72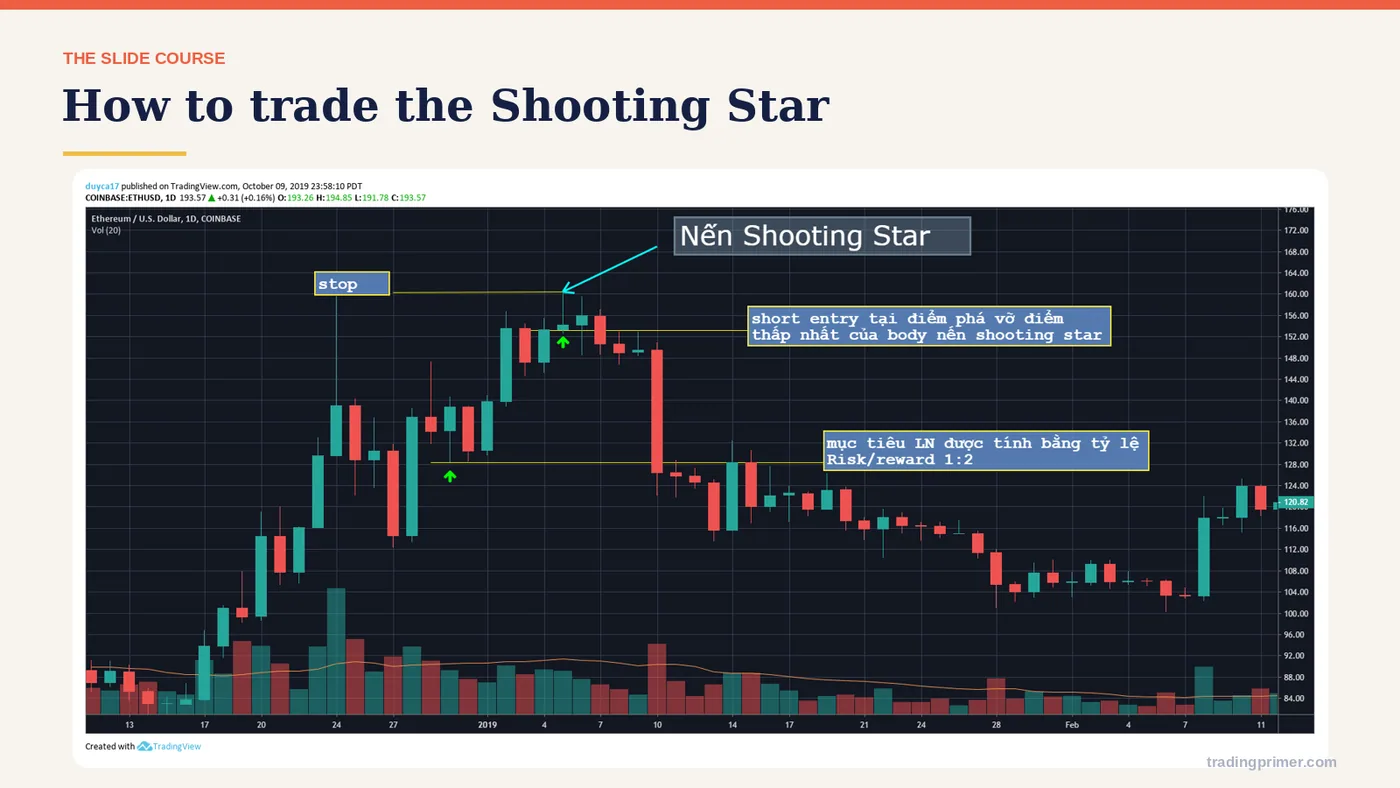
How to trade the Shooting Star — The entry rule is on the chart itself: the course marks where the entry sits, where the stop goes, and what the pattern has to do before the trade is valid. Read the markings before moving on.
Slide 19 of 72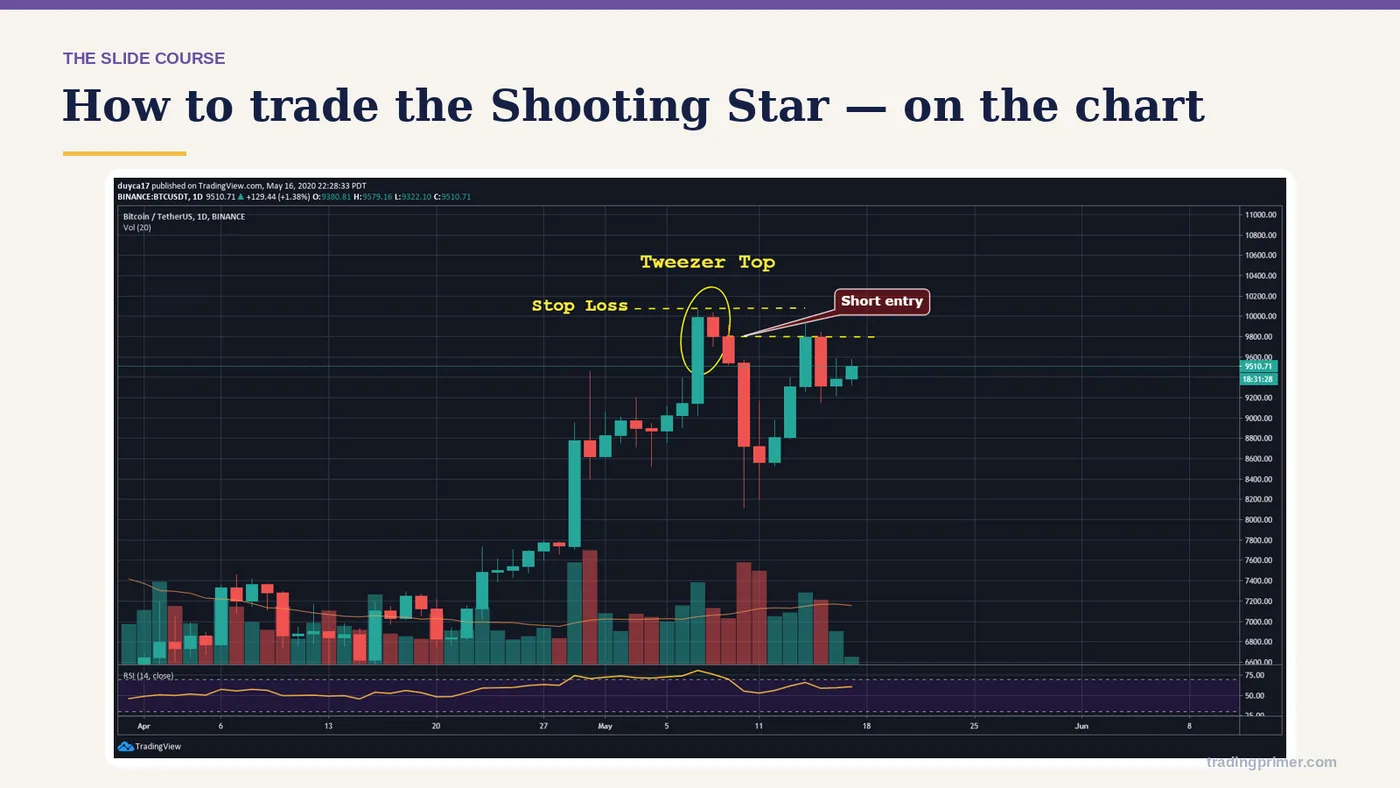
Appears at the bottom of a downtrend The wick must be at least twice the body The body may — a chart from the course deck. The markings on it are the lesson; read them left to right.
Slide 20 of 72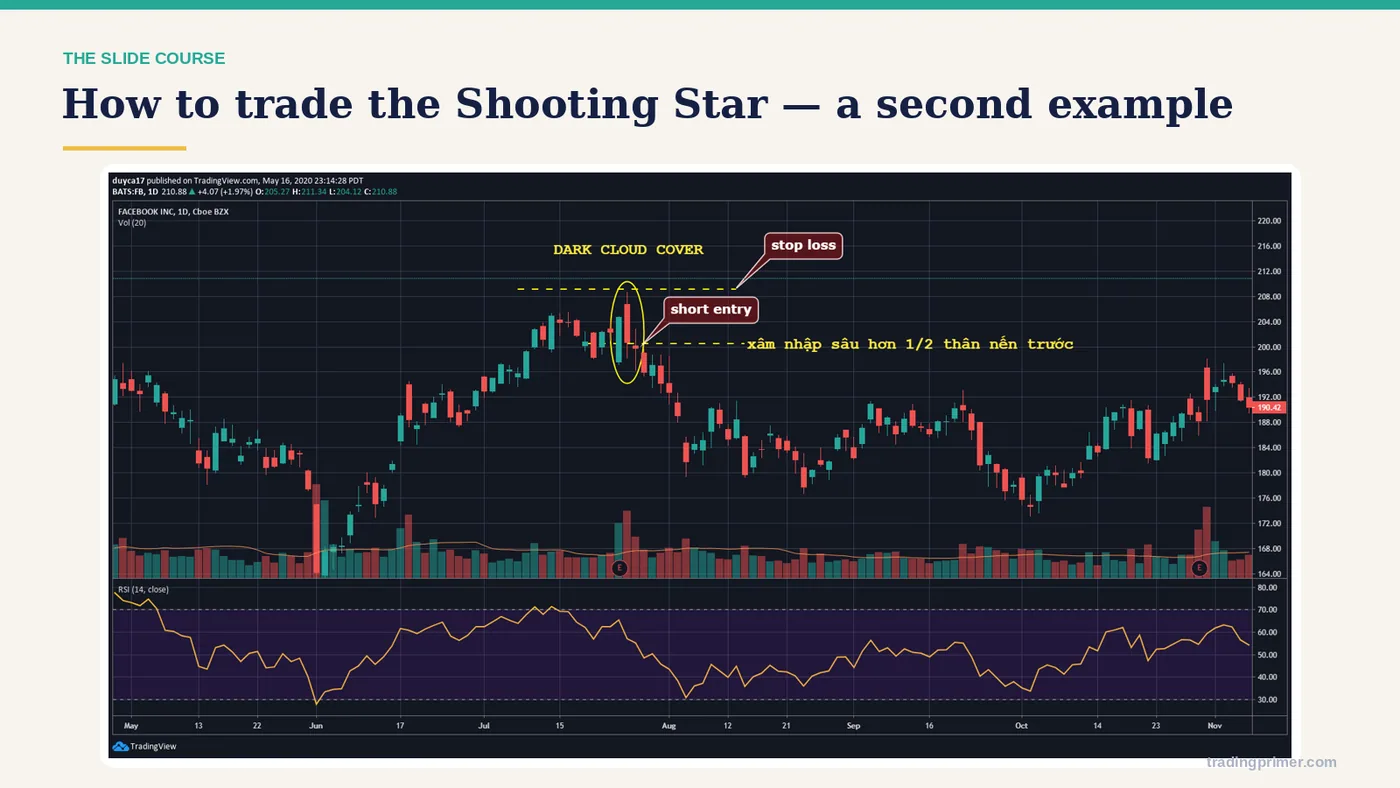
Appears at the bottom of a downtrend The wick must be at least twice the body The body may — a chart from the course deck. The markings on it are the lesson; read them left to right.
Slide 21 of 72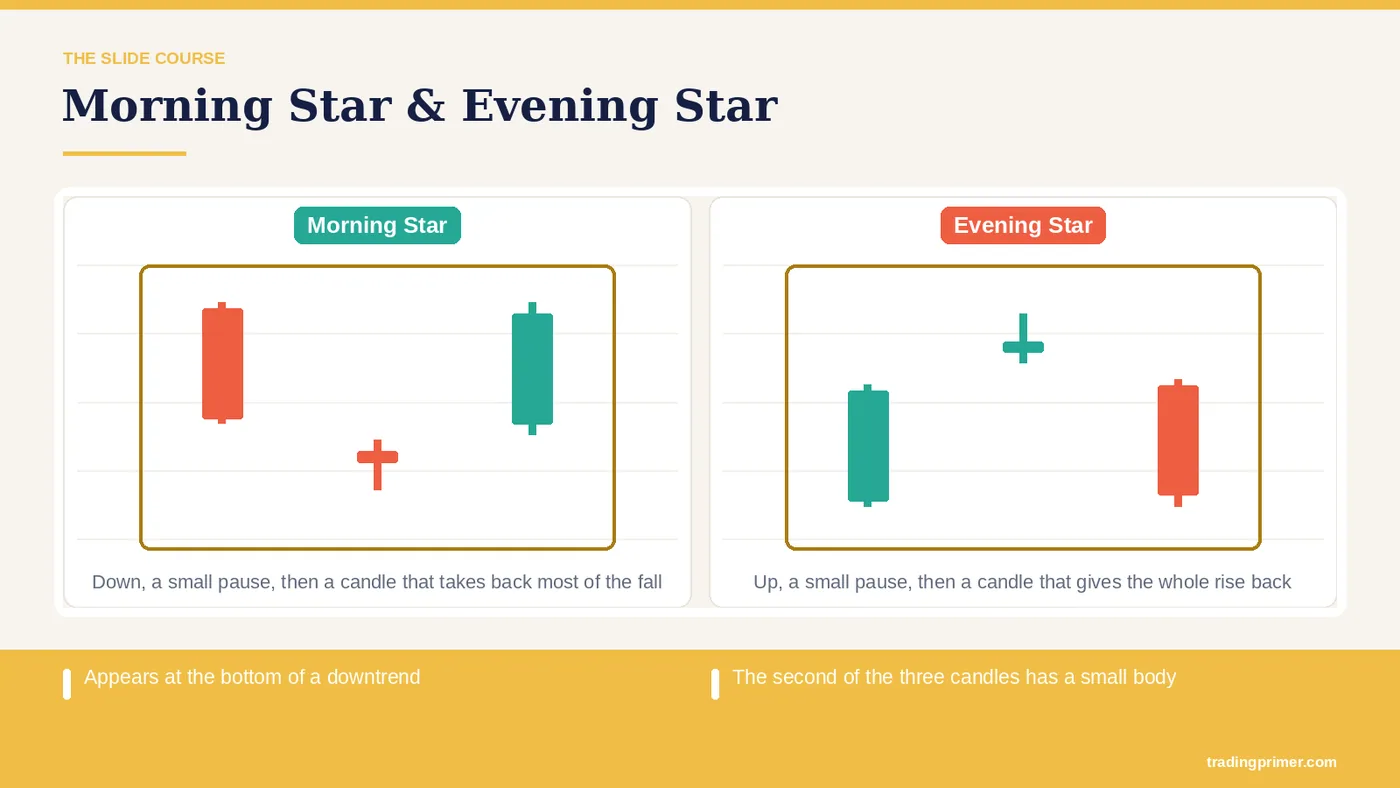
Appears at the bottom of a downtrend — The second of the three candles has a small body. The third candle then breaks the earlier downtrend completely. Appears at the top of an uptrend. The third candle then breaks the earlier uptrend completely. Evening star. Morning star. Morning Star – Evening Star.
Slide 22 of 72
MORNING STAR / EVENING STAR — (Morning star/Evening star). Both patterns show a market still trading in the direction it had already set. The Morning Star shows a market in a downtrend: the second candle keeps falling and makes a new low below the first, so selling pressure is real. But on the third and last candle of the pattern, the open jumps clean past the range of the second — the heavy selling no longer has the strength to drag the market lower, and control passes from the bears to the bulls.
Slide 23 of 72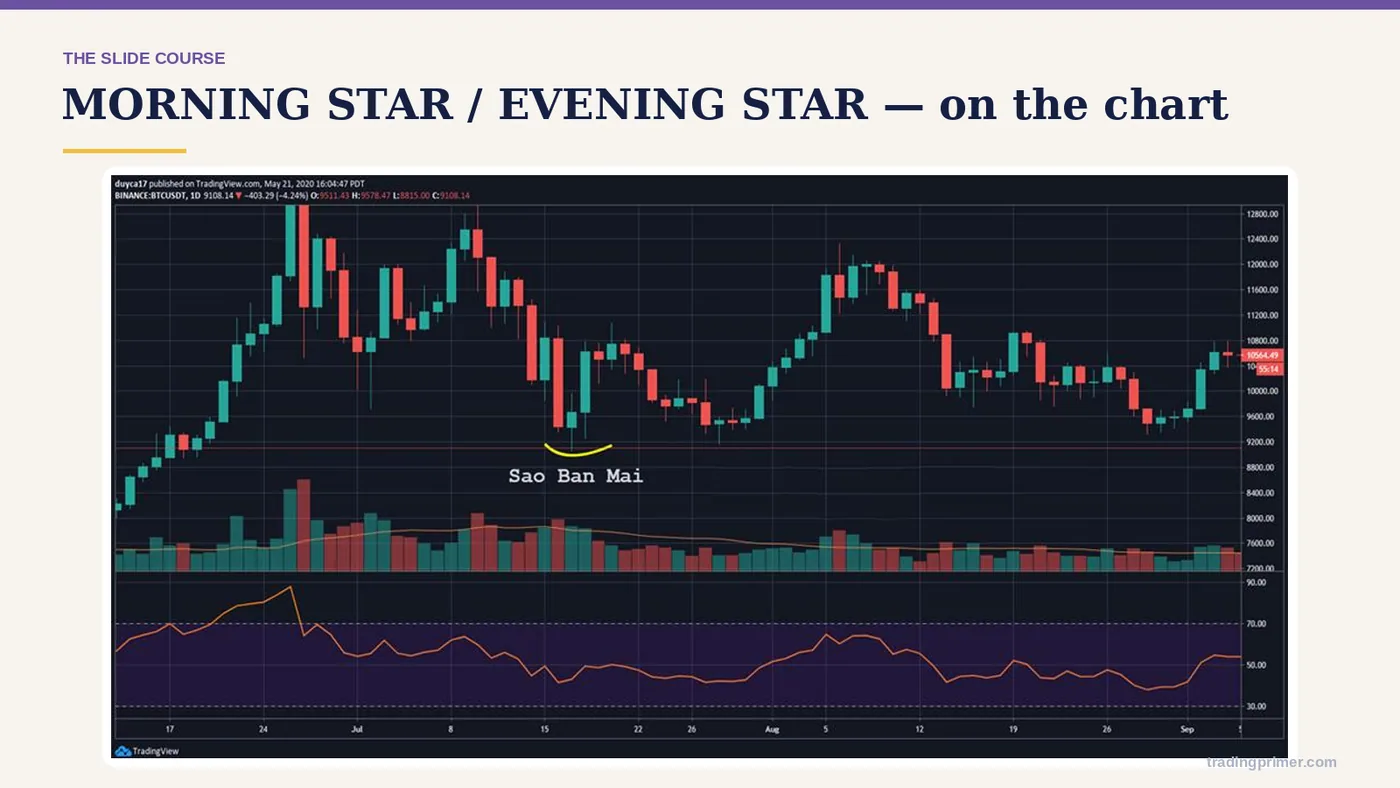
Appears at the bottom of a downtrend The second of the three candles has a small body The — a chart from the course deck. The markings on it are the lesson; read them left to right.
Slide 24 of 72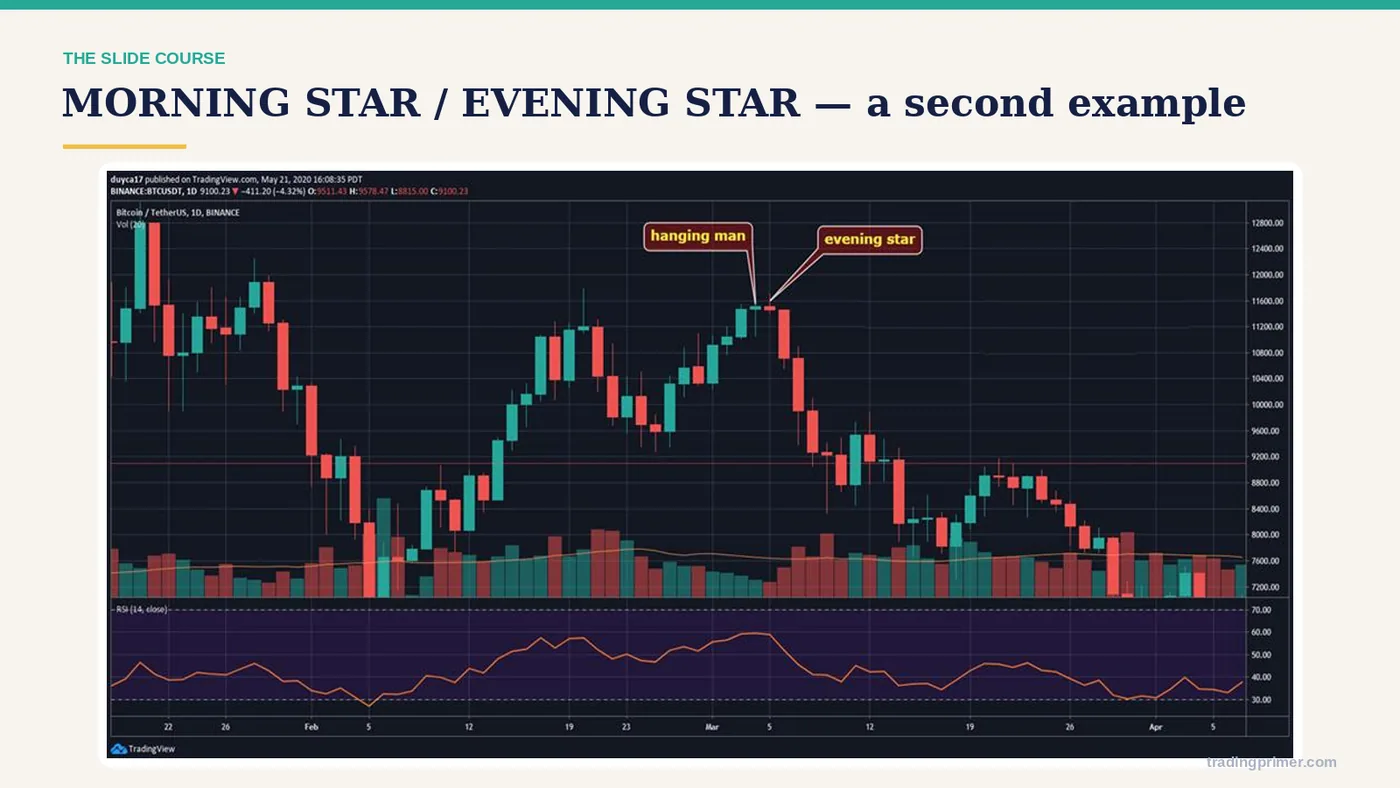
Appears at the bottom of a downtrend The second of the three candles has a small body The — a chart from the course deck. The markings on it are the lesson; read them left to right.
Slide 25 of 72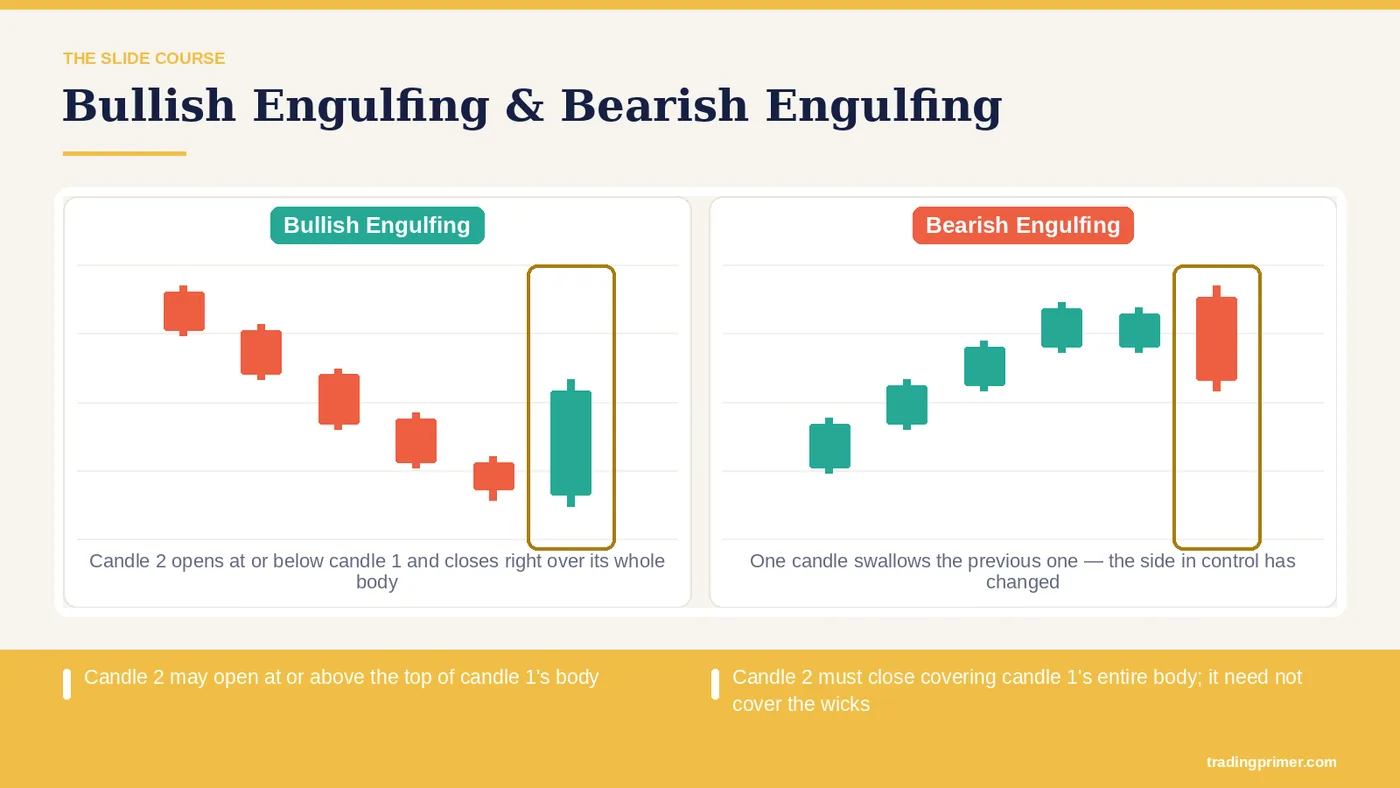
Candle 2 may open at or above the top of candle 1's body — Candle 2 must close covering candle 1's entire body; it need not cover the wicks. Sell volume must exceed the buy volume before it, showing selling pressure has overwhelmed buying. The market must be trending (uptrend or downtrend). Candle 2 may open at or below the bottom of candle 1's body. Candle 2 must close covering candle 1's entire body…. Buy volume must exceed candle 1's sell volume, showing buying pressure has overwhelmed selling. This pair works well on the 1H, 4H and 1D frames. Bearish Engulfing. Bullish Engulfing. Engulfing…
Slide 26 of 72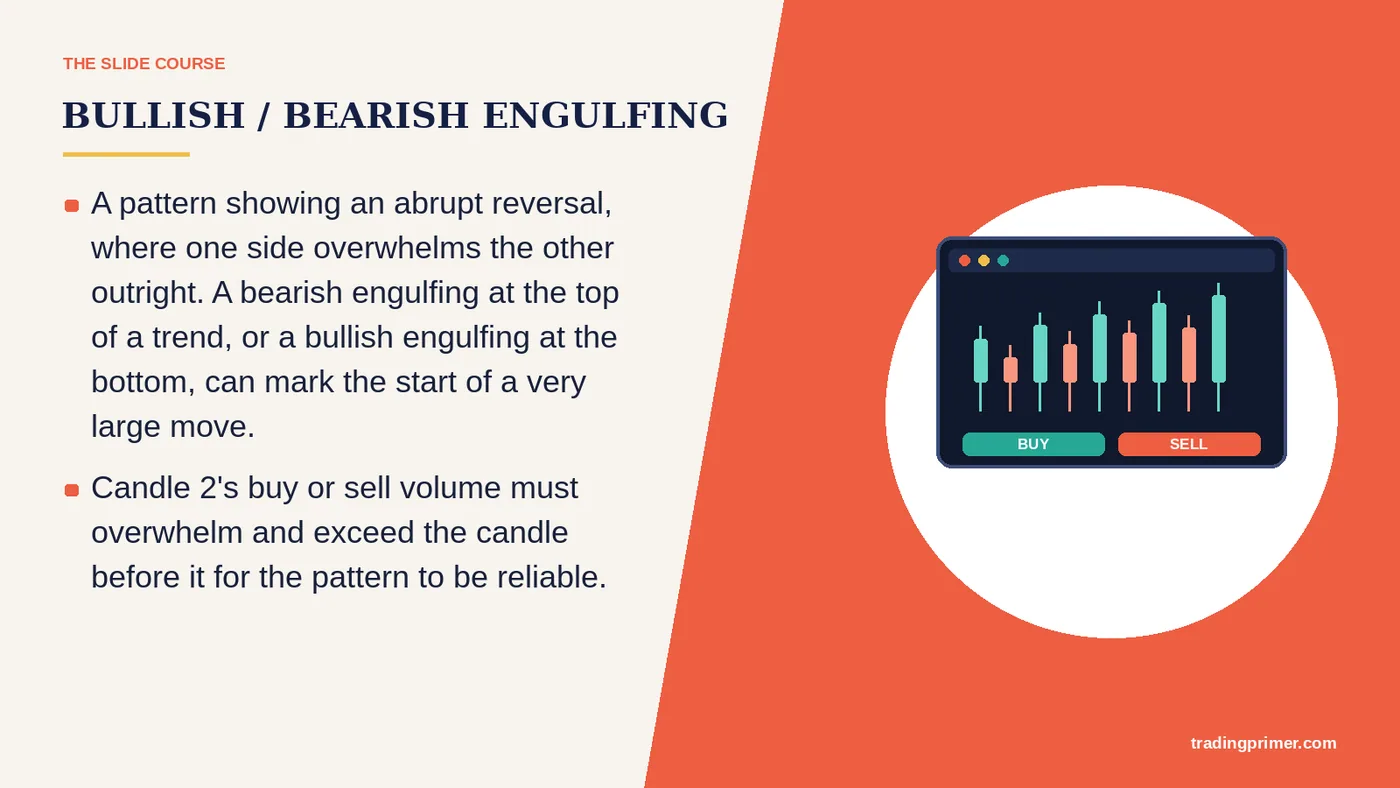
BULLISH / BEARISH ENGULFING — A pattern showing an abrupt reversal, where one side overwhelms the other outright. A bearish engulfing at the top of a trend, or a bullish engulfing at the bottom, can mark the start of a very large move. Candle 2's buy or sell volume must overwhelm and exceed the candle before it for the pattern to be reliable.
Slide 27 of 72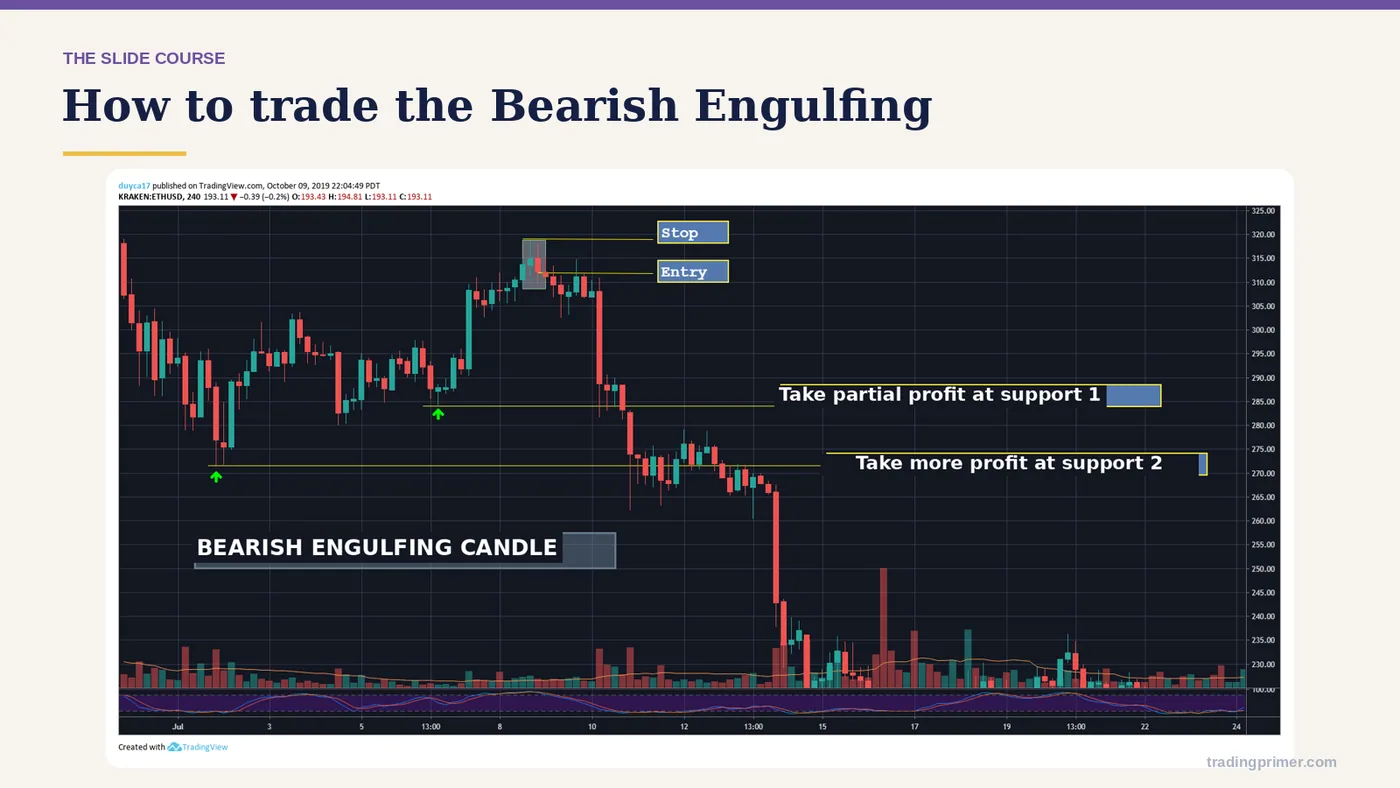
How to trade the Bearish Engulfing — The entry rule is on the chart itself: the course marks where the entry sits, where the stop goes, and what the pattern has to do before the trade is valid. Read the markings before moving on.
Slide 28 of 72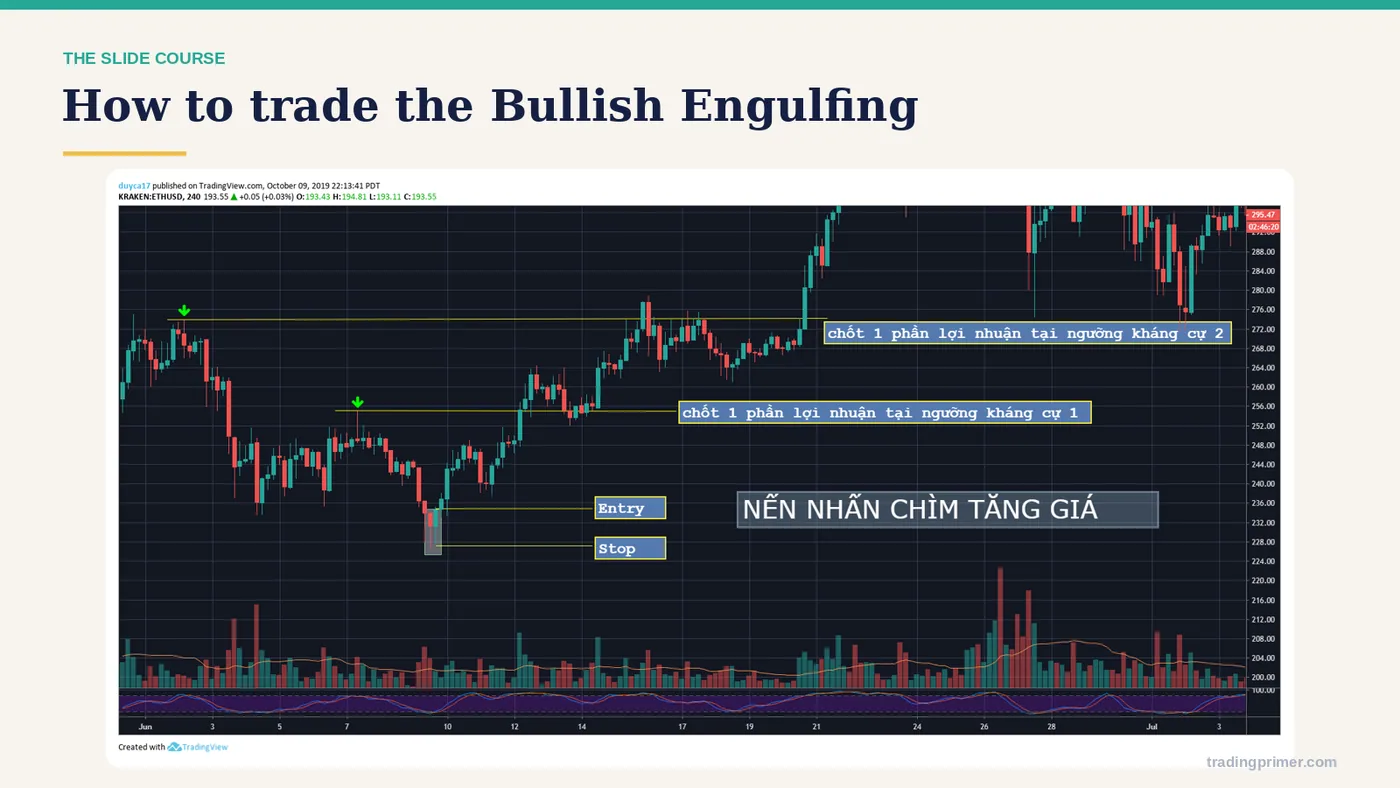
How to trade the Bullish Engulfing — The entry rule is on the chart itself: the course marks where the entry sits, where the stop goes, and what the pattern has to do before the trade is valid. Read the markings before moving on.
Slide 29 of 72
How to enter on a Bearish Engulfing — The entry rule is on the chart itself: the course marks where the entry sits, where the stop goes, and what the pattern has to do before the trade is valid. Read the markings before moving on.
Slide 30 of 72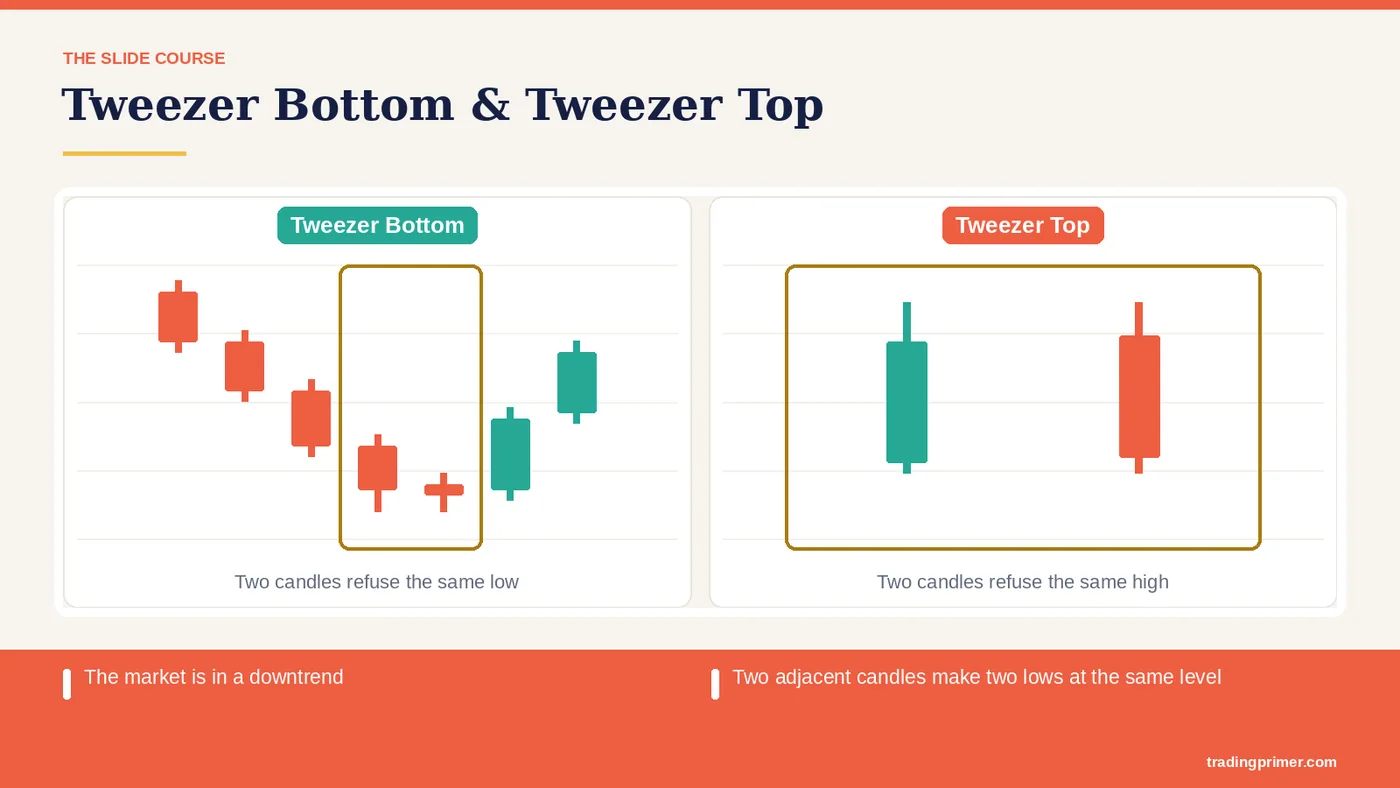
The market is in a downtrend — Two adjacent candles make two lows at the same level. Candle 1 is red, candle 2 is green. The market is in an uptrend. Two adjacent candles make two highs at the same level. Candle 1 is green, candle 2 is red. Tweezer tops and bottoms say that when the market reaches a given price (a high or a low), control passes between the bulls and the bears. Tweezer Bottoms. Tweezer Tops. Tweezer Tops/Bottoms. (Tweezer Top / Tweezer Bottom).
Slide 31 of 72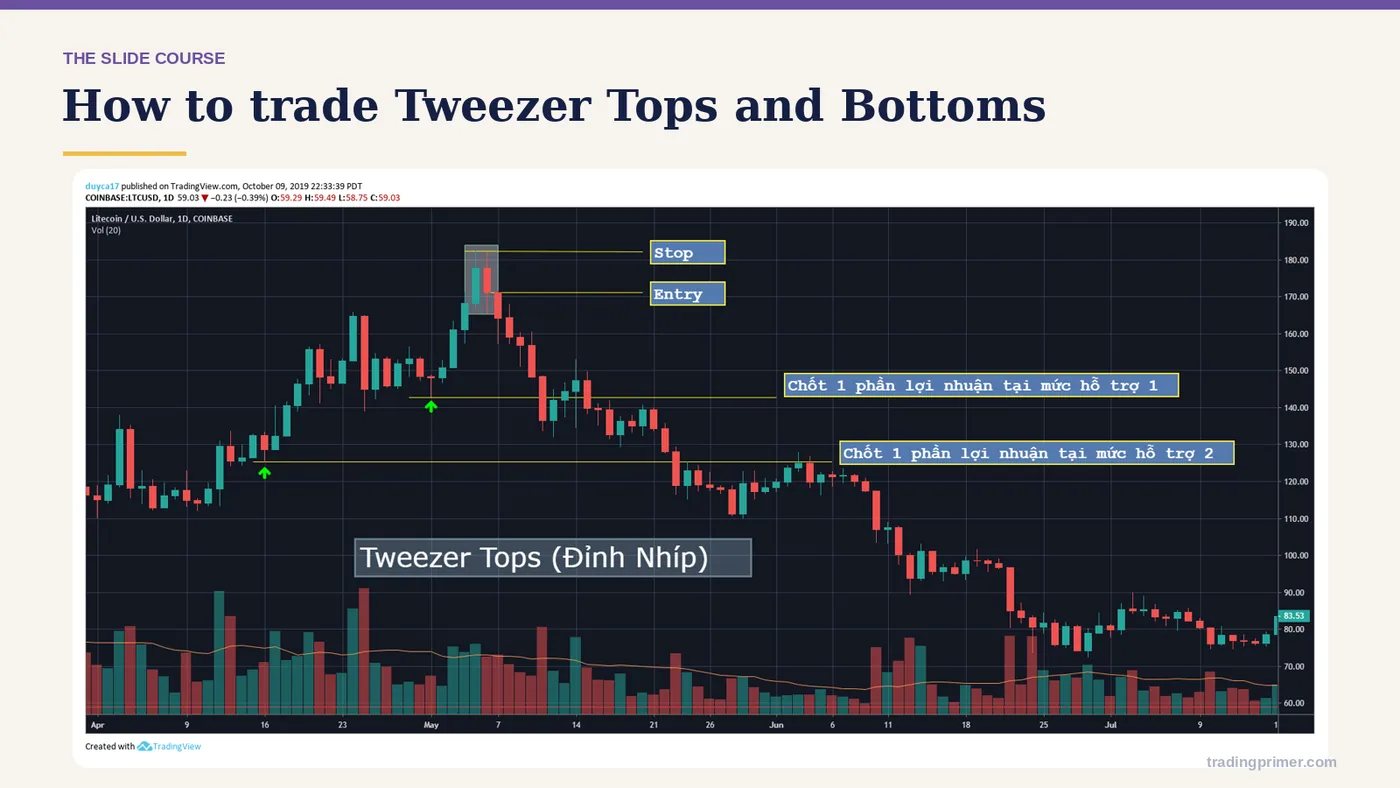
How to trade Tweezer Tops and Bottoms — The entry rule is on the chart itself: the course marks where the entry sits, where the stop goes, and what the pattern has to do before the trade is valid. Read the markings before moving on.
Slide 32 of 72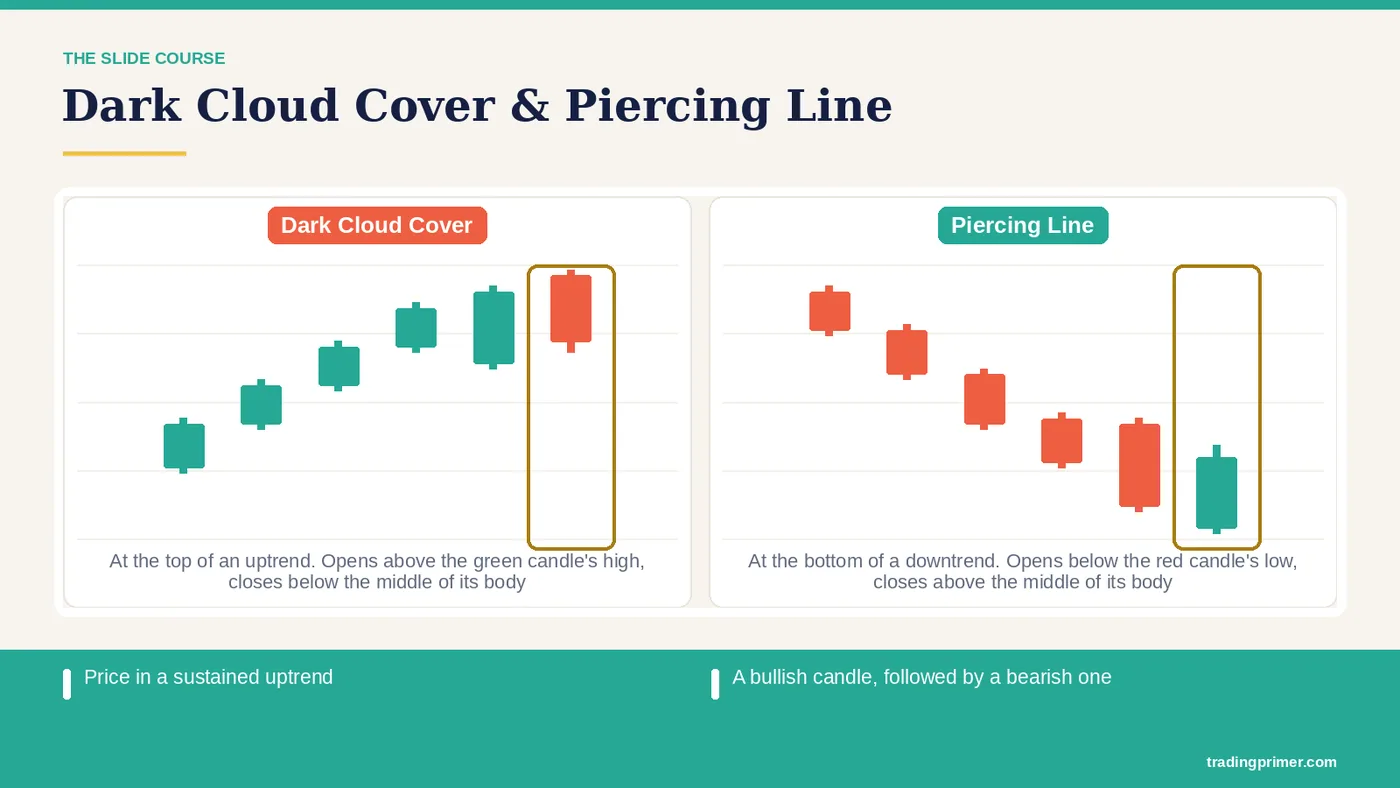
Price in a sustained uptrend — A bullish candle, followed by a bearish one. The bearish candle must close at least 50% into the bullish candle. Price in a sustained downtrend. A bearish candle, followed by a bullish one. The bullish candle must close at least 50% into the bearish candle. Dark cloud cover. Piercing pattern. Dark Cloud Cover / Piercing Line.
Slide 33 of 72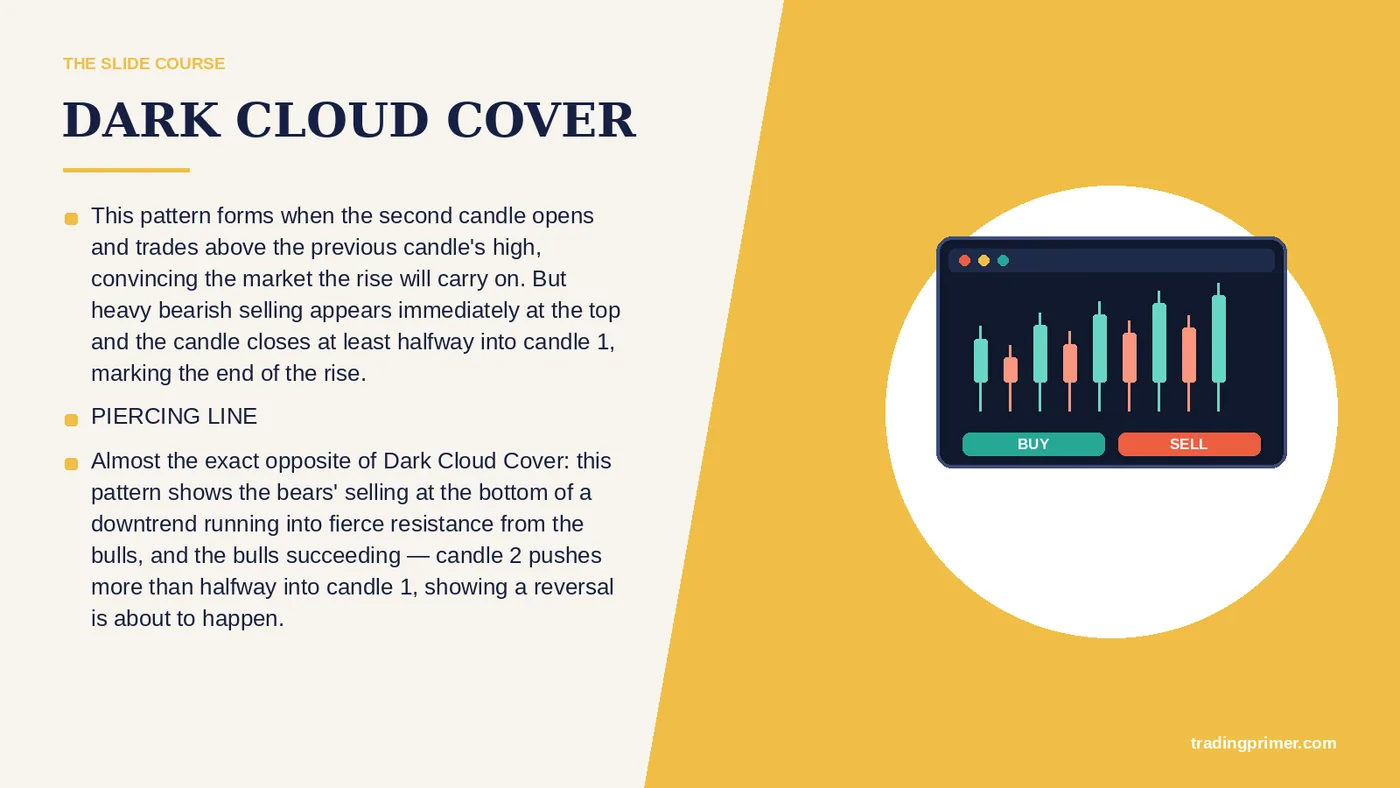
DARK CLOUD COVER — This pattern forms when the second candle opens and trades above the previous candle's high, convincing the market the rise will carry on. But heavy bearish selling appears immediately at the top and the candle closes at least halfway into candle 1, marking the end of the rise. PIERCING LINE. Almost the exact opposite of Dark Cloud Cover: this pattern shows the bears' selling at the bottom of a downtrend running into fierce resistance from the bulls, and the bulls succeeding — candle 2 pushes more than halfway into candle 1, showing a reversal…
Slide 34 of 72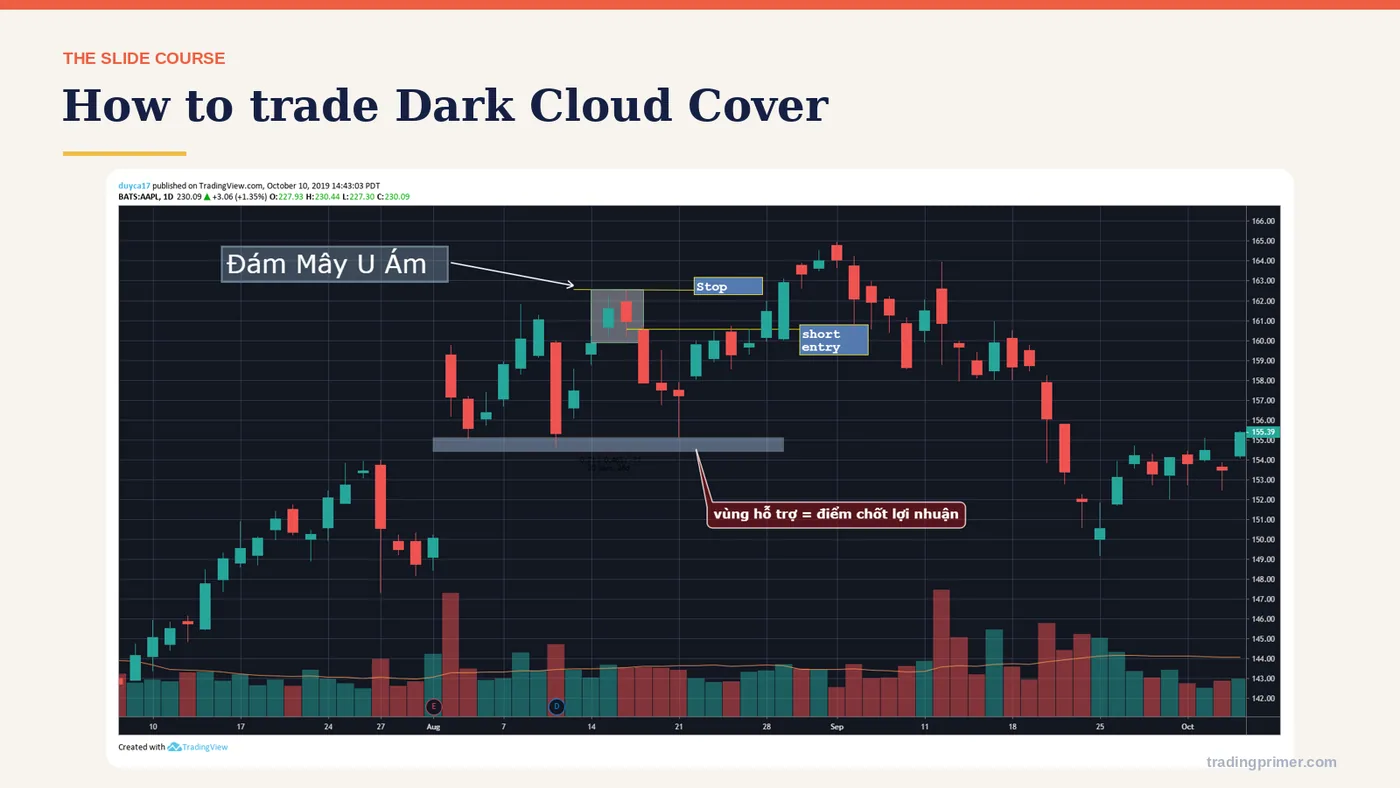
How to trade Dark Cloud Cover — The entry rule is on the chart itself: the course marks where the entry sits, where the stop goes, and what the pattern has to do before the trade is valid. Read the markings before moving on.
Slide 35 of 72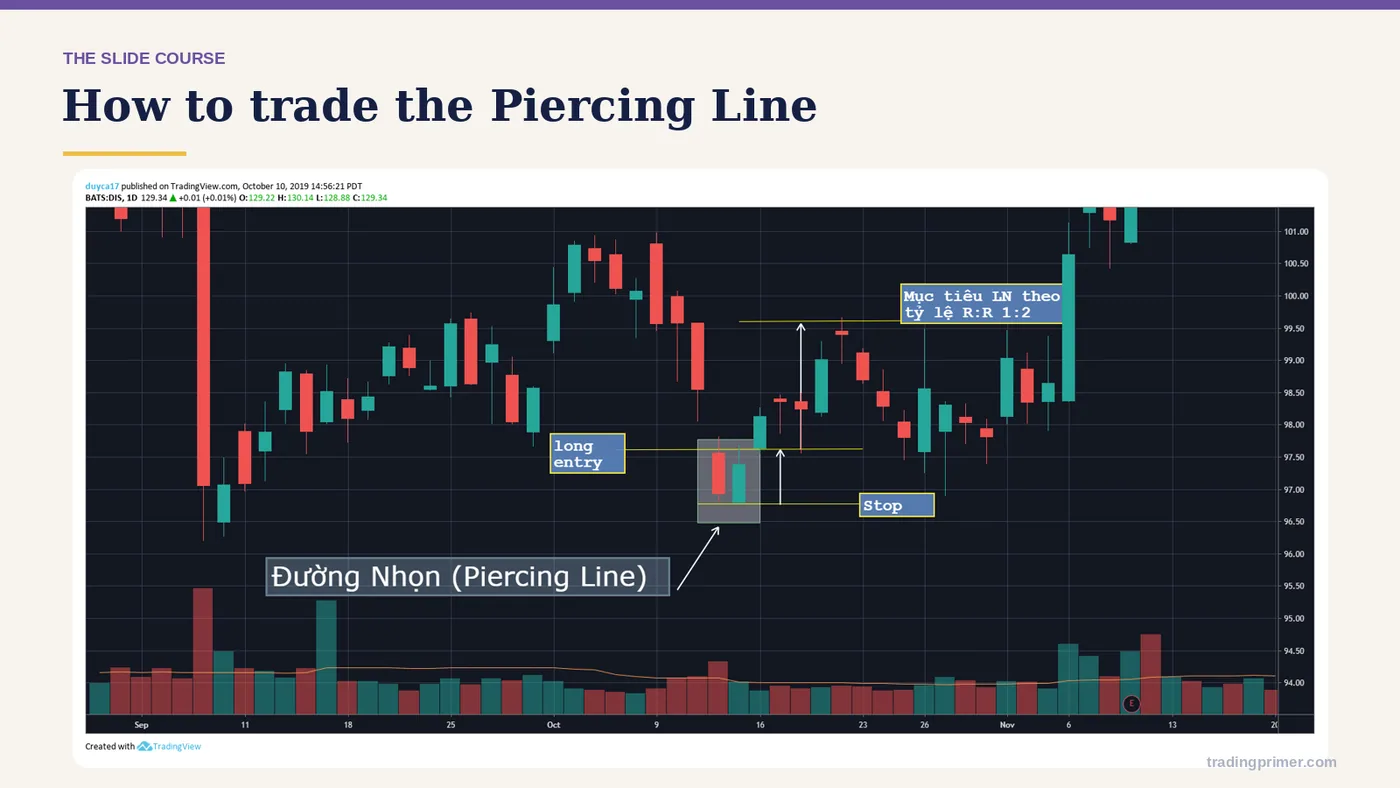
How to trade the Piercing Line — The entry rule is on the chart itself: the course marks where the entry sits, where the stop goes, and what the pattern has to do before the trade is valid. Read the markings before moving on.
Slide 36 of 72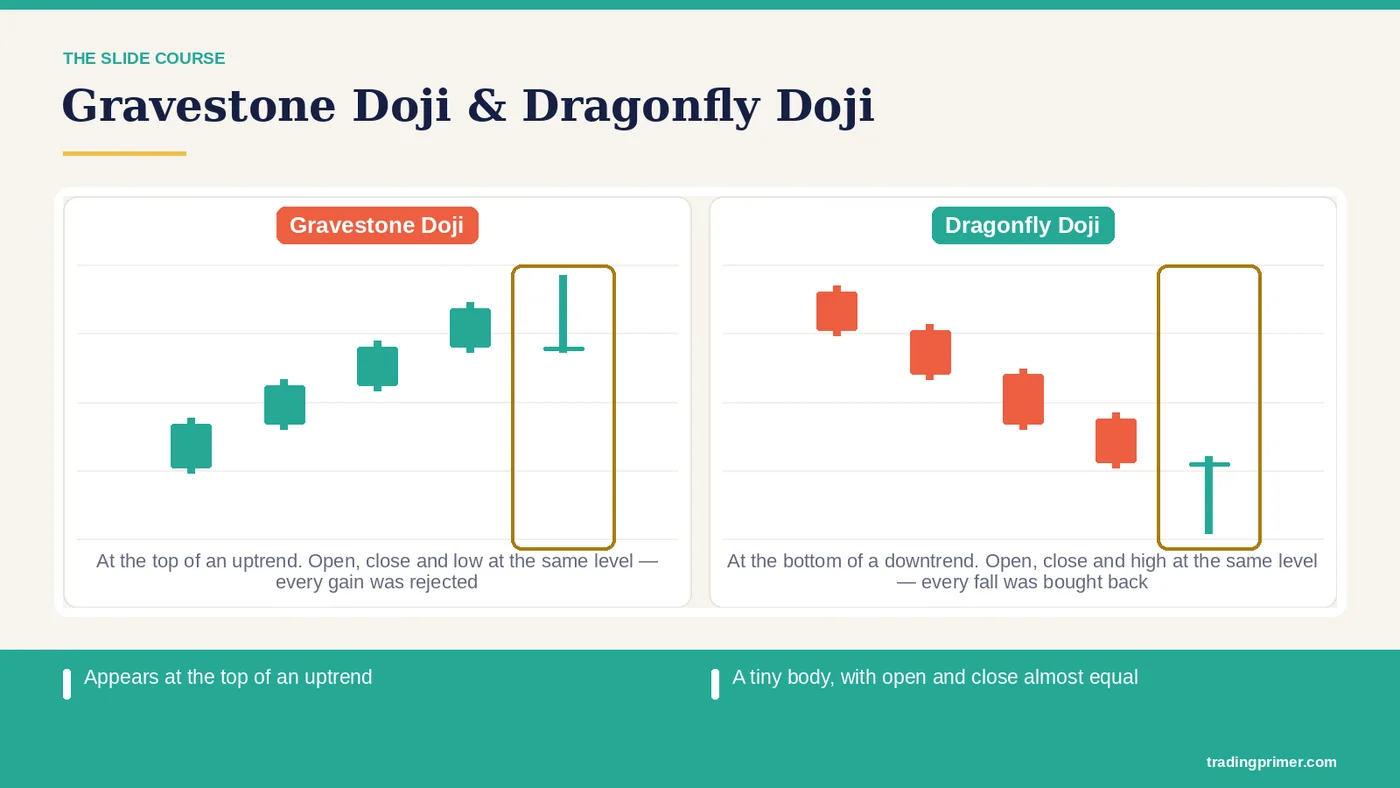
Appears at the top of an uptrend — A tiny body, with open and close almost equal. Almost no lower wick. Appears at the bottom of a downtrend. Almost no upper wick. Dragonfly doji. Gravestone doji. Gravestone Doji / Dragonfly Doji. (Gravestone doji – Dragonfly doji).
Slide 37 of 72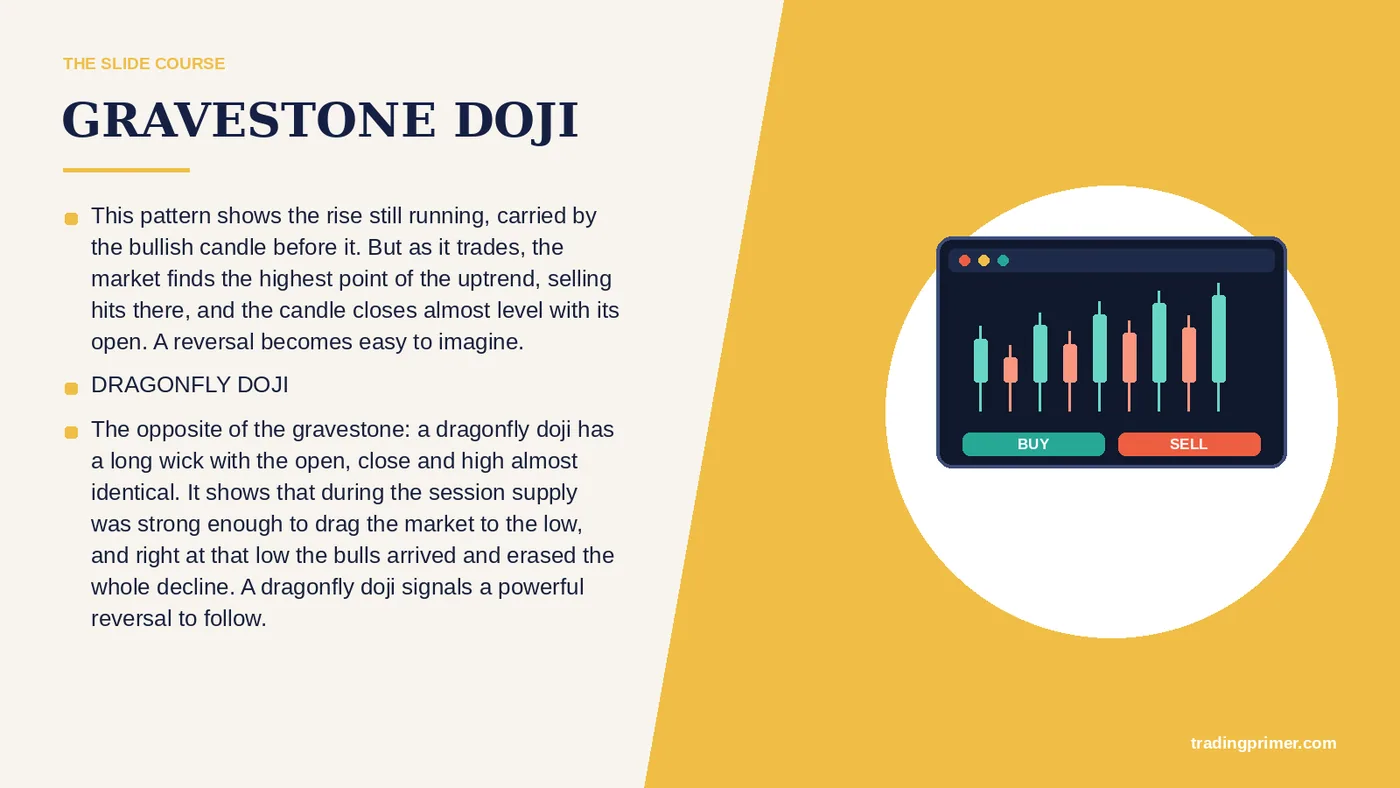
GRAVESTONE DOJI — This pattern shows the rise still running, carried by the bullish candle before it. But as it trades, the market finds the highest point of the uptrend, selling hits there, and the candle closes almost level with its open. A reversal becomes easy to imagine. DRAGONFLY DOJI. The opposite of the gravestone: a dragonfly doji has a long wick with the open, close and high almost identical. It shows that during the session supply was strong enough to drag the market to the low, and right at that low the bulls arrived and erased the whole decline. A…
Slide 38 of 72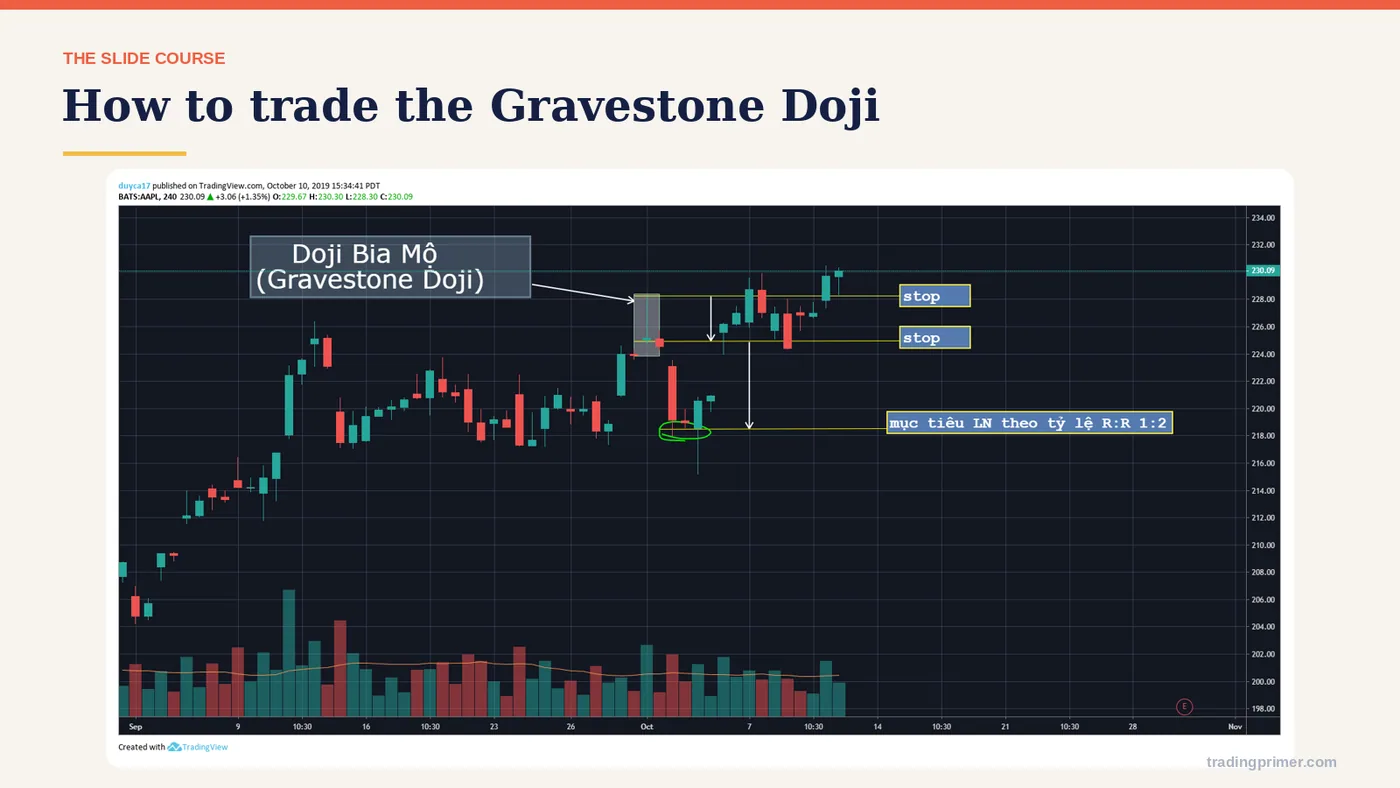
How to trade the Gravestone Doji — The entry rule is on the chart itself: the course marks where the entry sits, where the stop goes, and what the pattern has to do before the trade is valid. Read the markings before moving on.
Slide 39 of 72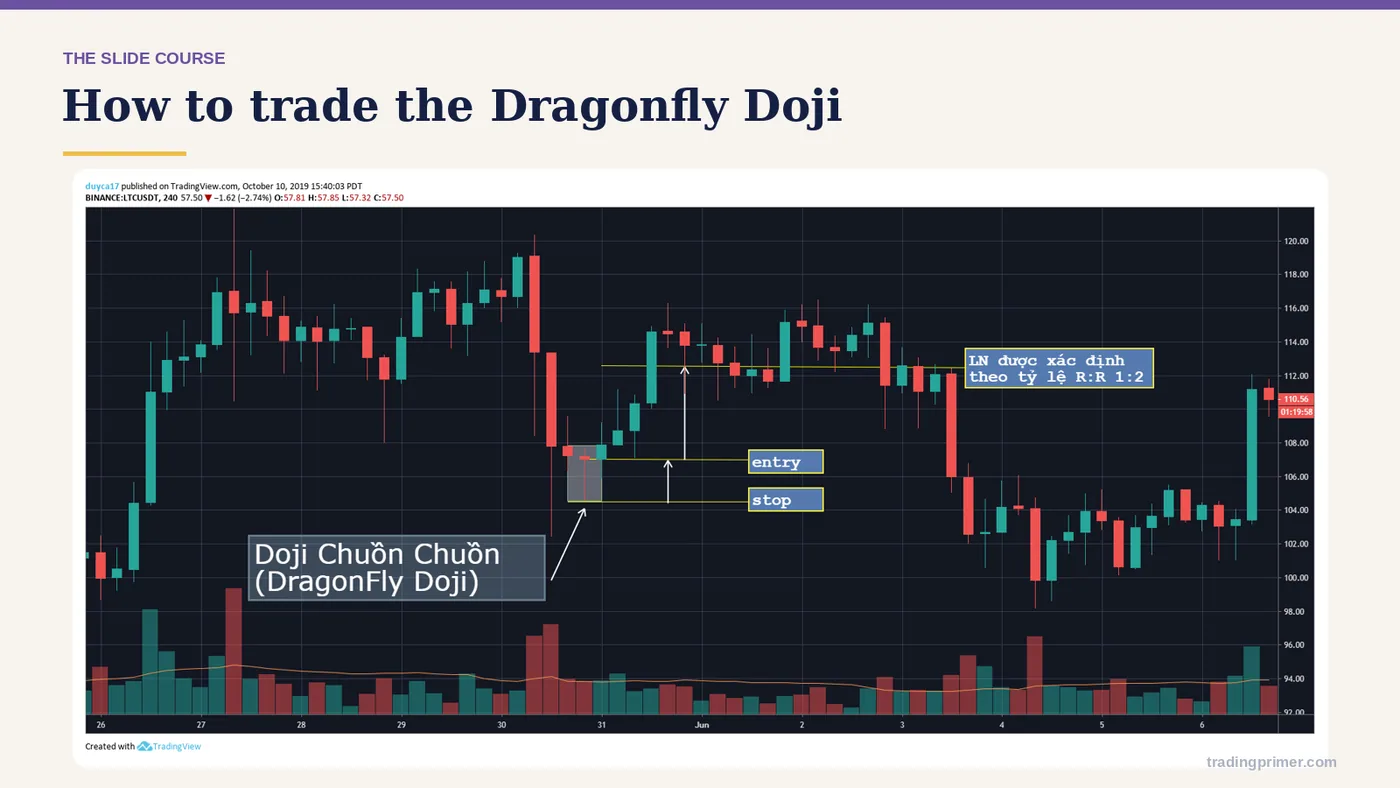
How to trade the Dragonfly Doji — The entry rule is on the chart itself: the course marks where the entry sits, where the stop goes, and what the pattern has to do before the trade is valid. Read the markings before moving on.
Slide 40 of 72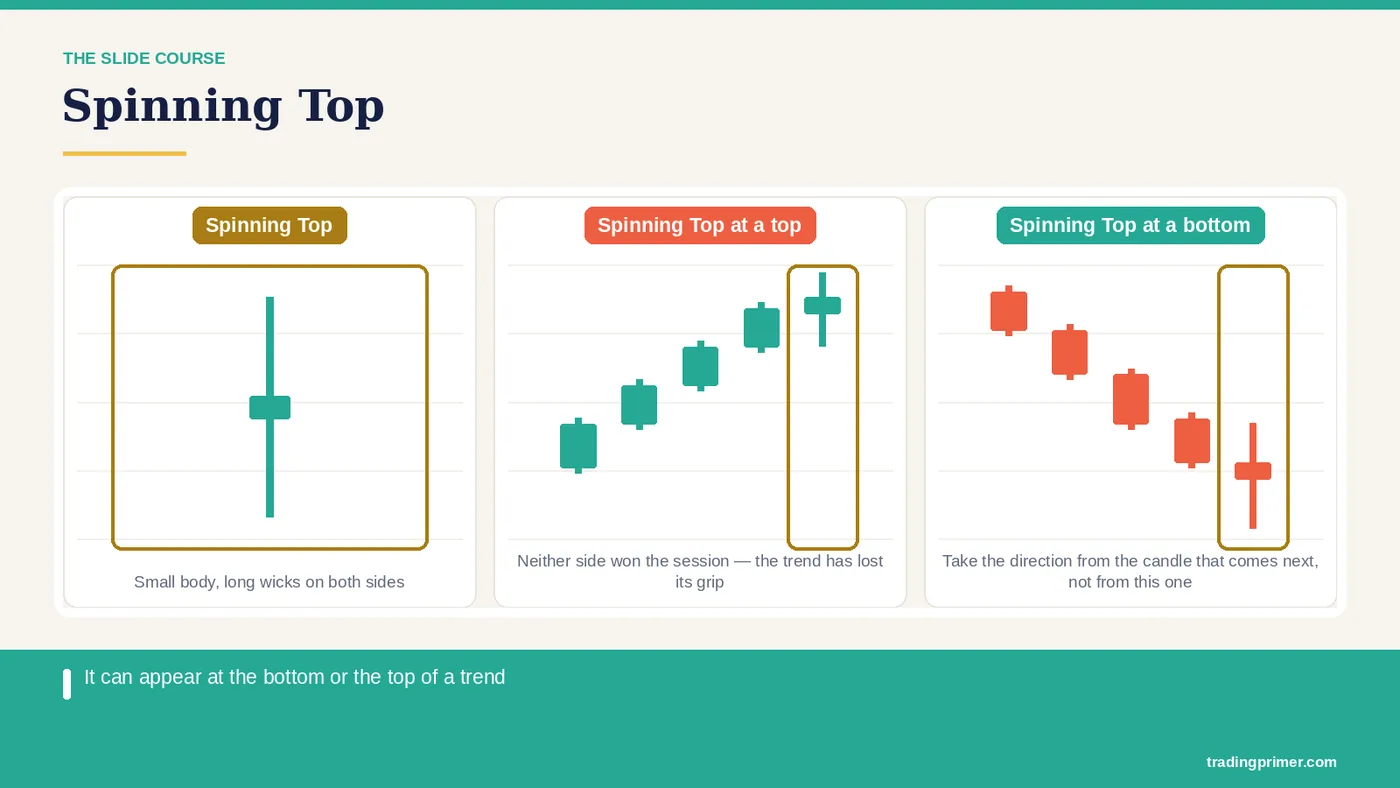
The bears try to push price well below the low of the candle before it, but run into fierce resistance from the bulls — The bulls try to push price well above the high of the candle before it, but run into fierce resistance from the bears. Spinning Top at the bottom. Spinning Top on the top. A single-candle structure. It can appear at the bottom or the top of a trend. Upper and lower wicks are almost equal — neither the bears nor the bulls are in control. The candle may be green or red. Spinning tops. Spinning top.
Slide 41 of 72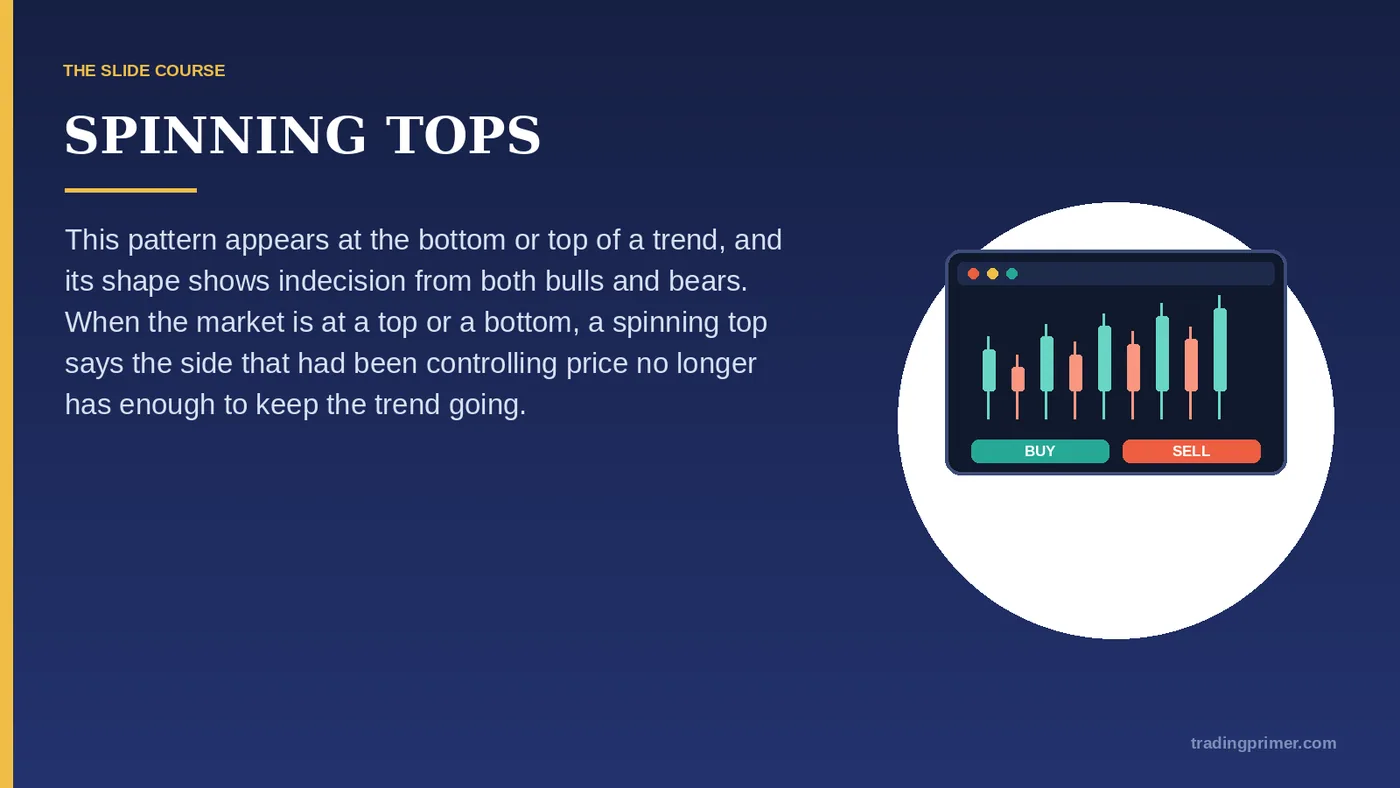
SPINNING TOPS — This pattern appears at the bottom or top of a trend, and its shape shows indecision from both bulls and bears. When the market is at a top or a bottom, a spinning top says the side that had been controlling price no longer has enough to keep the trend going.
Slide 42 of 72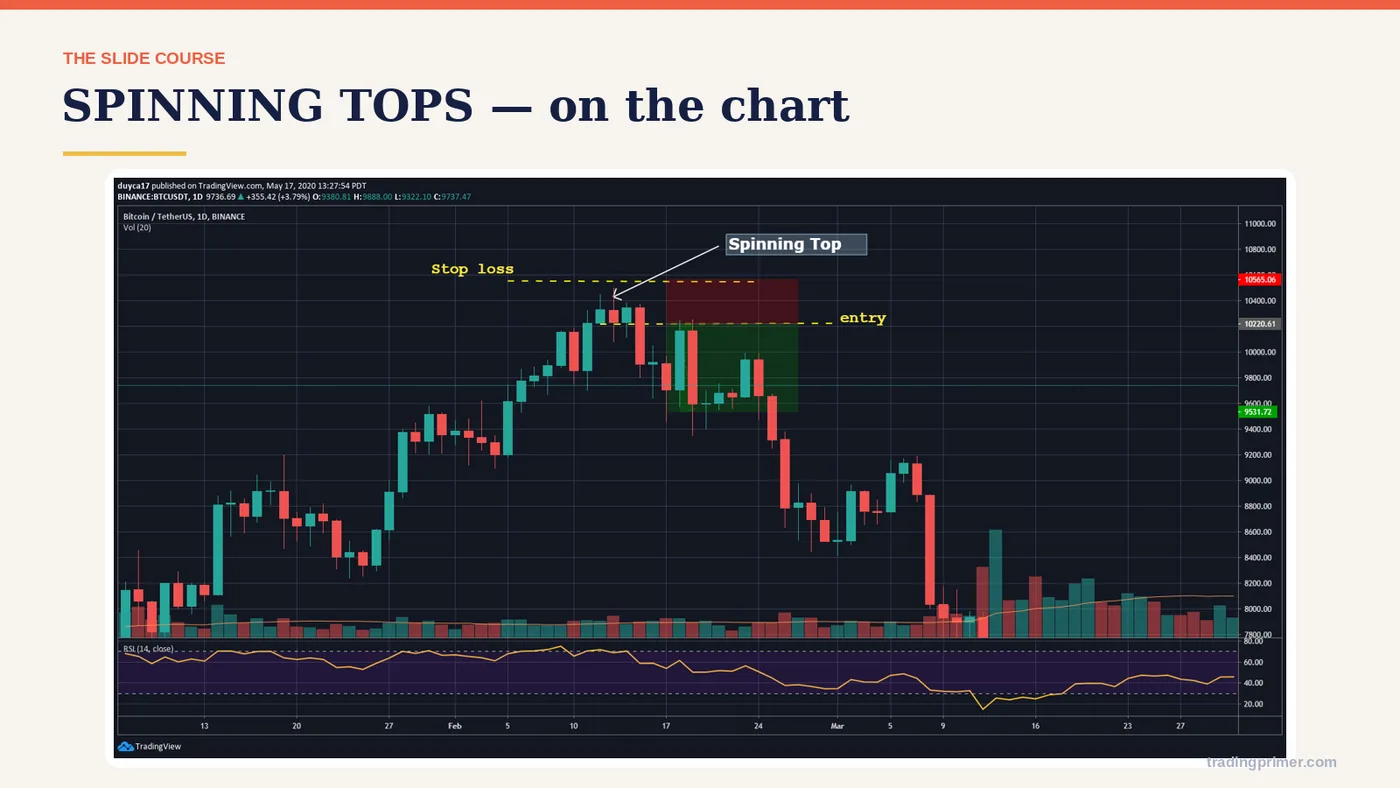
The bears try to push price well below the low of the candle before it, but run into fierc — a chart from the course deck. The markings on it are the lesson; read them left to right.
Slide 43 of 72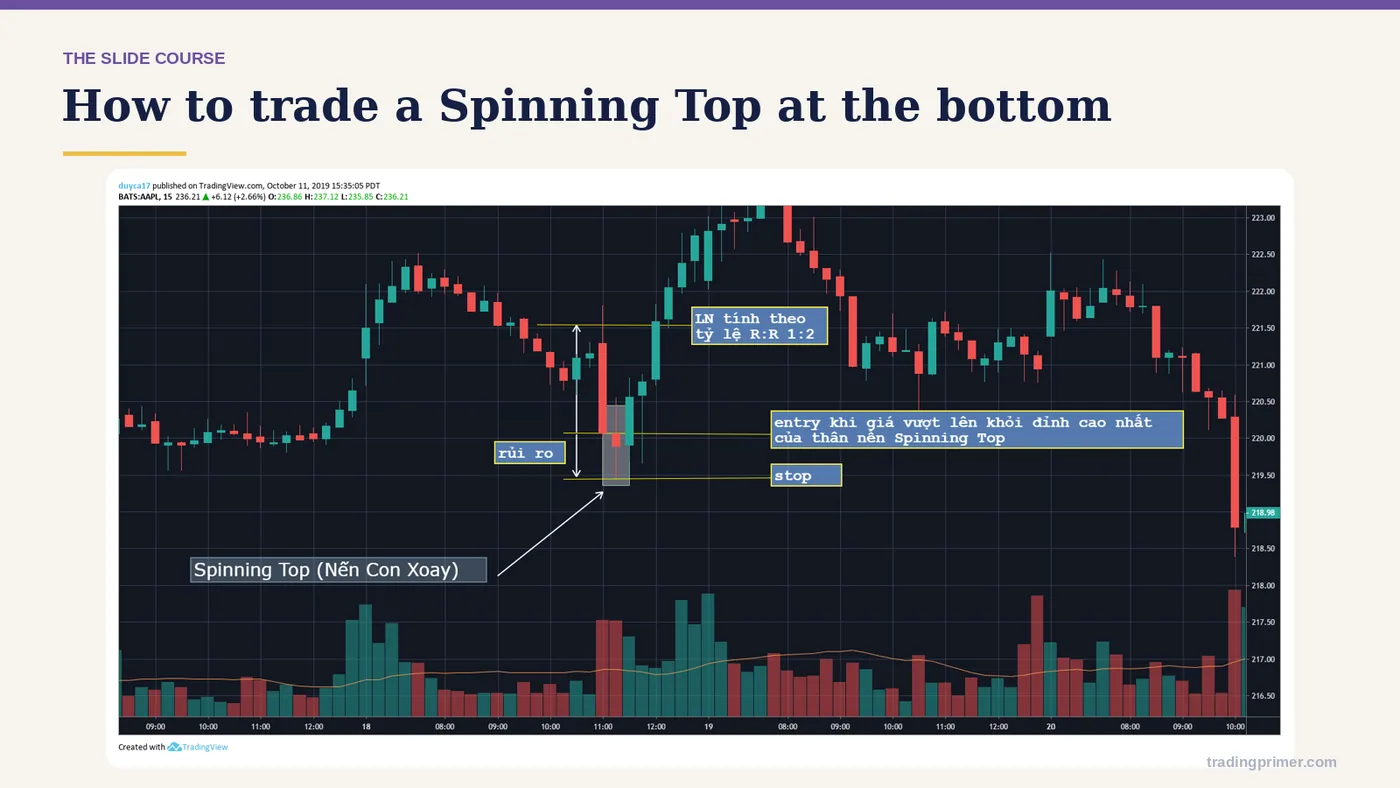
How to trade a Spinning Top — at the bottom.
Slide 44 of 72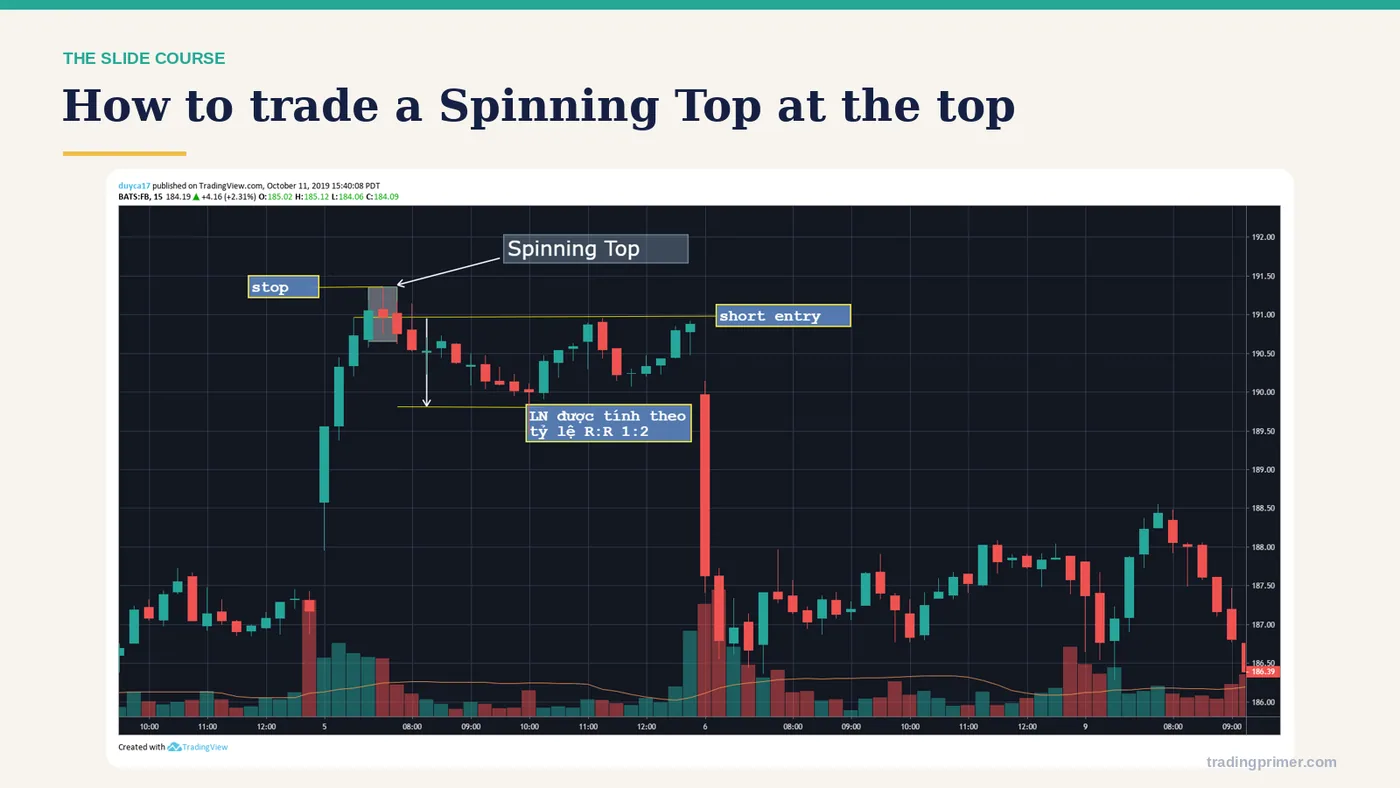
How to trade a Spinning Top — at the top.
Slide 45 of 72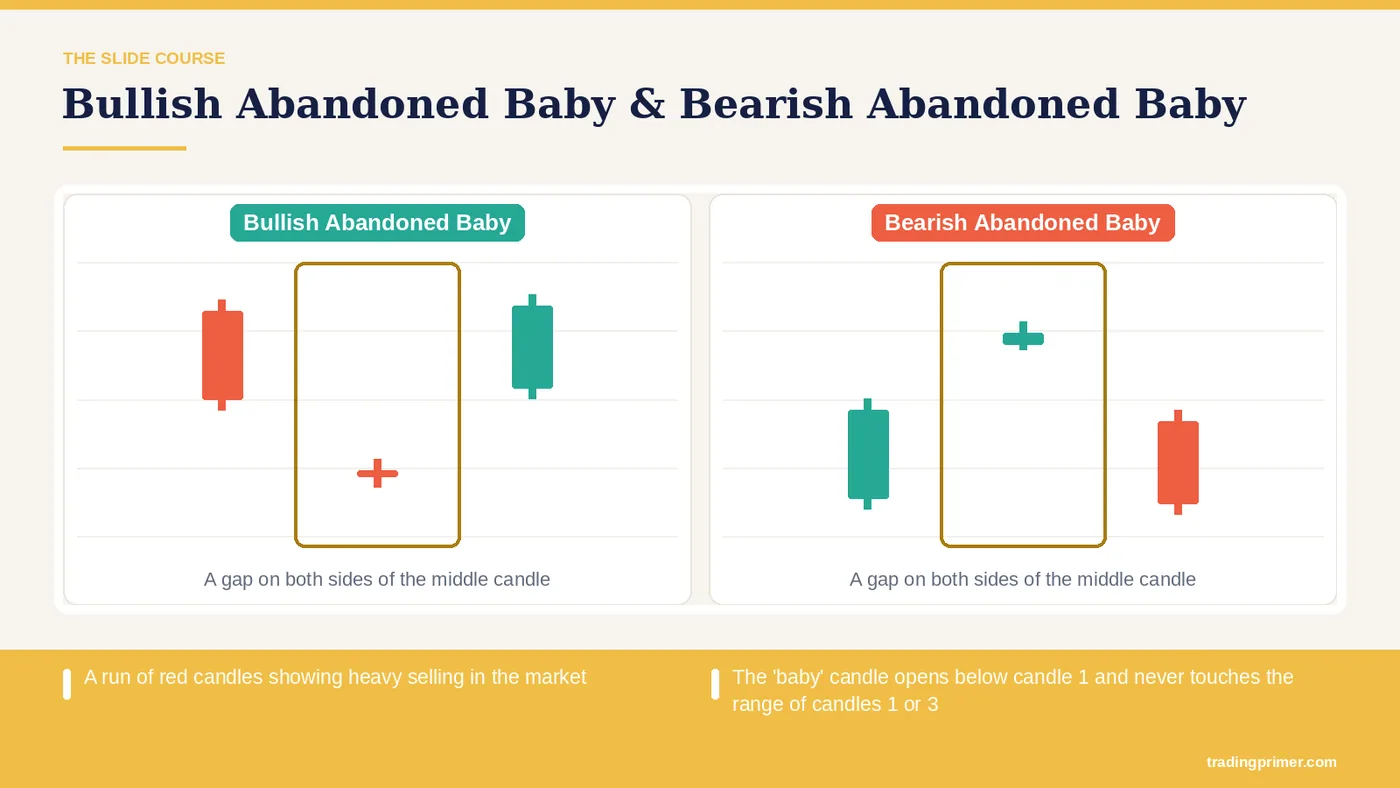
A run of red candles showing heavy selling in the market — The 'baby' candle opens below candle 1 and never touches the range of candles 1 or 3. Candle 3 is the next open, well above candle 1, reversing the market's downtrend. A run of green candles showing heavy buying in the market. The 'baby' candle opens above candle 1 and never touches the range of candles 1 or 3. Candle 3 is the next open, below candle 1, reversing the market's uptrend. Bearish abandoned baby. Bullish abandoned baby. Abandoned Baby.
Slide 46 of 72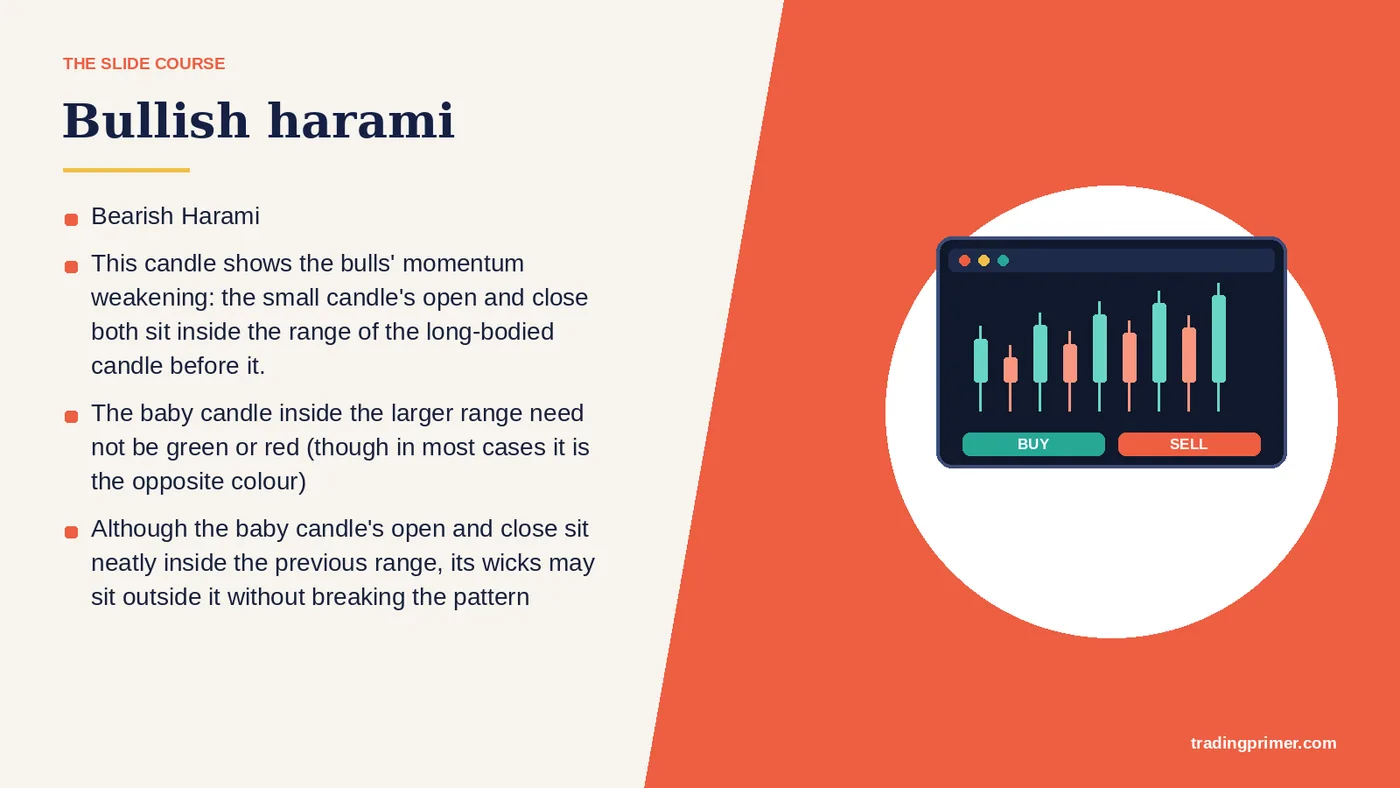
This candle shows the bulls' momentum weakening: the small candle's open and close both sit inside the range of the long-bodied candle before it. — The baby candle inside the larger range need not be green or red (though in most cases it is the opposite colour). Although the baby candle's open and close sit neatly inside the previous range, its wicks may sit outside it without breaking the pattern. Bullish harami. Bearish Harami.
Slide 47 of 72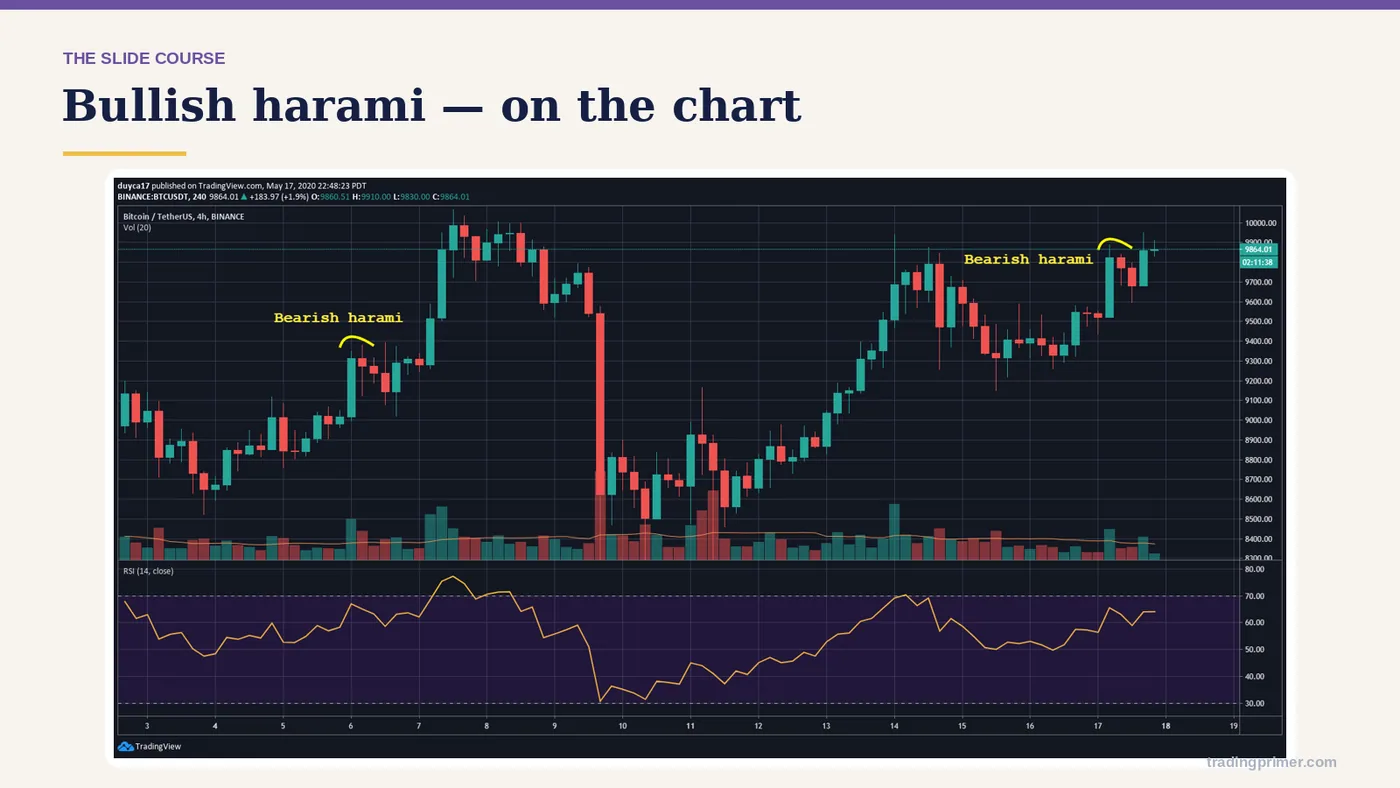
A run of red candles showing heavy selling in the market The 'baby' candle opens below can — a chart from the course deck. The markings on it are the lesson; read them left to right.
Slide 48 of 72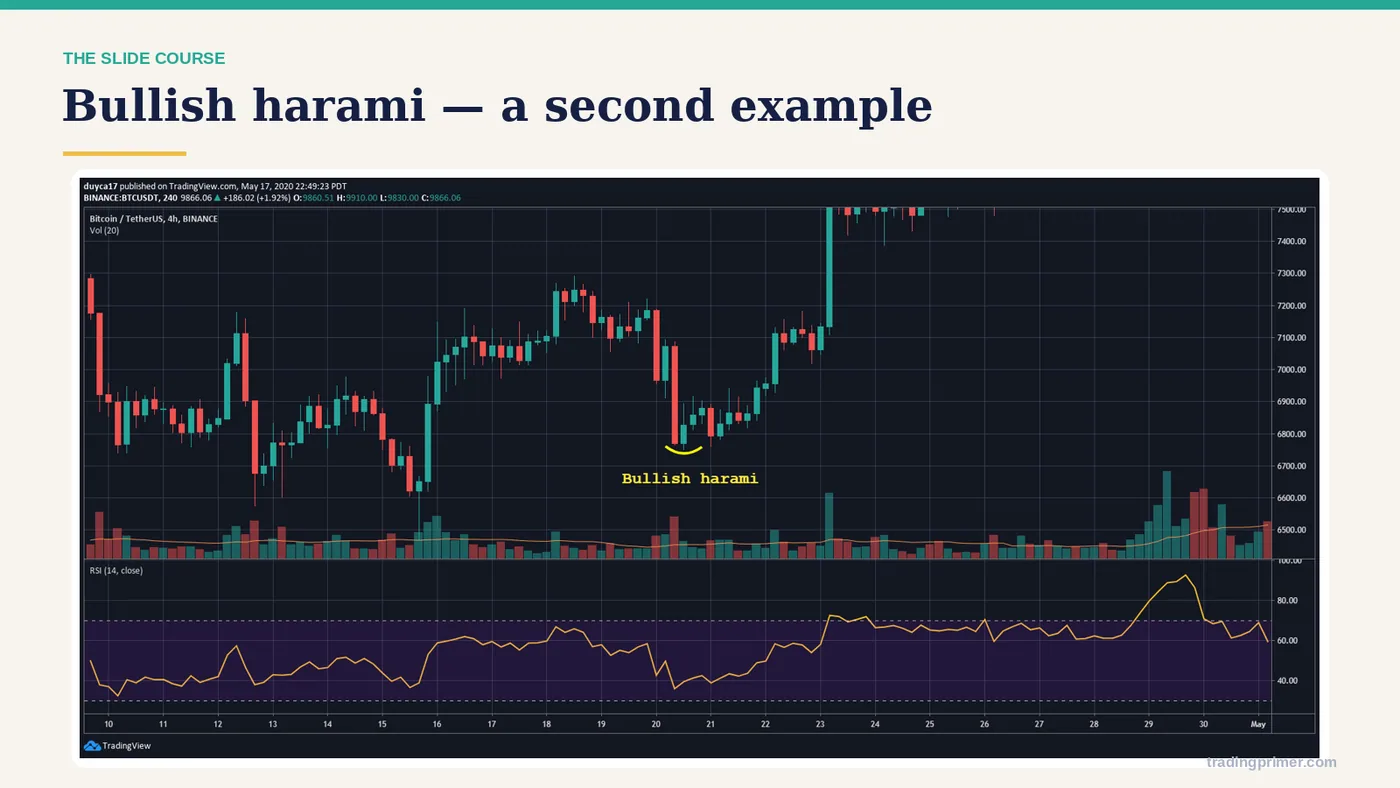
A run of red candles showing heavy selling in the market The 'baby' candle opens below can — a chart from the course deck. The markings on it are the lesson; read them left to right.
Slide 49 of 72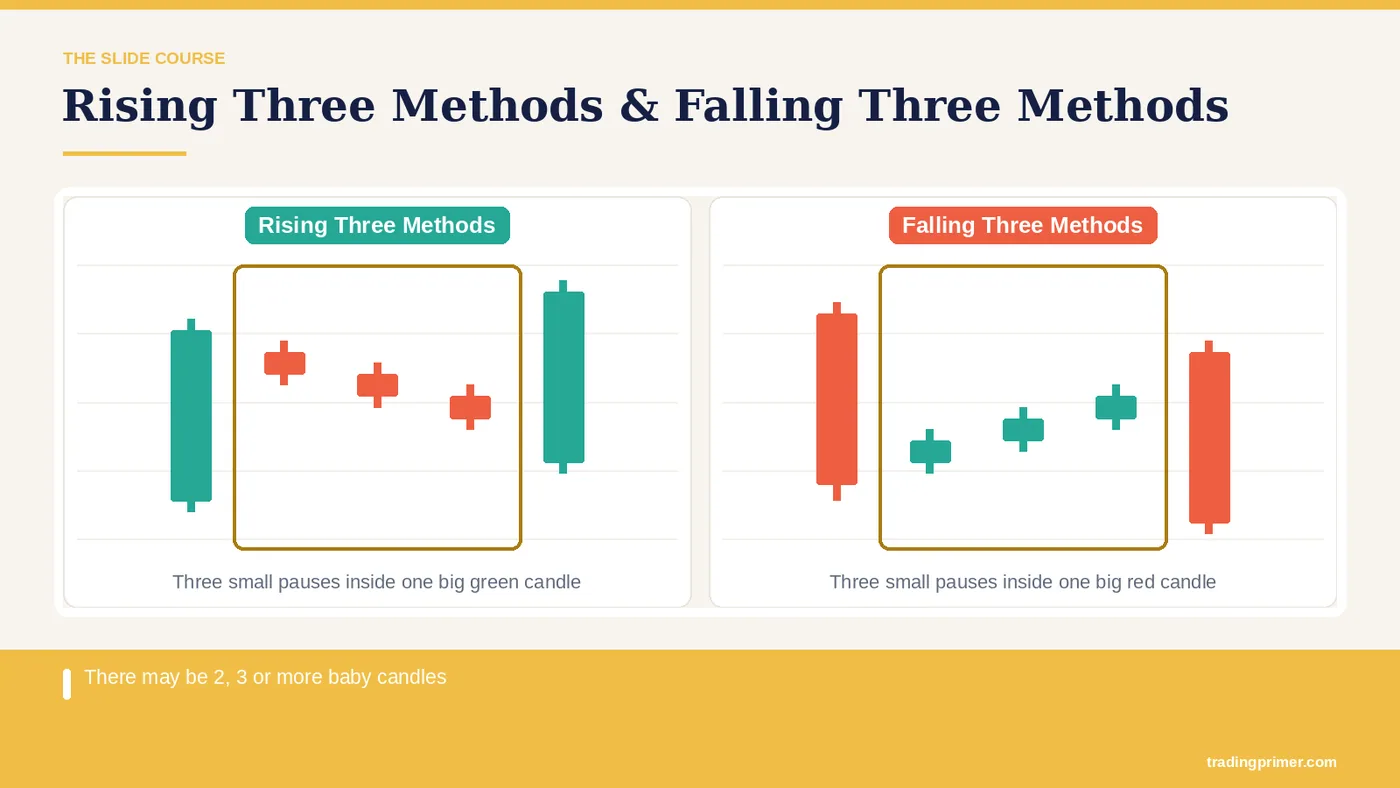
Appears in an uptrend — There may be 2, 3 or more baby candles. Ideally every baby candle sits inside the mother candle's range. The breakout candle must close above the close of the first green candle. Appears in a downtrend. The breakout candle must close below the close of the first red candle. Rising Three Methods. Falling Three Methods. Rising/Falling Three Methods.
Slide 50 of 72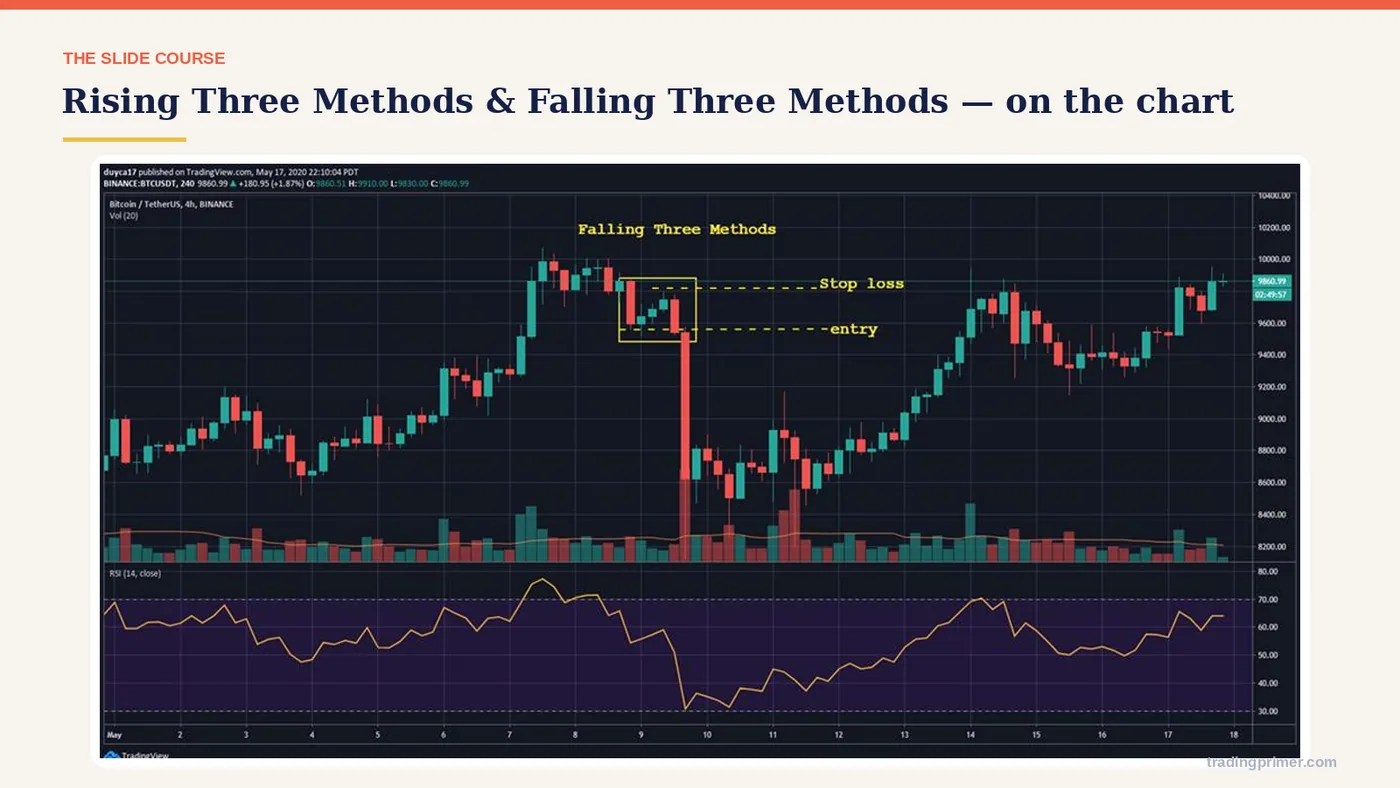
Appears in an uptrend There may be 2, 3 or more baby candles Ideally every baby candle sit — a chart from the course deck. The markings on it are the lesson; read them left to right.
Slide 51 of 72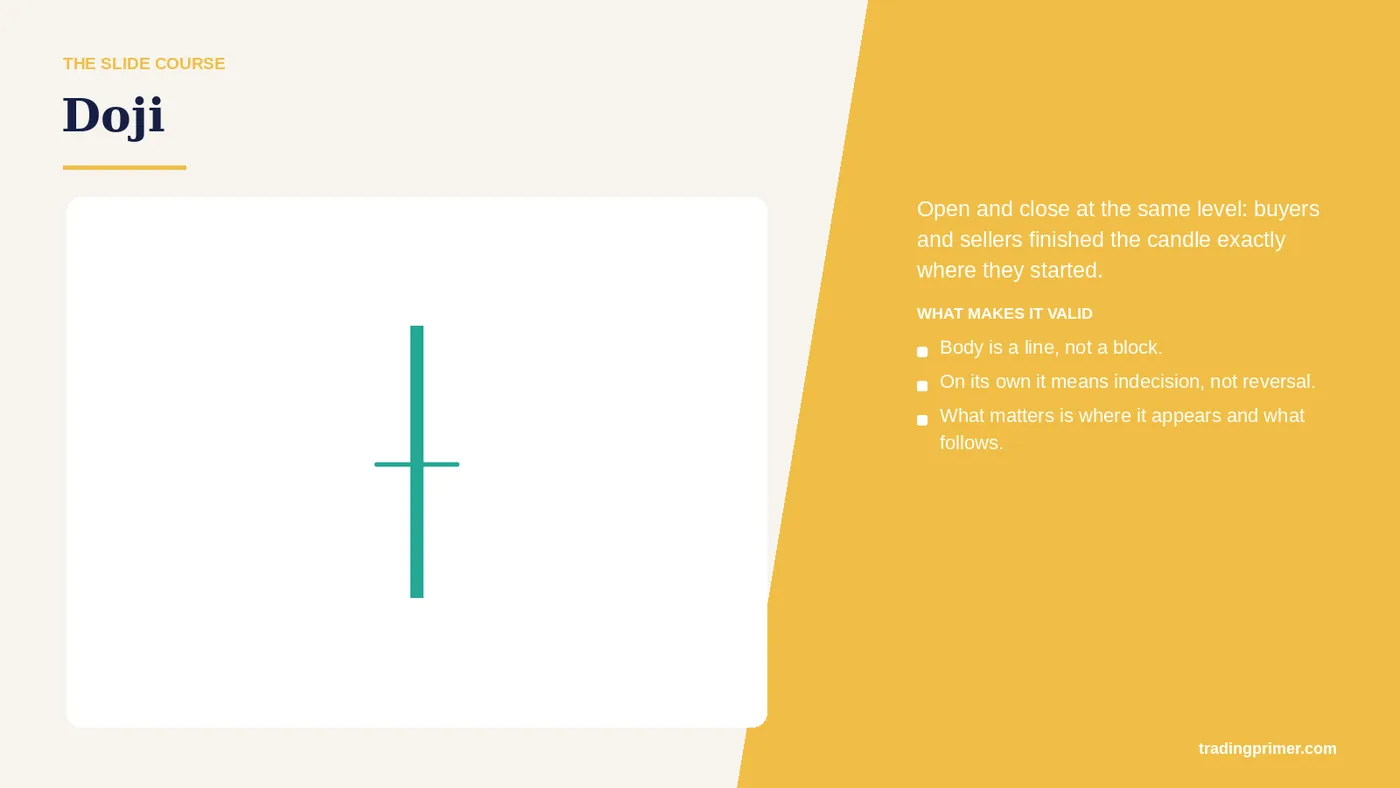
Doji. Open and close at the same level: buyers and sellers finished the candle exactly where they started. Body is a line, not a block. On its own it is not a trade — it tells you the current move has stalled.
Slide 52 of 72
Spinning Top. A small body with wicks on both sides — both sides pushed, neither finished ahead. Small body, long wicks above and below. On its own it is not a trade — it tells you the current move has stalled.
Slide 53 of 72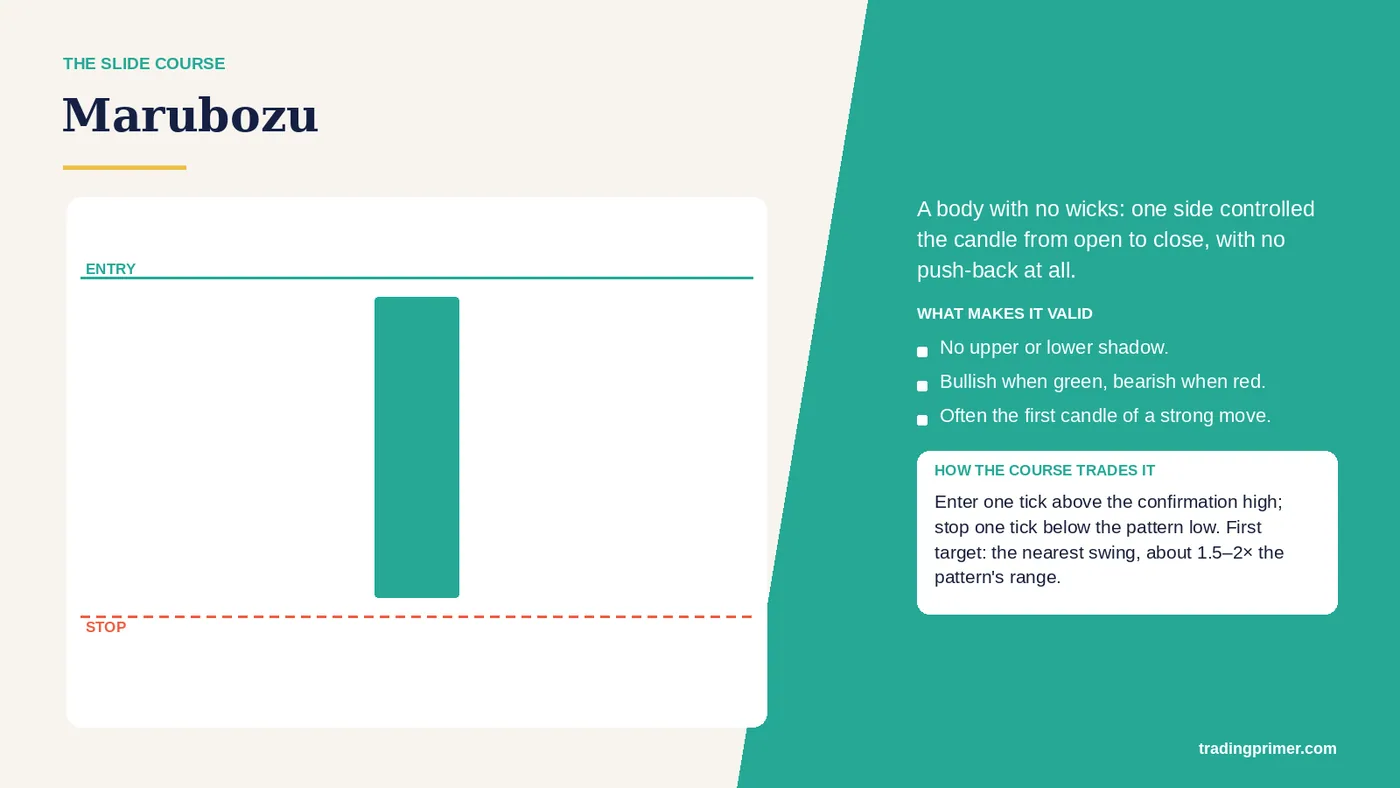
Marubozu. A body with no wicks: one side controlled the candle from open to close, with no push-back at all. No upper or lower shadow. Enter one tick above the confirmation high, stop one tick below the pattern low.
Slide 54 of 72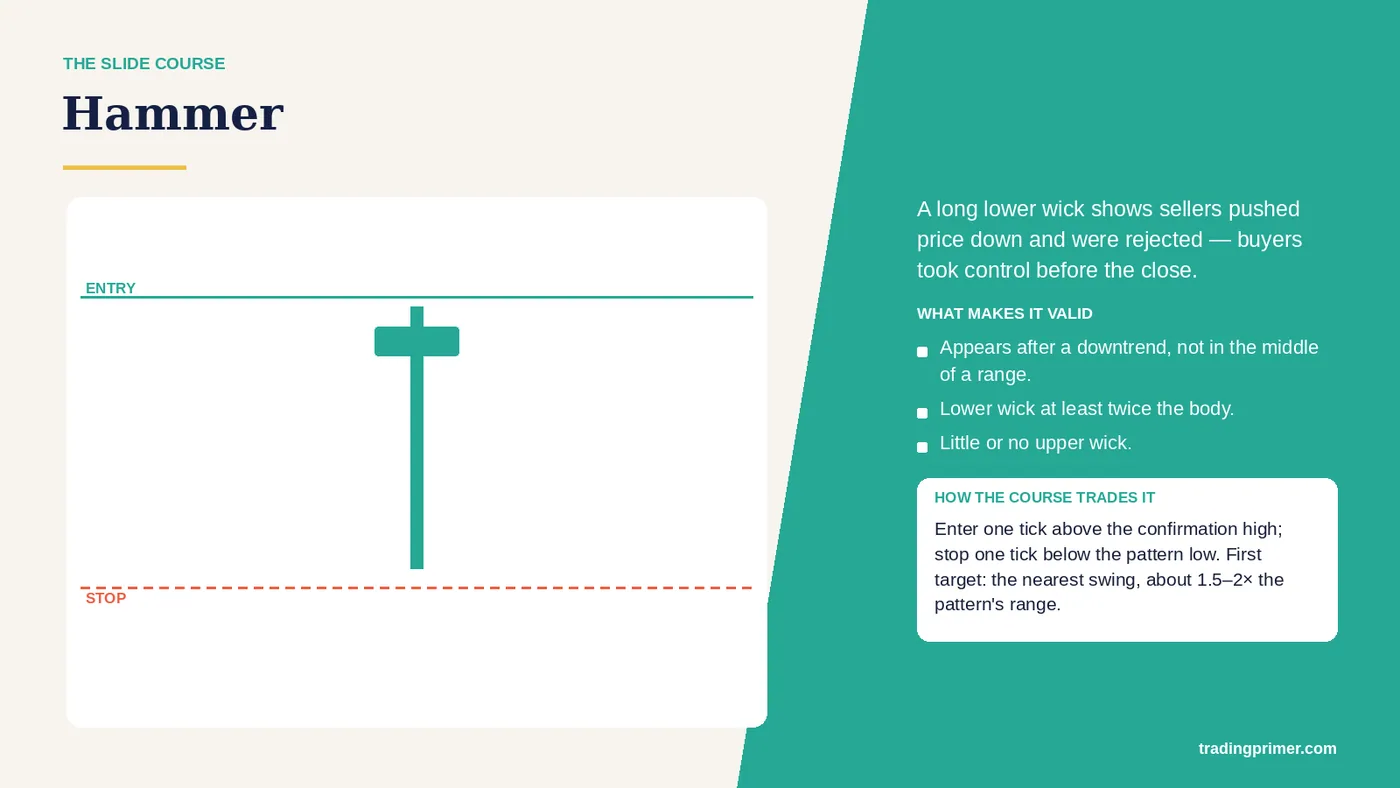
Hammer. A long lower wick shows sellers pushed price down and were rejected — buyers took control before the close. Appears after a downtrend, not in the middle of a range. Enter one tick above the confirmation high, stop one tick below the pattern low.
Slide 55 of 72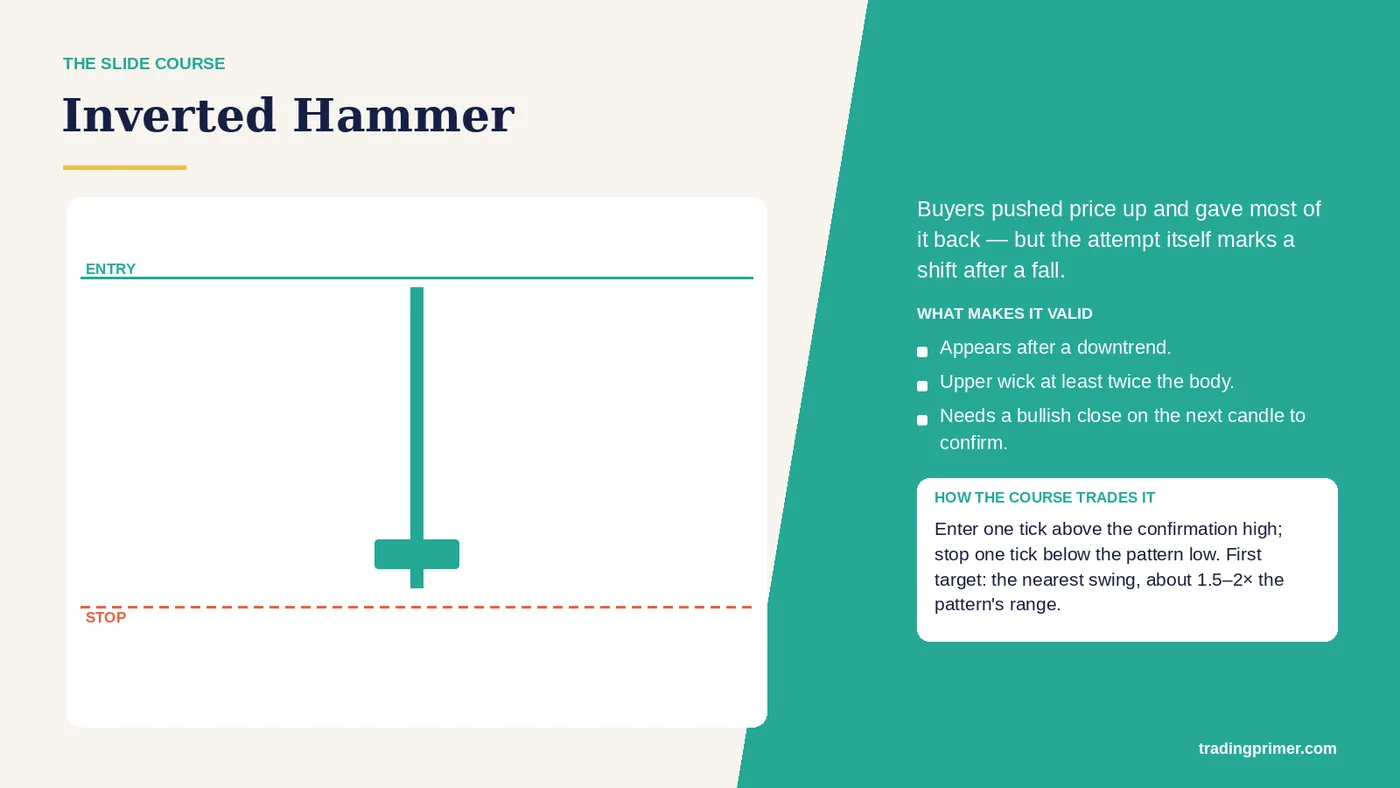
Inverted Hammer. Buyers pushed price up and gave most of it back — but the attempt itself marks a shift after a fall. Appears after a downtrend. Enter one tick above the confirmation high, stop one tick below the pattern low.
Slide 56 of 72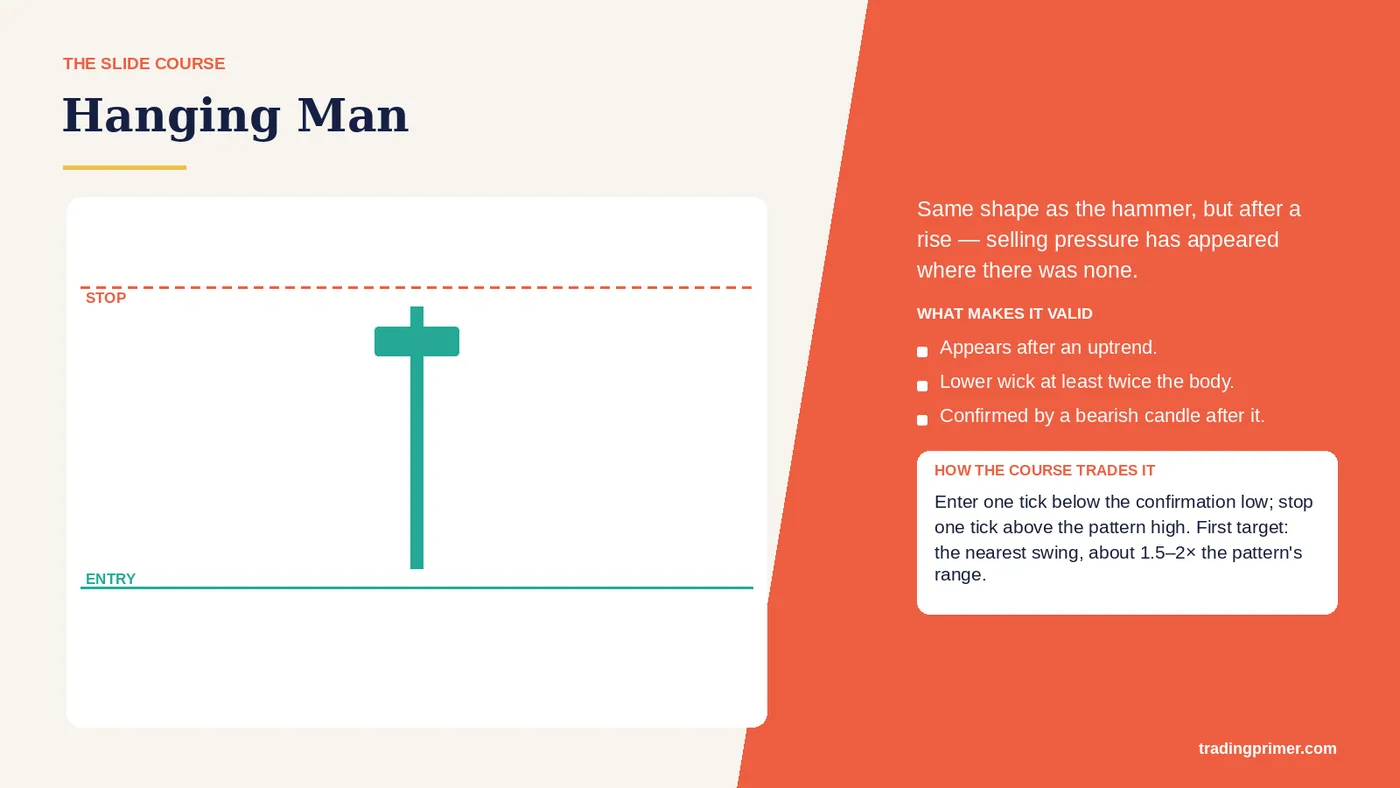
Hanging Man. Same shape as the hammer, but after a rise — selling pressure has appeared where there was none. Appears after an uptrend. Enter one tick below the confirmation low, stop one tick above the pattern high.
Slide 57 of 72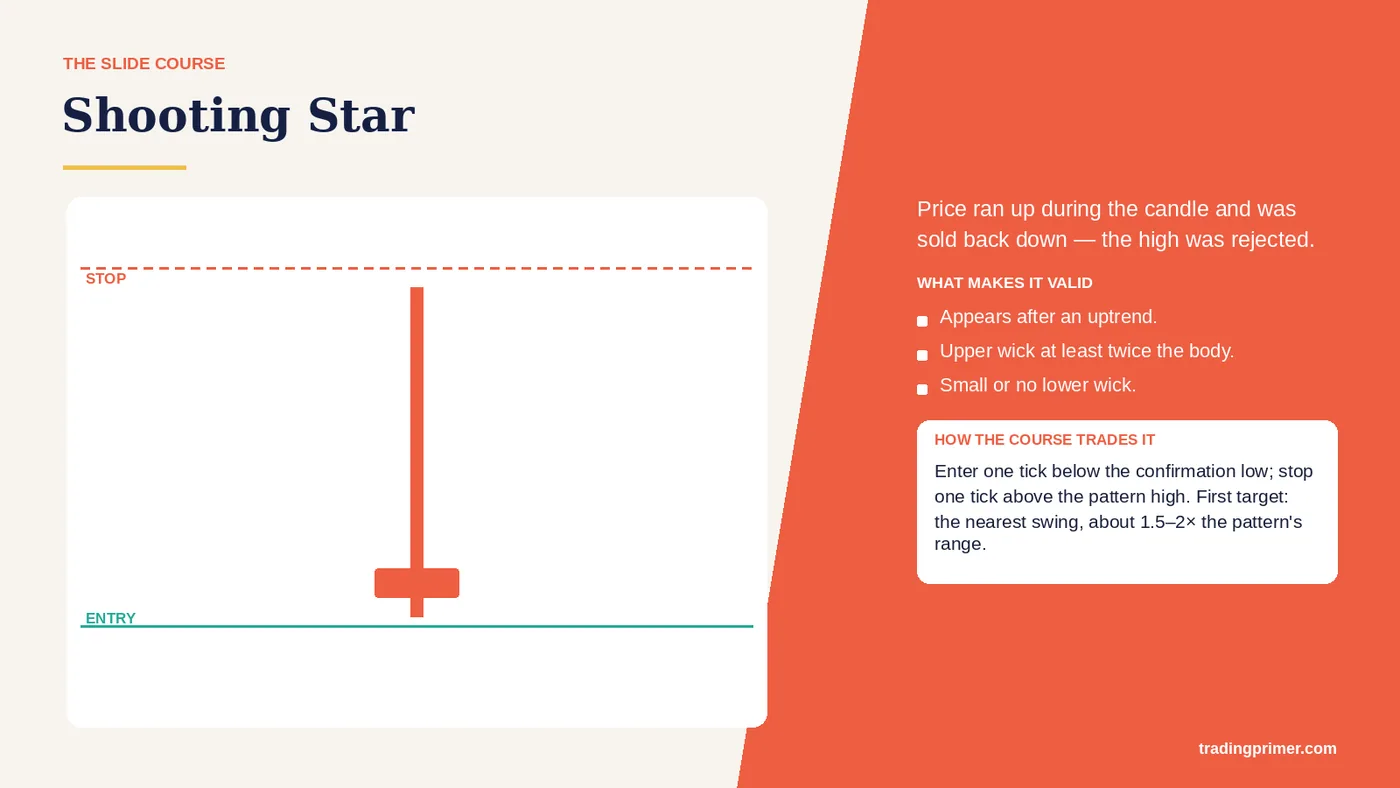
Shooting Star. Price ran up during the candle and was sold back down — the high was rejected. Appears after an uptrend. Enter one tick below the confirmation low, stop one tick above the pattern high.
Slide 58 of 72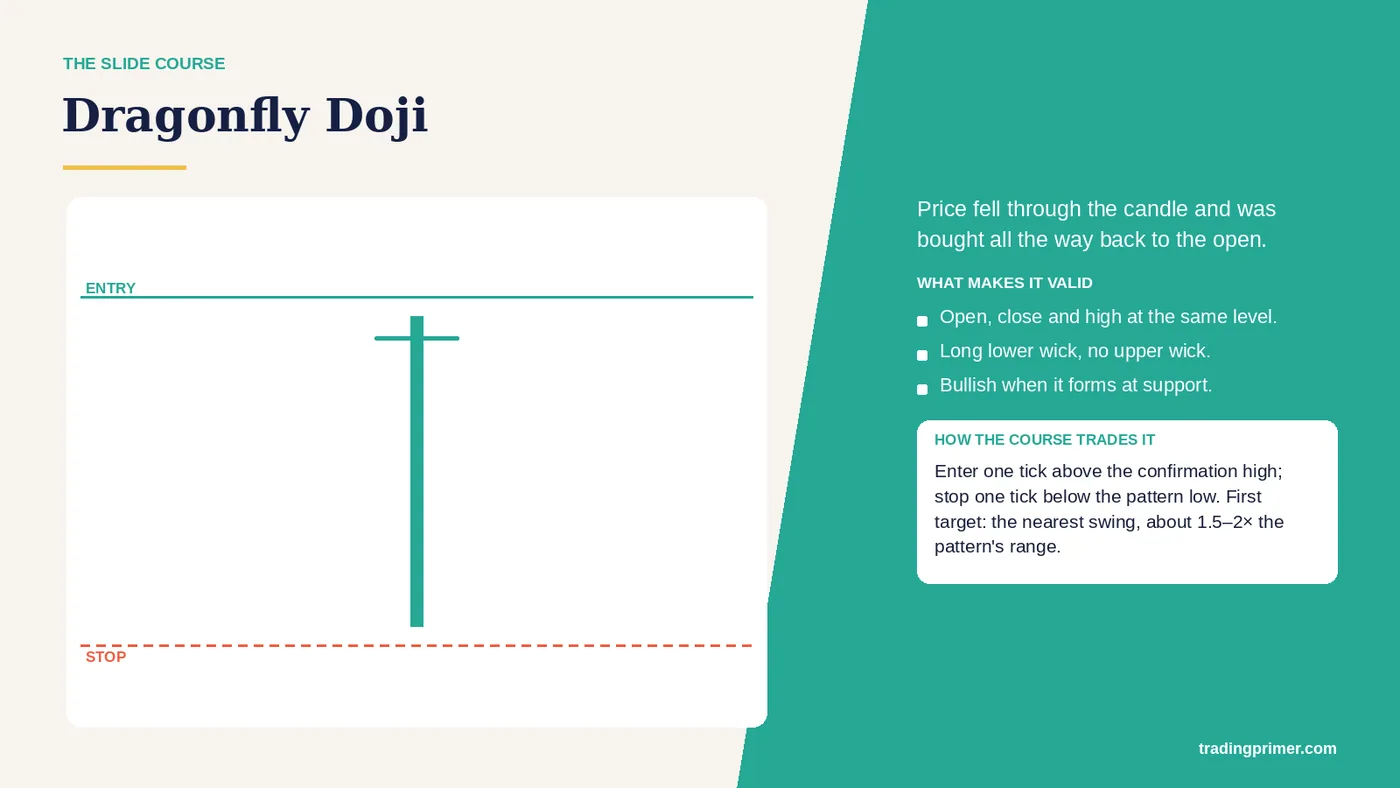
Dragonfly Doji. Price fell through the candle and was bought all the way back to the open. Open, close and high at the same level. Enter one tick above the confirmation high, stop one tick below the pattern low.
Slide 59 of 72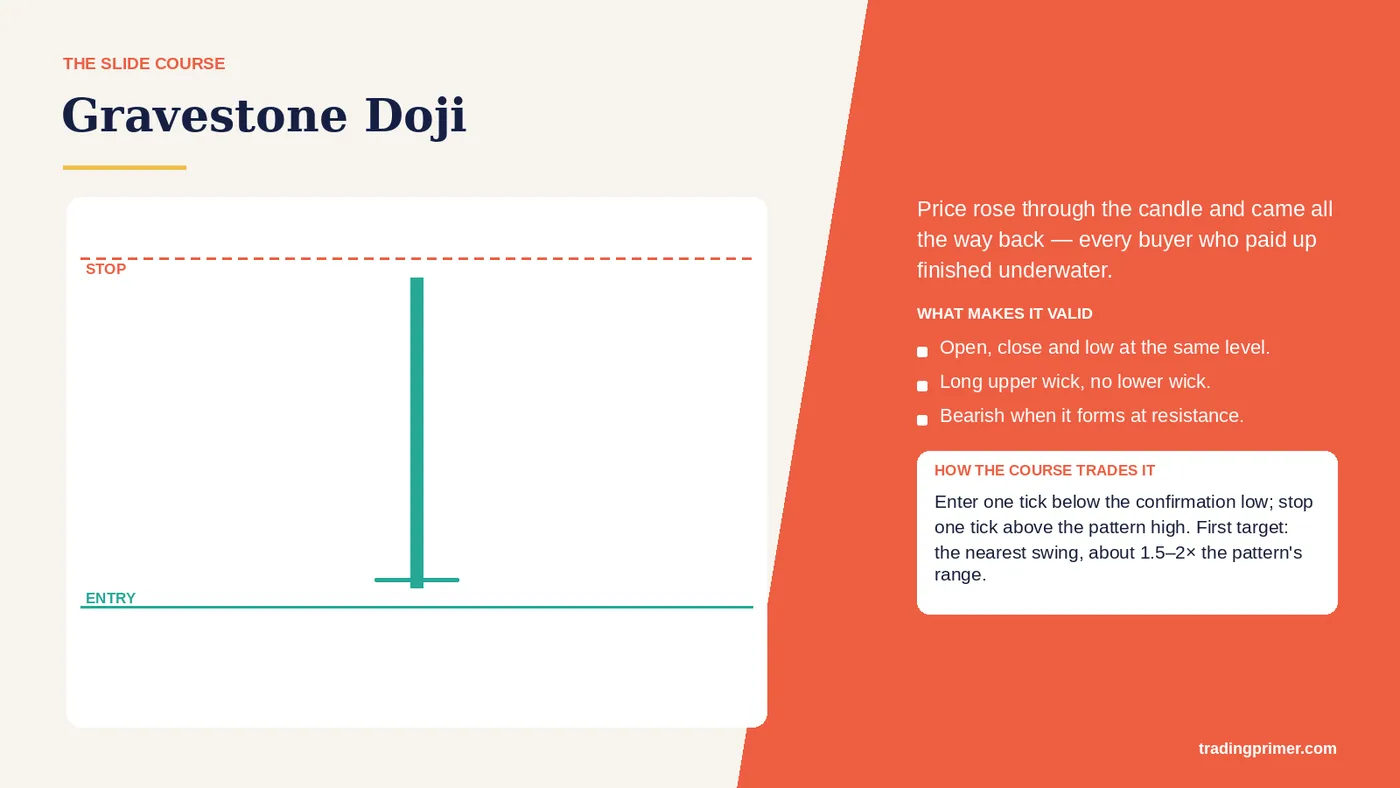
Gravestone Doji. Price rose through the candle and came all the way back — every buyer who paid up finished underwater. Open, close and low at the same level. Enter one tick below the confirmation low, stop one tick above the pattern high.
Slide 60 of 72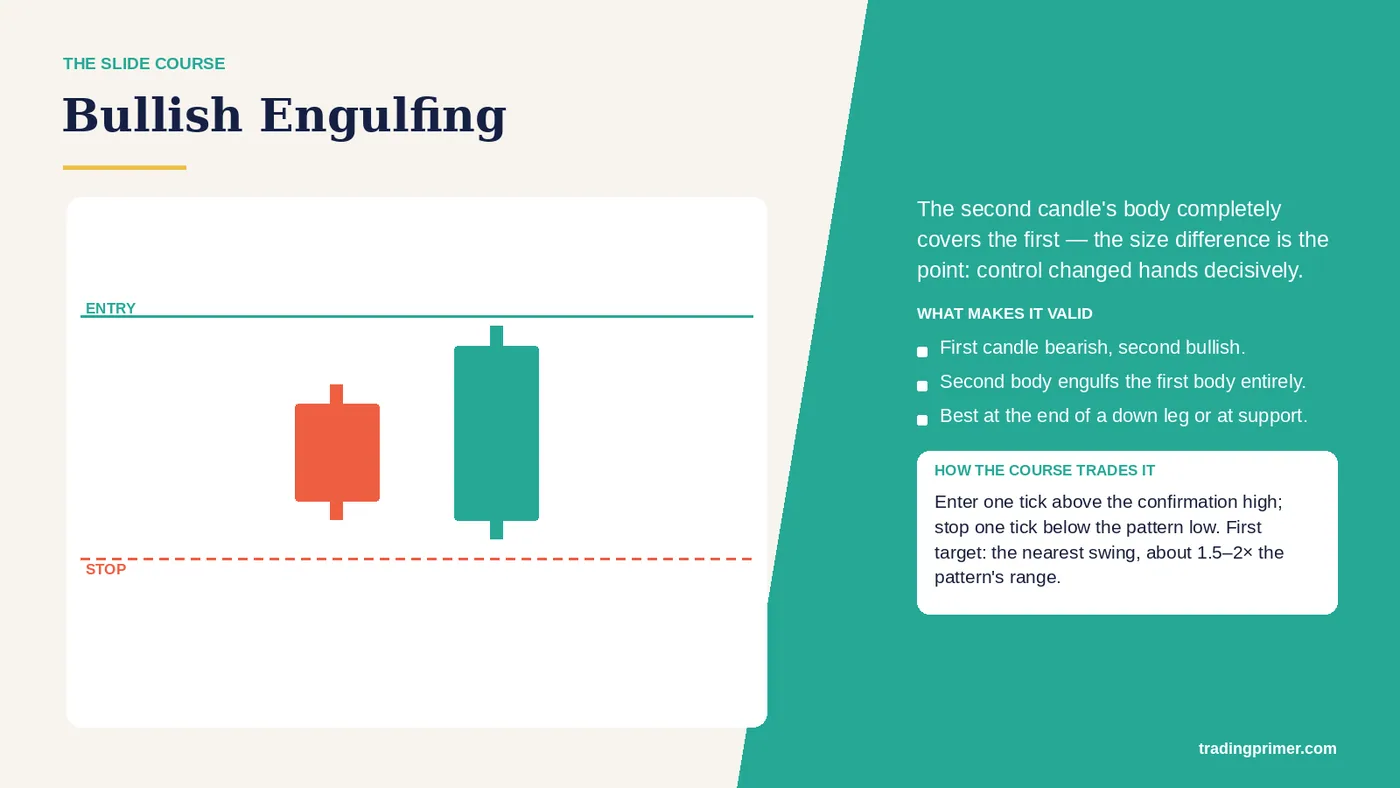
Bullish Engulfing. The second candle's body completely covers the first — the size difference is the point: control changed hands decisively. First candle bearish, second bullish. Enter one tick above the confirmation high, stop one tick below the pattern low.
Slide 61 of 72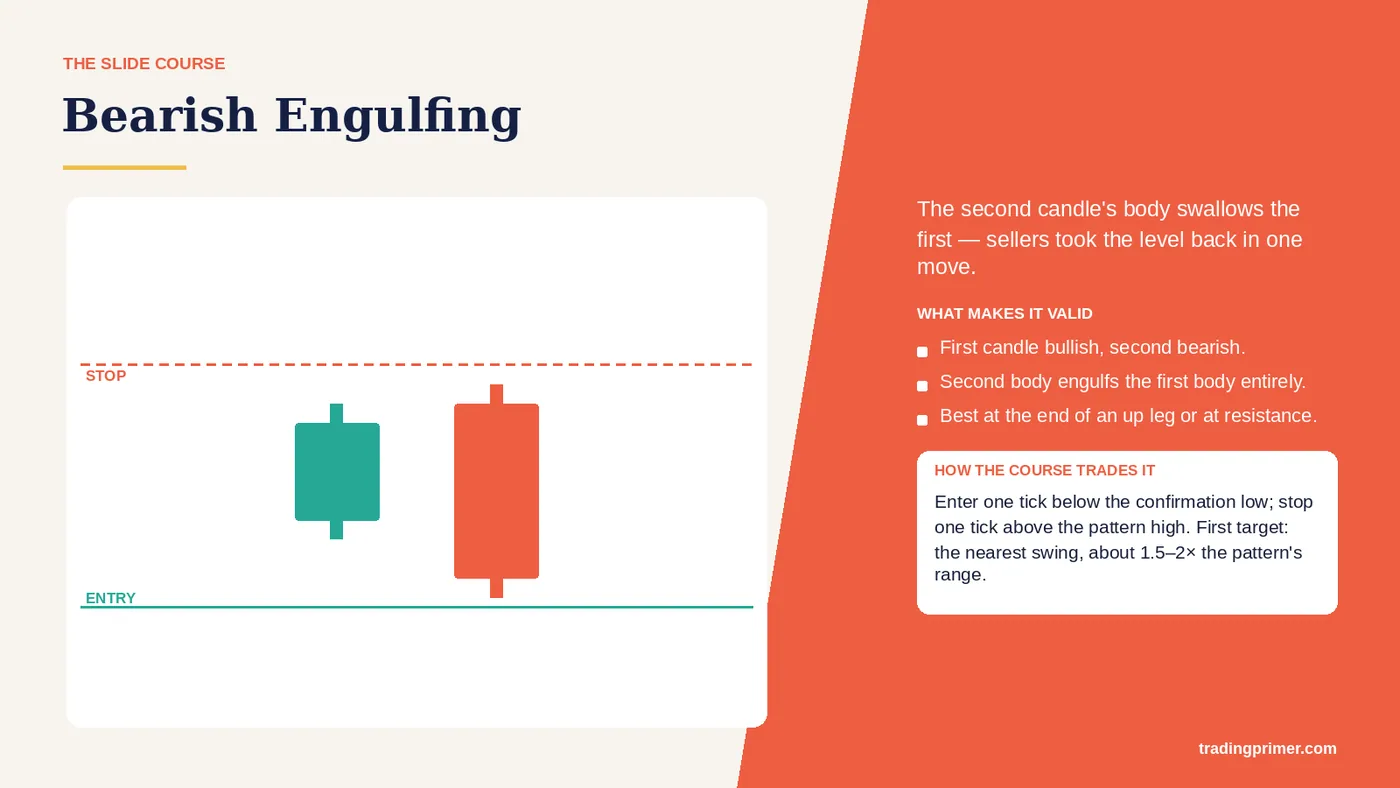
Bearish Engulfing. The second candle's body swallows the first — sellers took the level back in one move. First candle bullish, second bearish. Enter one tick below the confirmation low, stop one tick above the pattern high.
Slide 62 of 72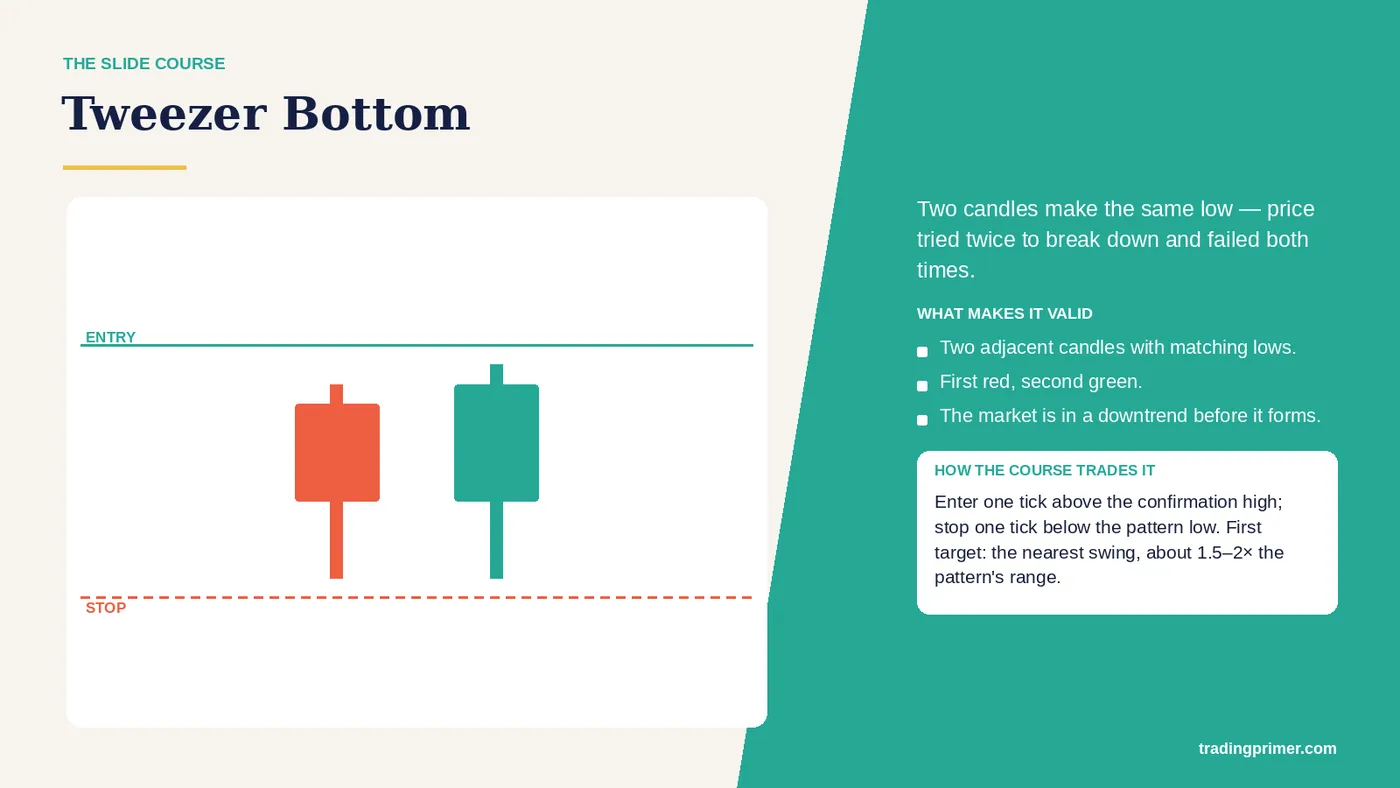
Tweezer Bottom. Two candles make the same low — price tried twice to break down and failed both times. Two adjacent candles with matching lows. Enter one tick above the confirmation high, stop one tick below the pattern low.
Slide 63 of 72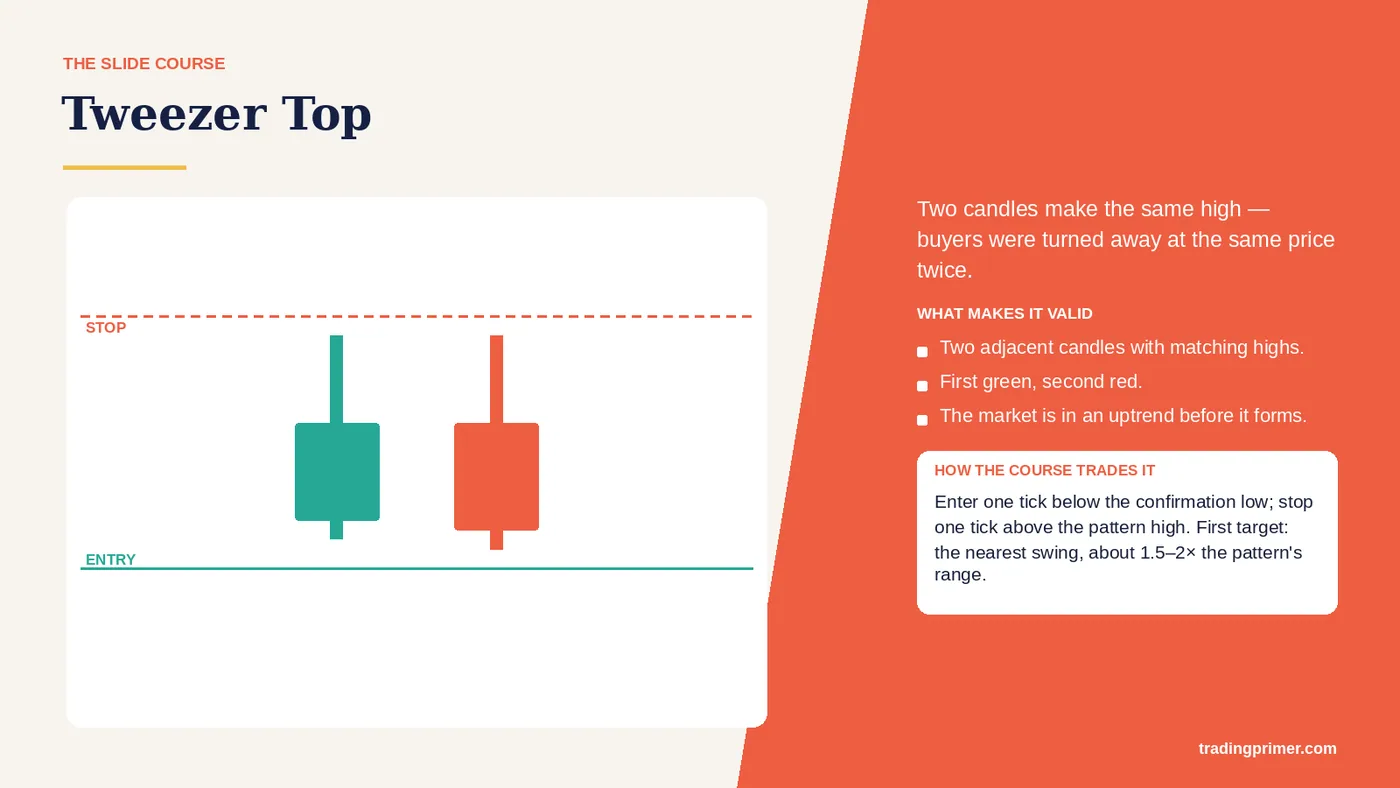
Tweezer Top. Two candles make the same high — buyers were turned away at the same price twice. Two adjacent candles with matching highs. Enter one tick below the confirmation low, stop one tick above the pattern high.
Slide 64 of 72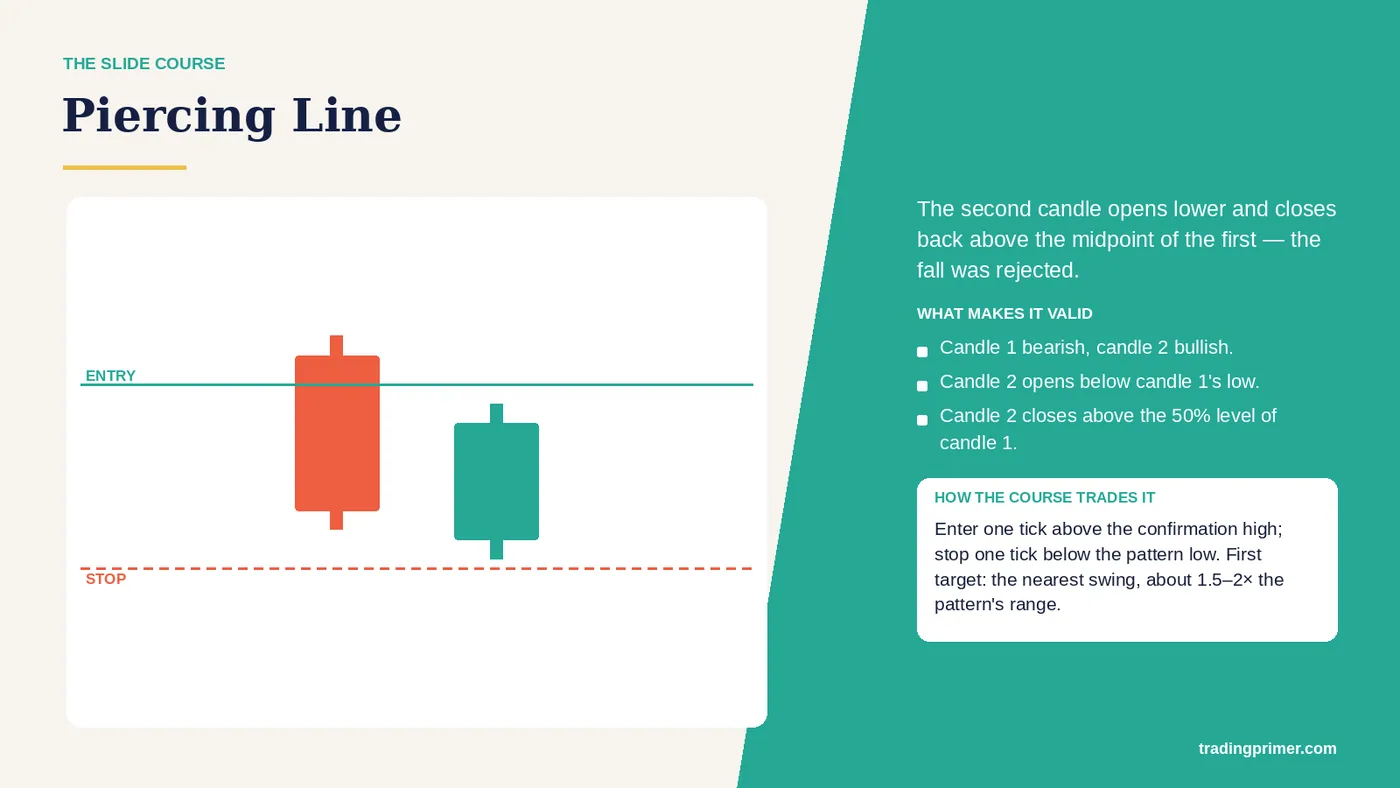
Piercing Line. The second candle opens lower and closes back above the midpoint of the first — the fall was rejected. Candle 1 bearish, candle 2 bullish. Enter one tick above the confirmation high, stop one tick below the pattern low.
Slide 65 of 72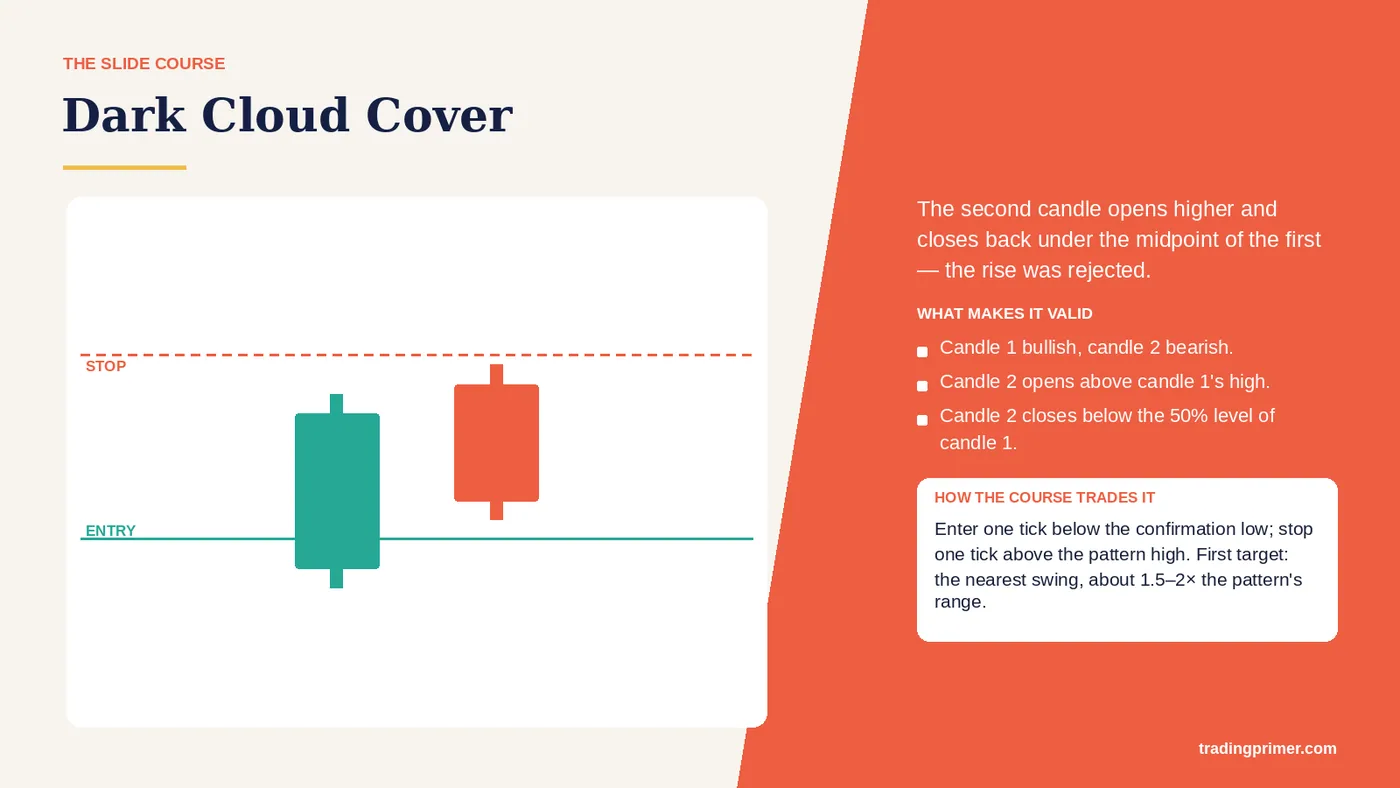
Dark Cloud Cover. The second candle opens higher and closes back under the midpoint of the first — the rise was rejected. Candle 1 bullish, candle 2 bearish. Enter one tick below the confirmation low, stop one tick above the pattern high.
Slide 66 of 72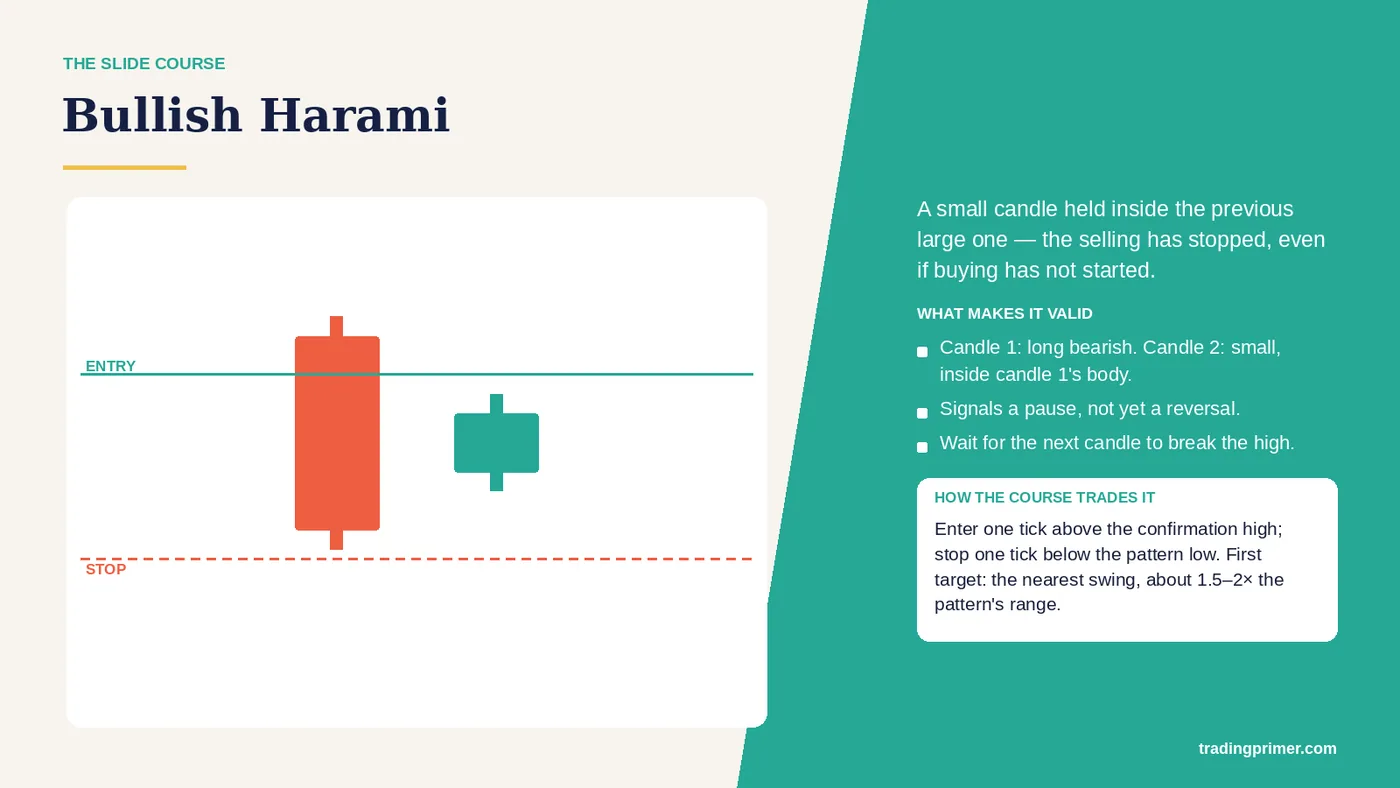
Bullish Harami. A small candle held inside the previous large one — the selling has stopped, even if buying has not started. Candle 1: long bearish. Candle 2: small, inside candle 1's body. Enter one tick above the confirmation high, stop one tick below the pattern low.
Slide 67 of 72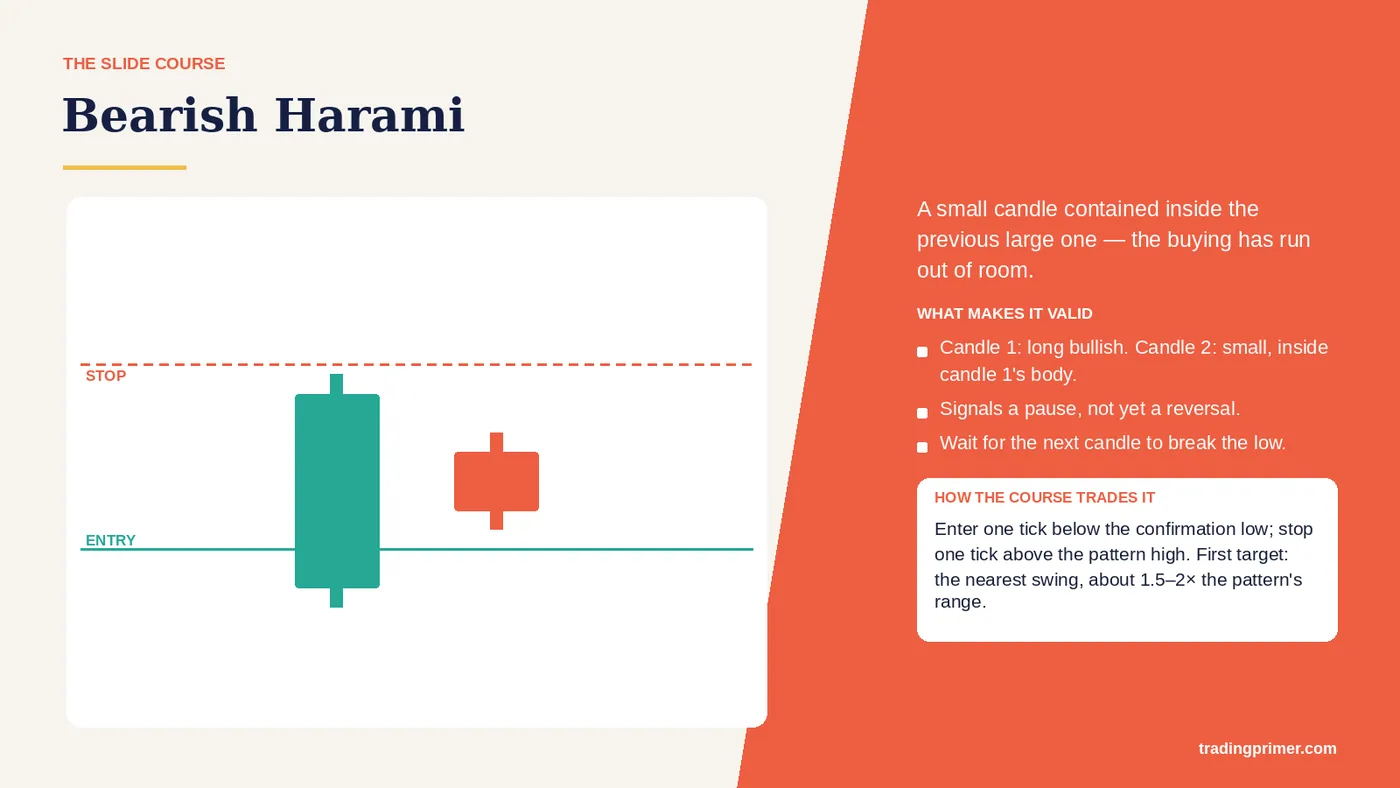
Bearish Harami. A small candle contained inside the previous large one — the buying has run out of room. Candle 1: long bullish. Candle 2: small, inside candle 1's body. Enter one tick below the confirmation low, stop one tick above the pattern high.
Slide 68 of 72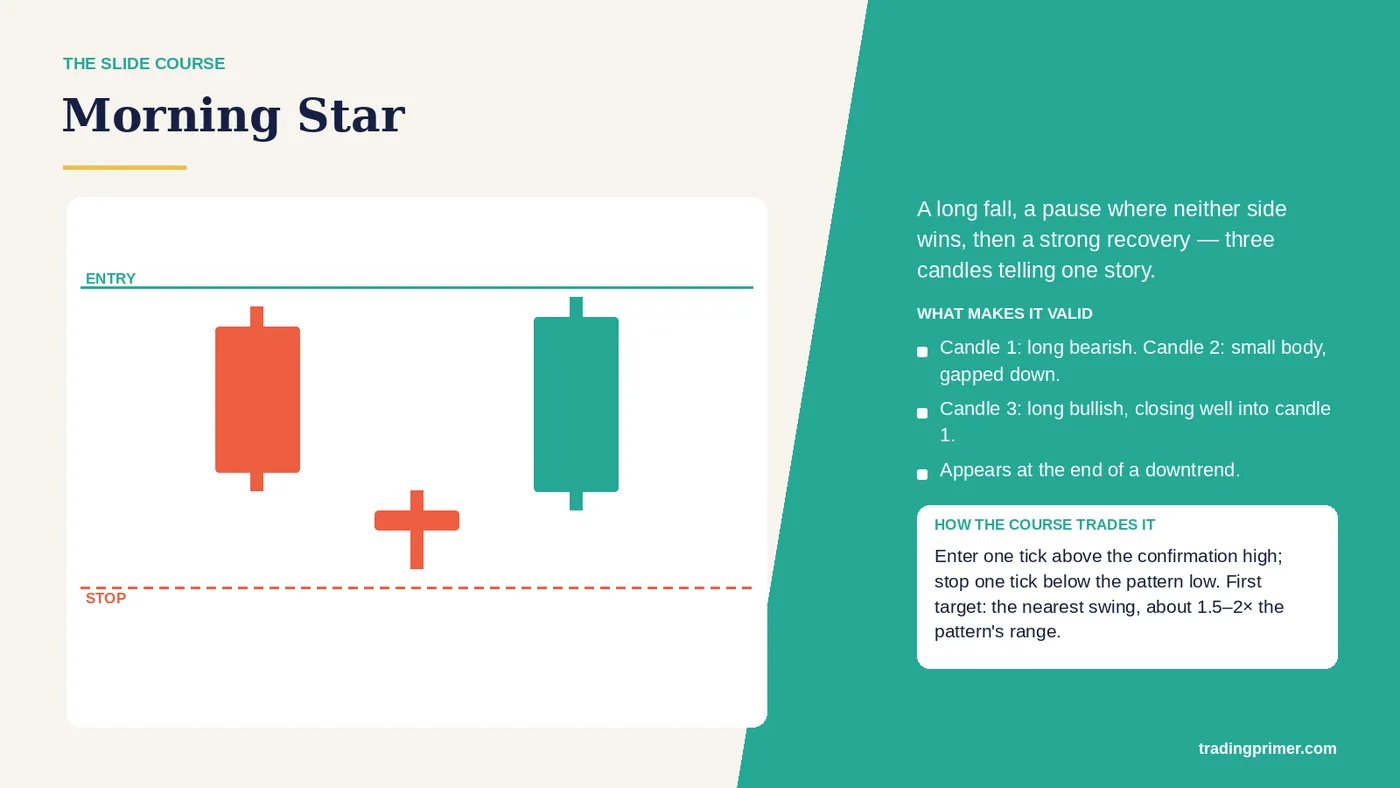
Morning Star. A long fall, a pause where neither side wins, then a strong recovery — three candles telling one story. Candle 1: long bearish. Candle 2: small body, gapped down. Enter one tick above the confirmation high, stop one tick below the pattern low.
Slide 69 of 72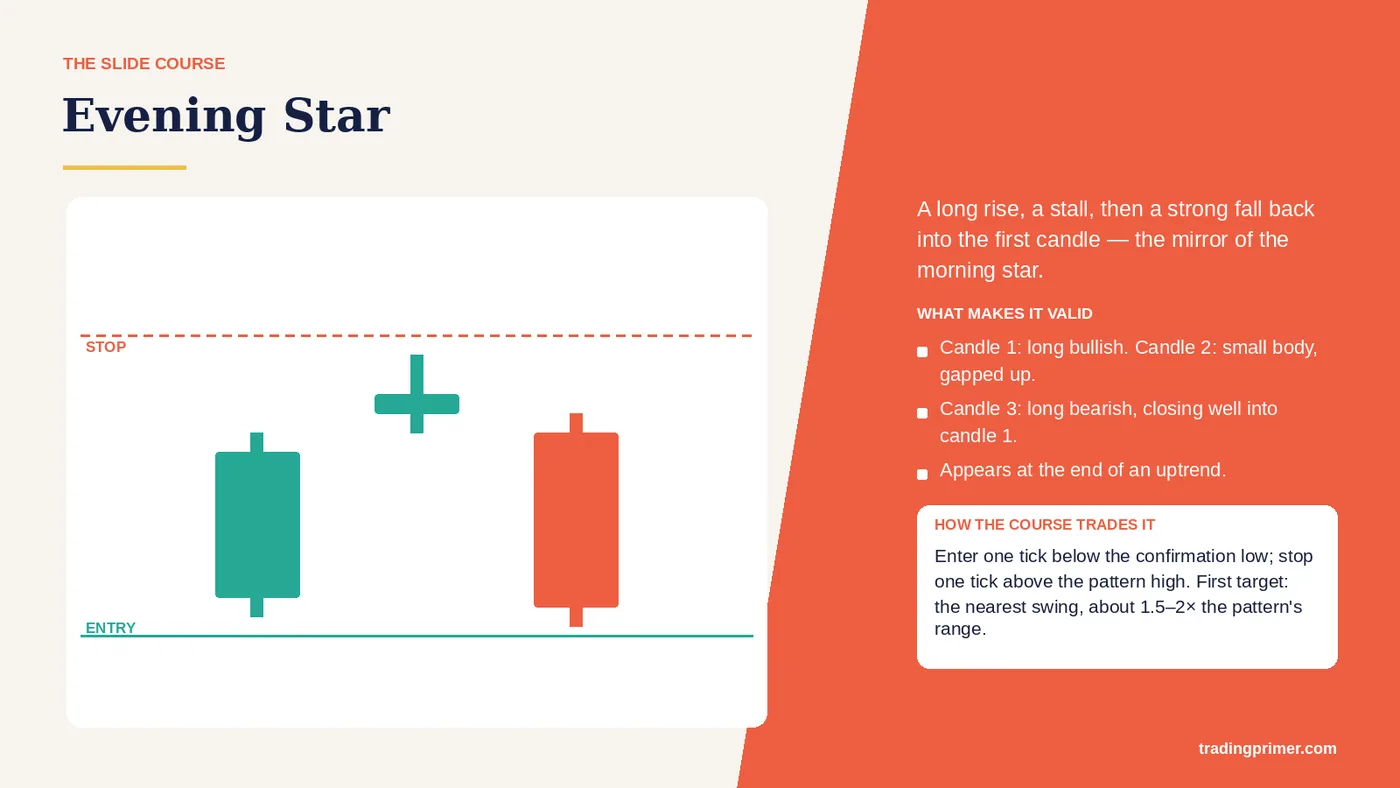
Evening Star. A long rise, a stall, then a strong fall back into the first candle — the mirror of the morning star. Candle 1: long bullish. Candle 2: small body, gapped up. Enter one tick below the confirmation low, stop one tick above the pattern high.
Slide 70 of 72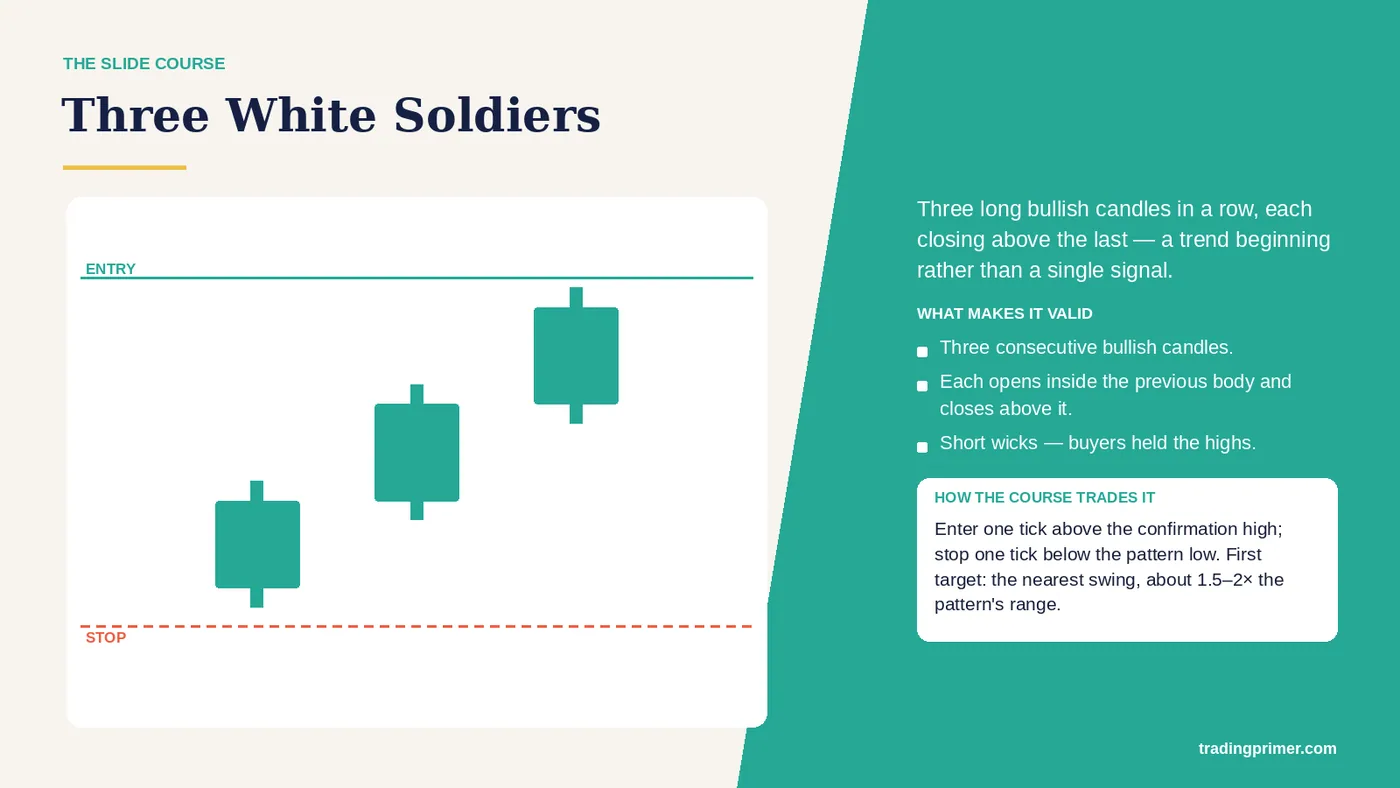
Three White Soldiers. Three long bullish candles in a row, each closing above the last — a trend beginning rather than a single signal. Three consecutive bullish candles. Enter one tick above the confirmation high, stop one tick below the pattern low.
Slide 71 of 72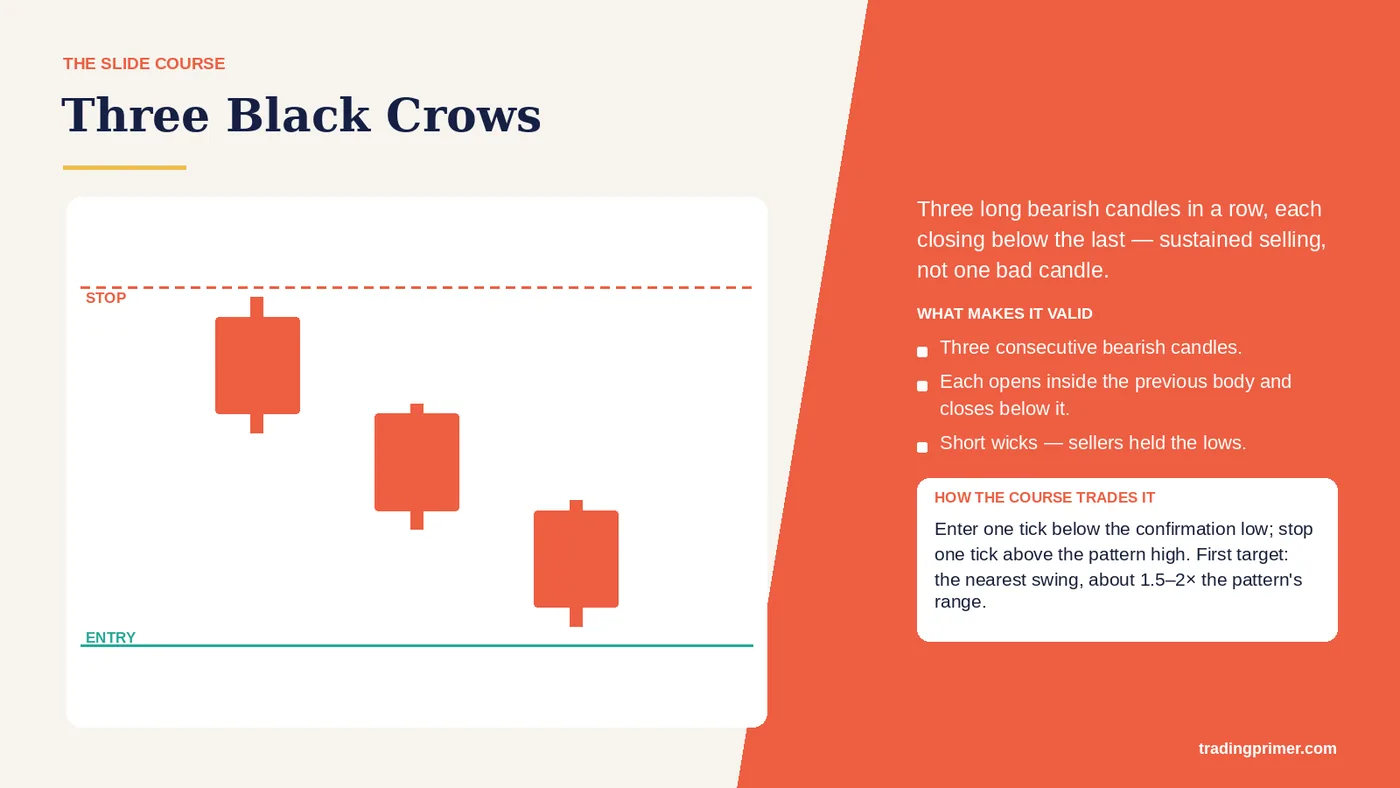
Three Black Crows. Three long bearish candles in a row, each closing below the last — sustained selling, not one bad candle. Three consecutive bearish candles. Enter one tick below the confirmation low, stop one tick above the pattern high.
Slide 72 of 72What this part covers
15 topics, in order. Each link jumps straight to that slide.
Prefer it as a PDF?
The same ten parts, downloadable, to keep next to your charts.