Part 9 — Price action
The eight price-action rules the course trades from, false breakouts included. All 24 slides in the order the course teaches them — each one explained underneath.
PART IX — Price Action. Trading Strategies. Based On Price Action.
Slide 1 of 24
PRICE ACTION — Trading with price action.
Slide 2 of 24
What price action is made of — The chart carries the detail; the markings on it are what the course is teaching here.
Slide 3 of 24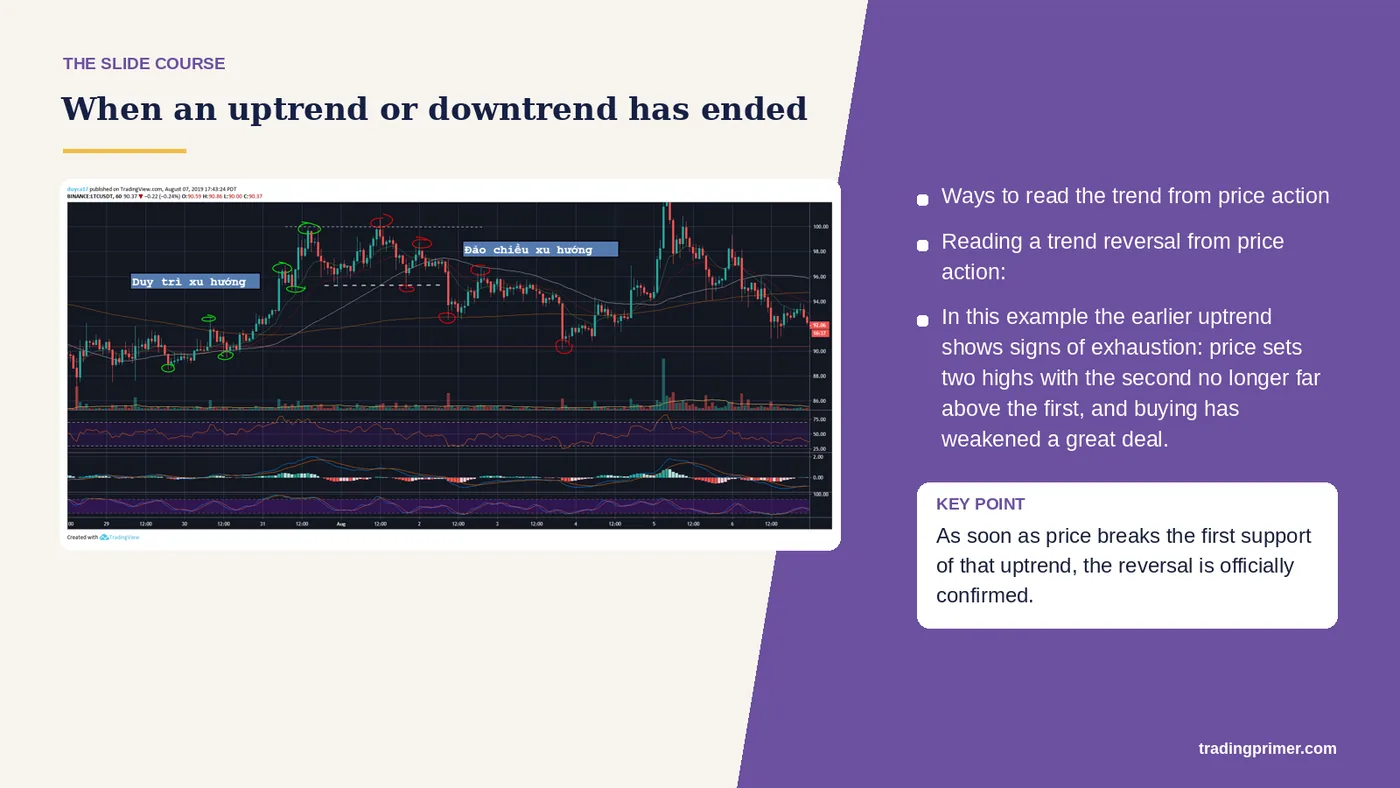
In this example the earlier uptrend shows signs of exhaustion: price sets two highs with the second no longer far above the first, and buying has weakened a great deal. — As soon as price breaks the first support of that uptrend, the reversal is officially confirmed. Ways to read the trend from price action. Reading a trend reversal. from price action: When an uptrend or downtrend. has ended.
Slide 4 of 24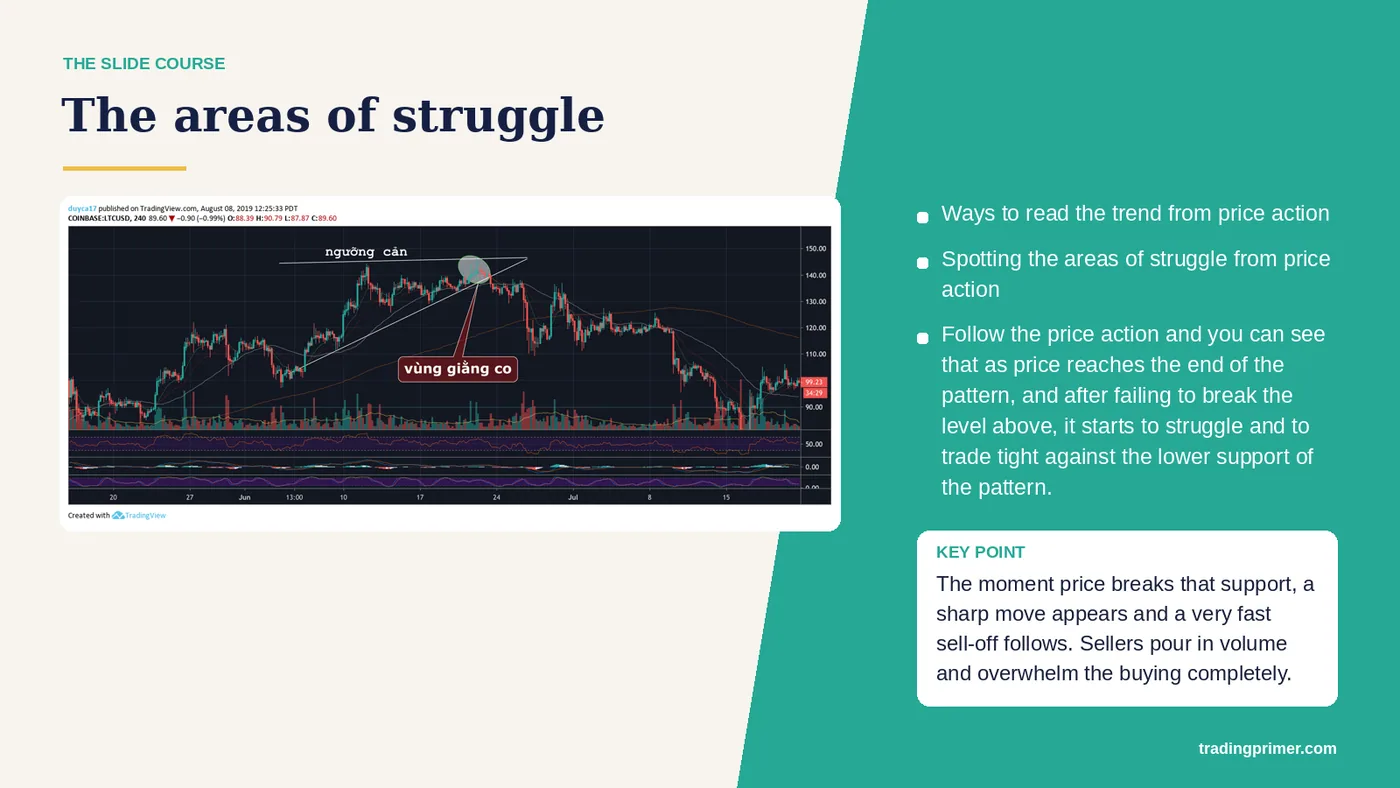
Spotting the areas of struggle — from price action. Follow the price action and you can see that as price reaches the end of the pattern, and after failing to break the level above, it starts to struggle and to trade tight against the lower support of the pattern. The moment price breaks that support, a sharp move appears and a very fast sell-off follows. Sellers pour in volume and overwhelm the buying completely. Ways to read the trend from price action. The areas of struggle.
Slide 5 of 24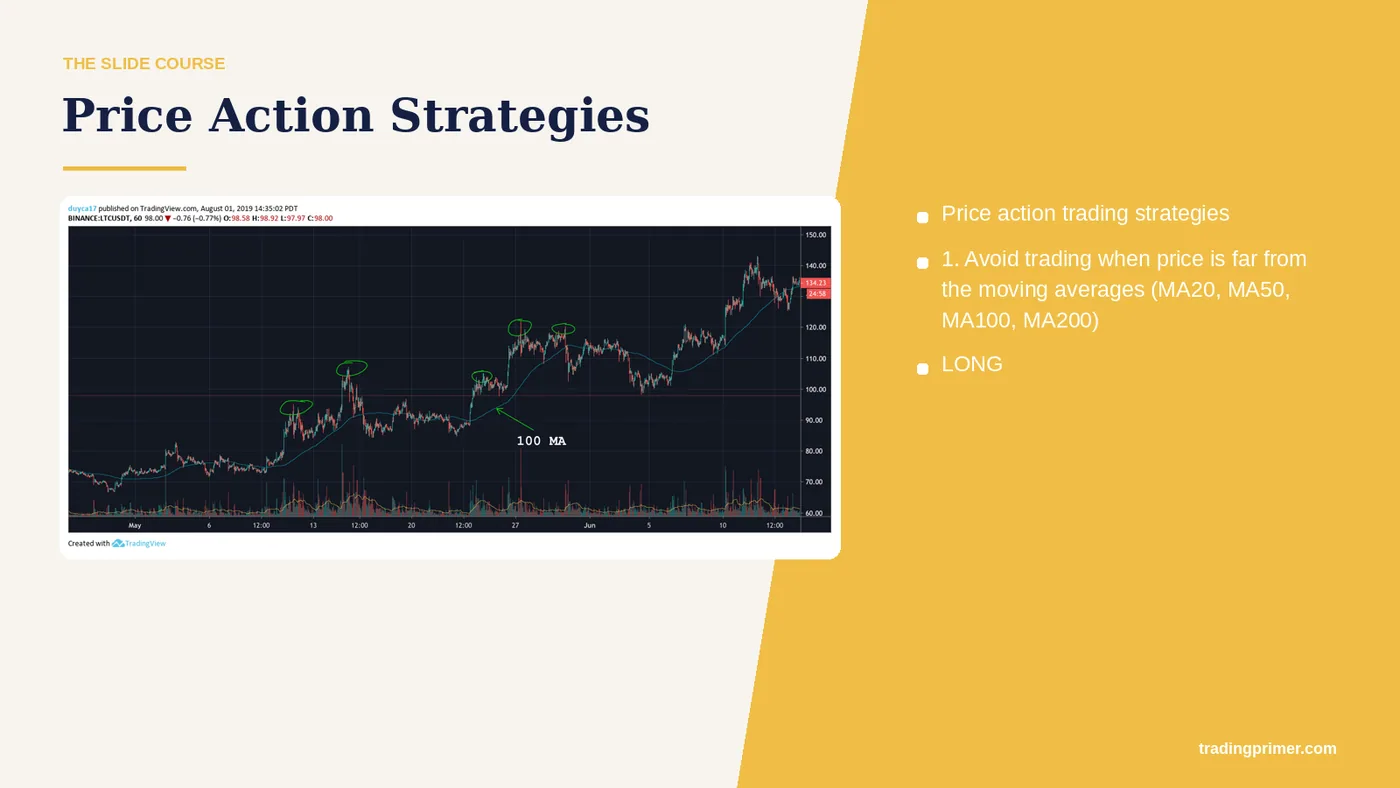
1. Avoid trading when price is far from the moving averages (MA20, MA50, MA100, MA200) — LONG. Price Action Strategies. Price action trading strategies.
Slide 6 of 24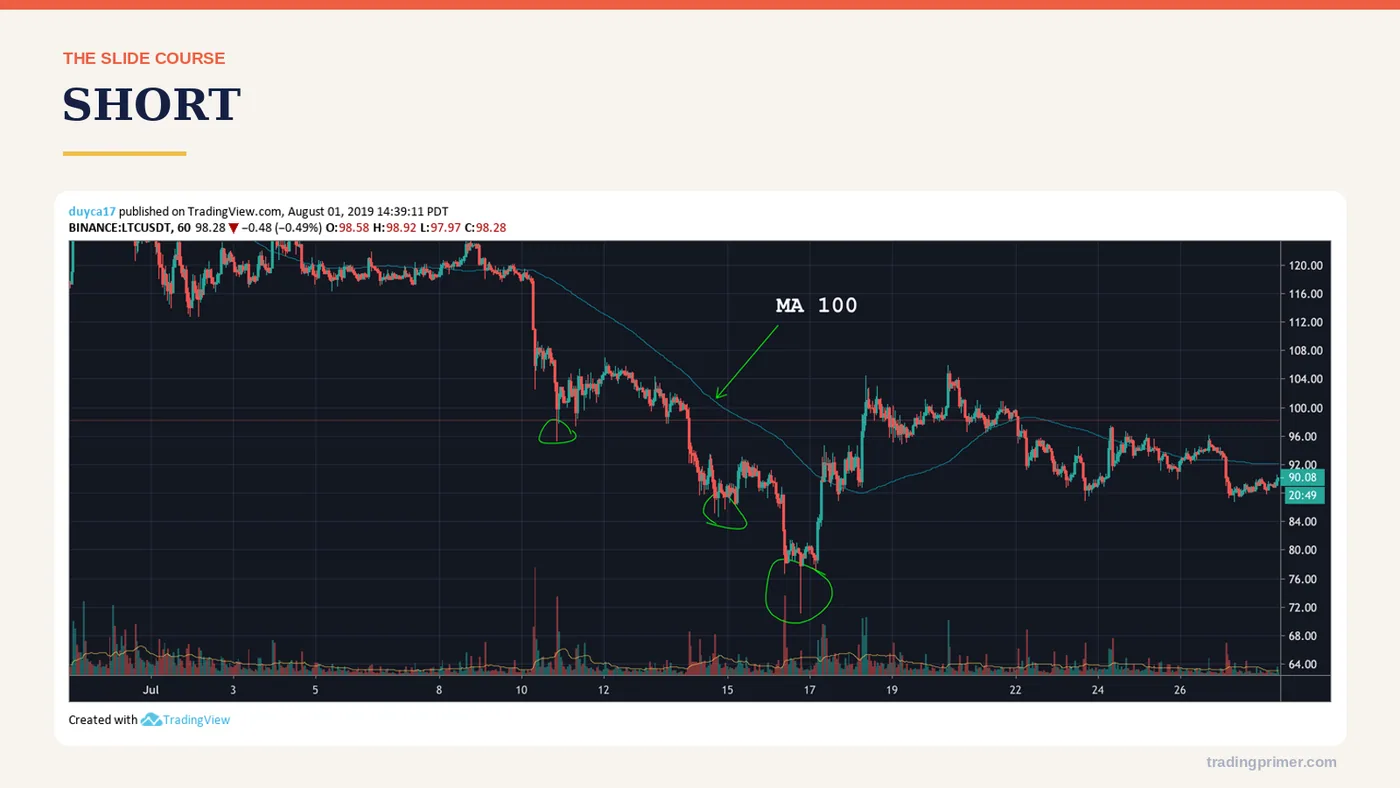
SHORT — The chart carries the detail; the markings on it are what the course is teaching here.
Slide 7 of 24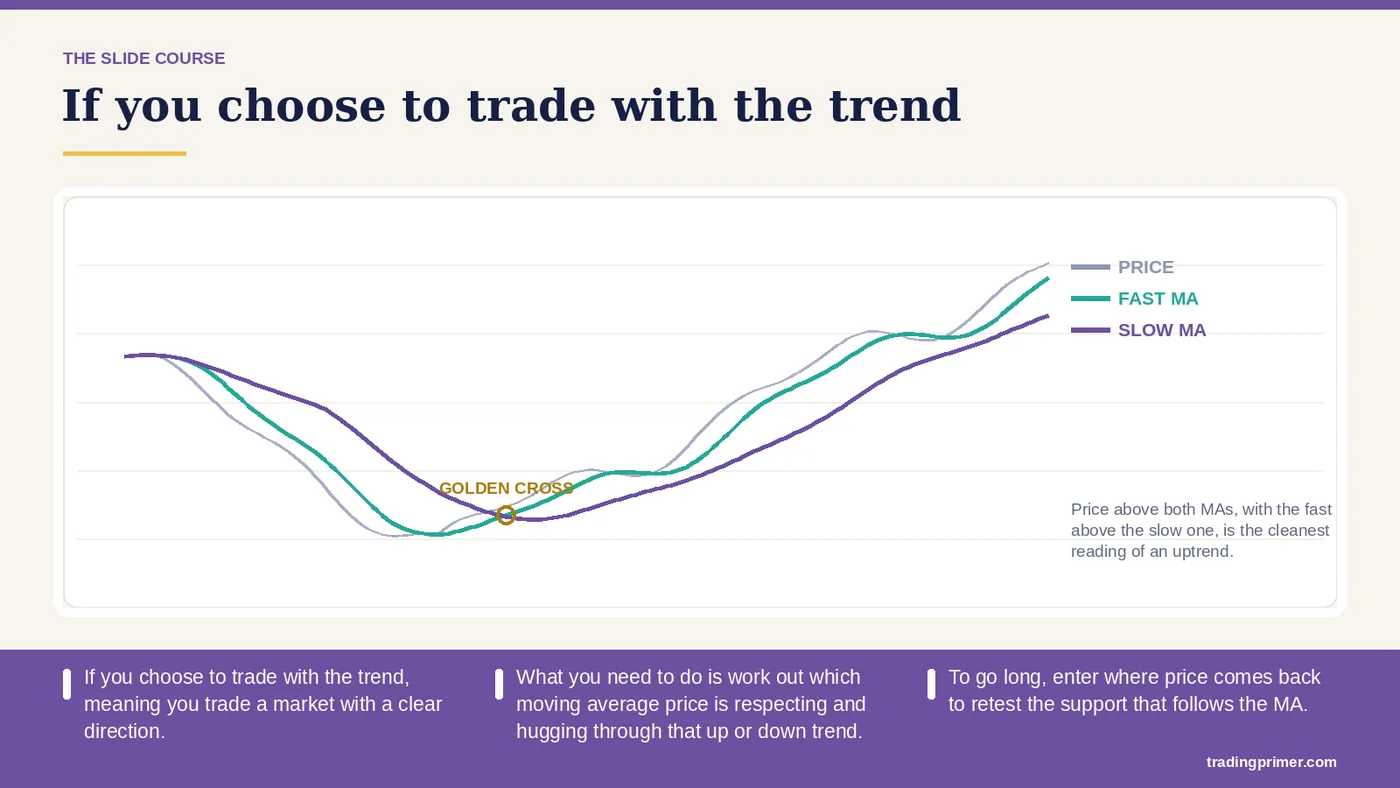
If you choose to trade with the trend, meaning you trade a market with a clear direction. — What you need to do is work out which moving average price is respecting and hugging through that up or down trend. To go long, enter where price comes back to retest the support that follows the MA. To go short, enter where price is rejected at the MAs.
Slide 8 of 24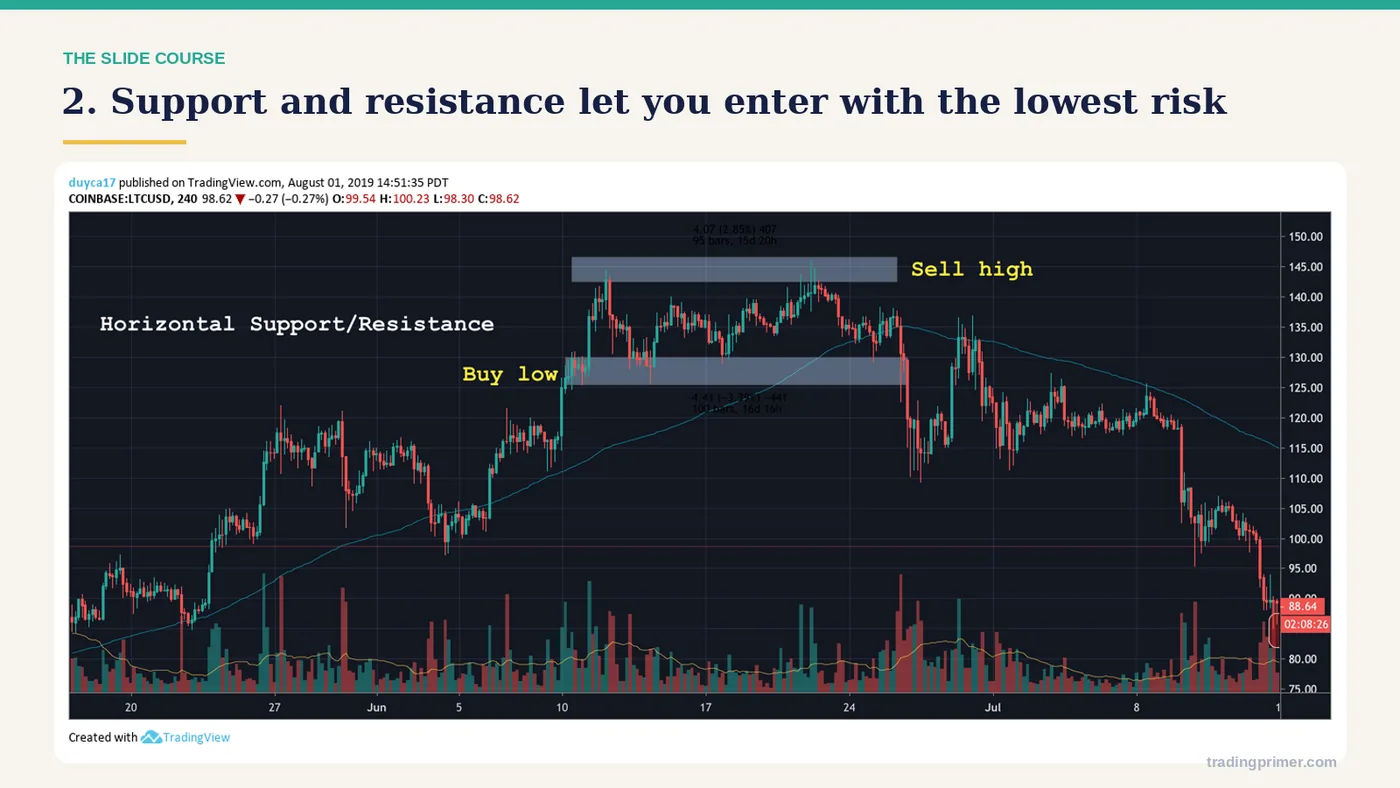
2. Support and resistance let you enter with the lowest risk — The chart carries the detail; the markings on it are what the course is teaching here.
Slide 9 of 24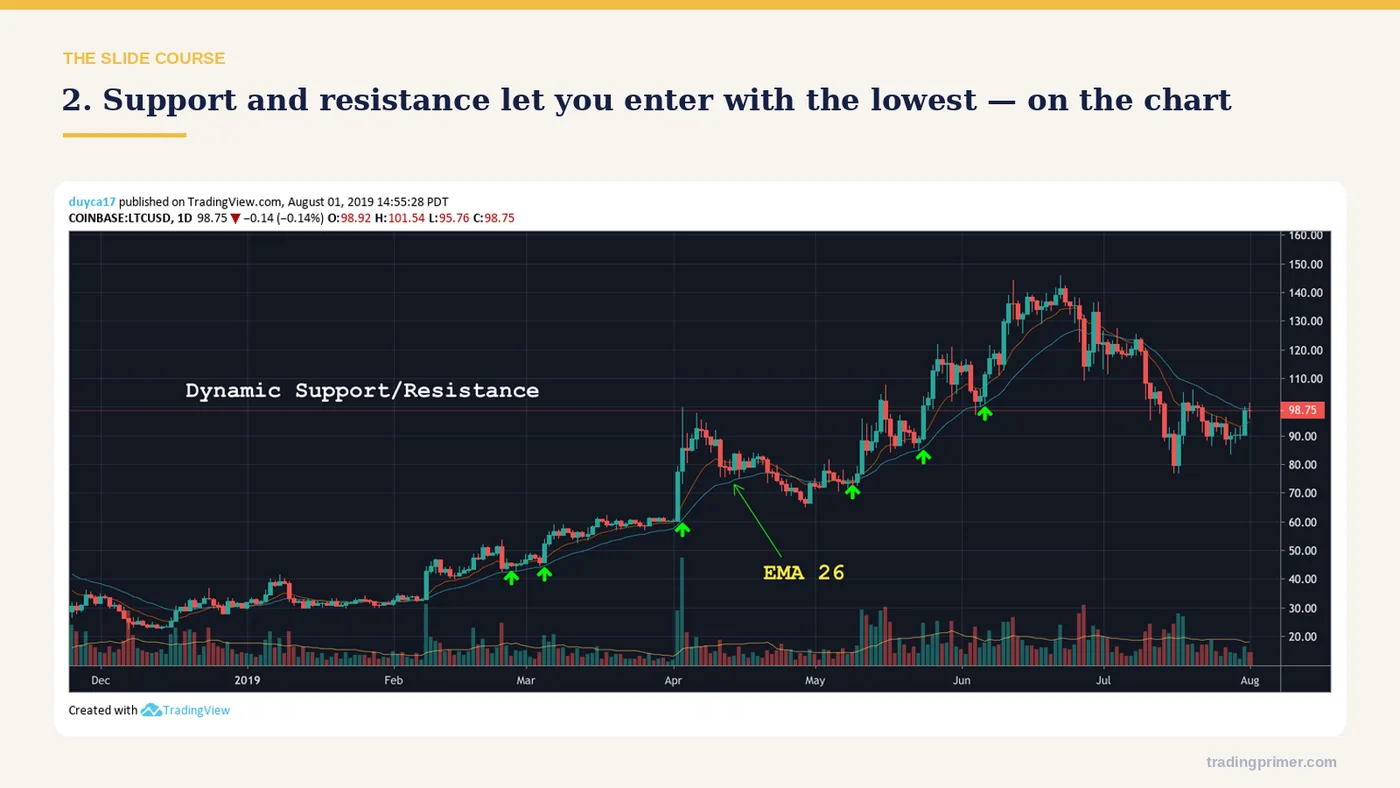
2. Support and resistance let you enter with the lowest risk — a chart from the course deck. The markings on it are the lesson; read them left to right.
Slide 10 of 24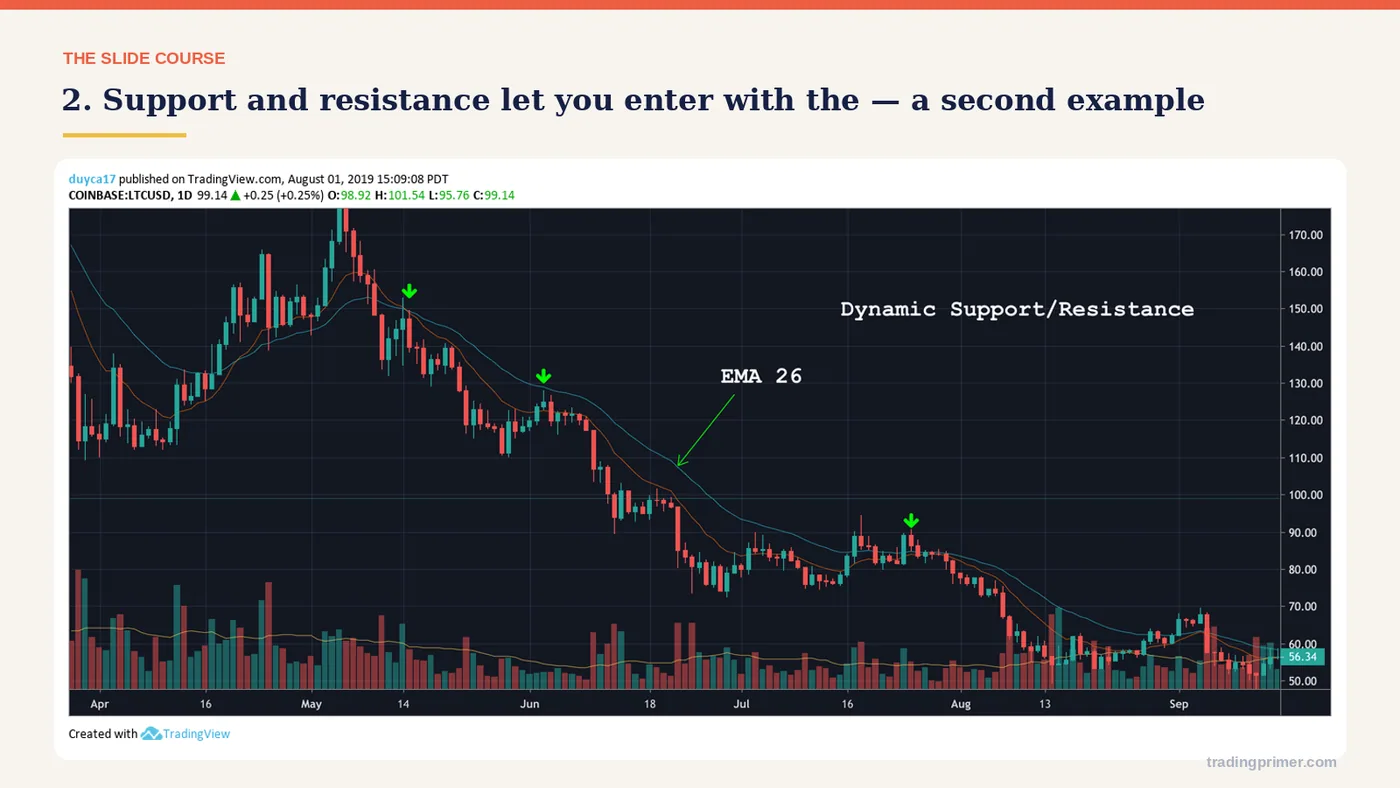
2. Support and resistance let you enter with the lowest risk — a chart from the course deck. The markings on it are the lesson; read them left to right.
Slide 11 of 24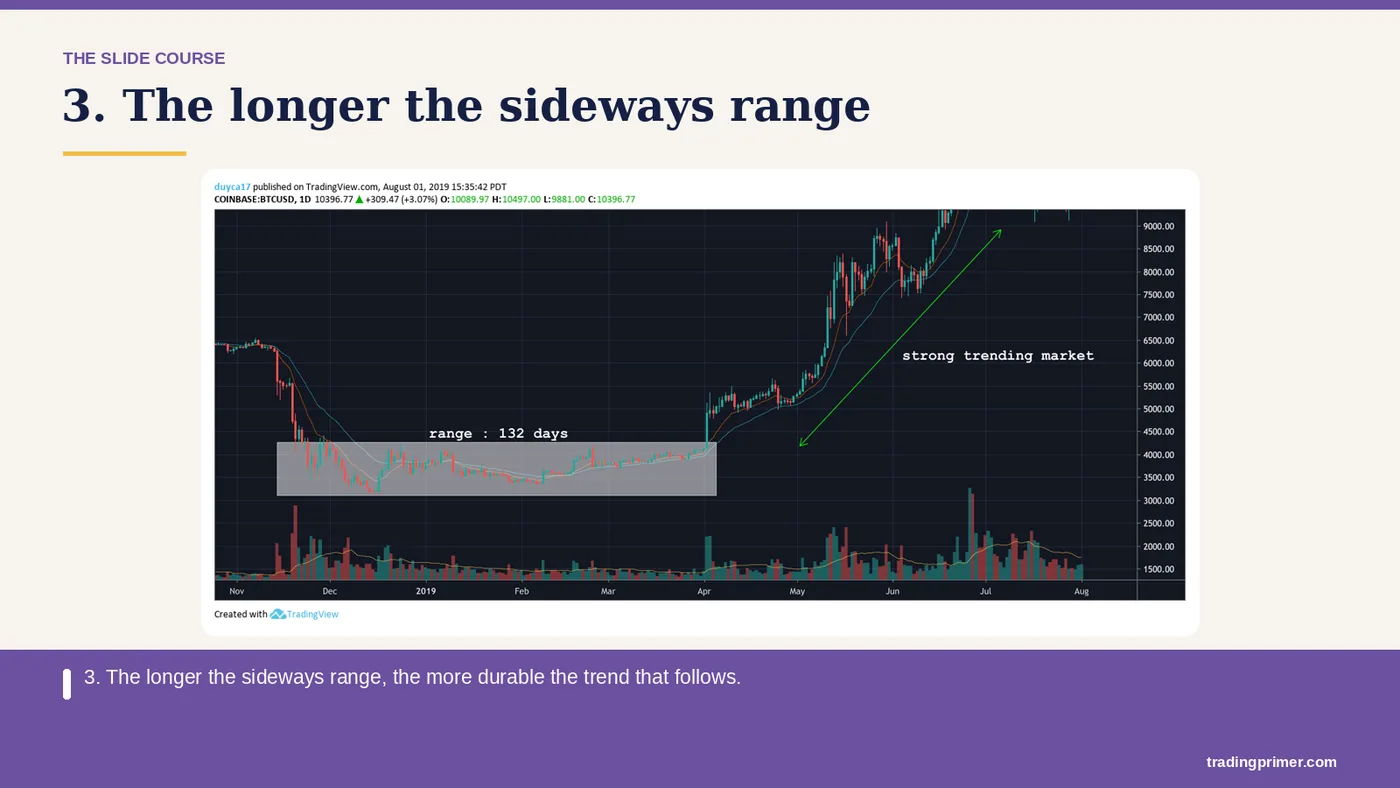
3. The longer the sideways range, the more durable the trend that follows — The chart carries the detail; the markings on it are what the course is teaching here.
Slide 12 of 24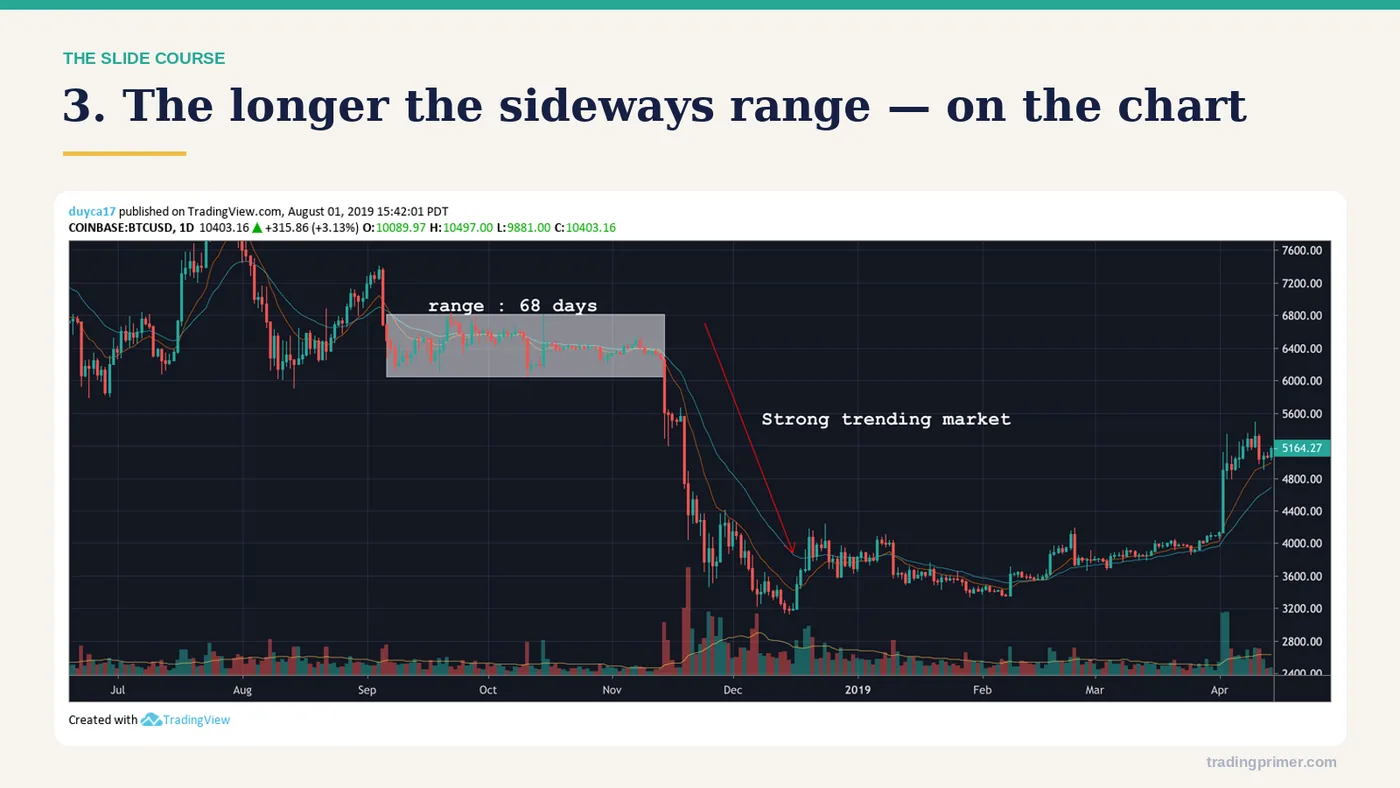
3. The longer the sideways range, the more durable the trend that follows — a chart from the course deck. The markings on it are the lesson; read them left to right.
Slide 13 of 24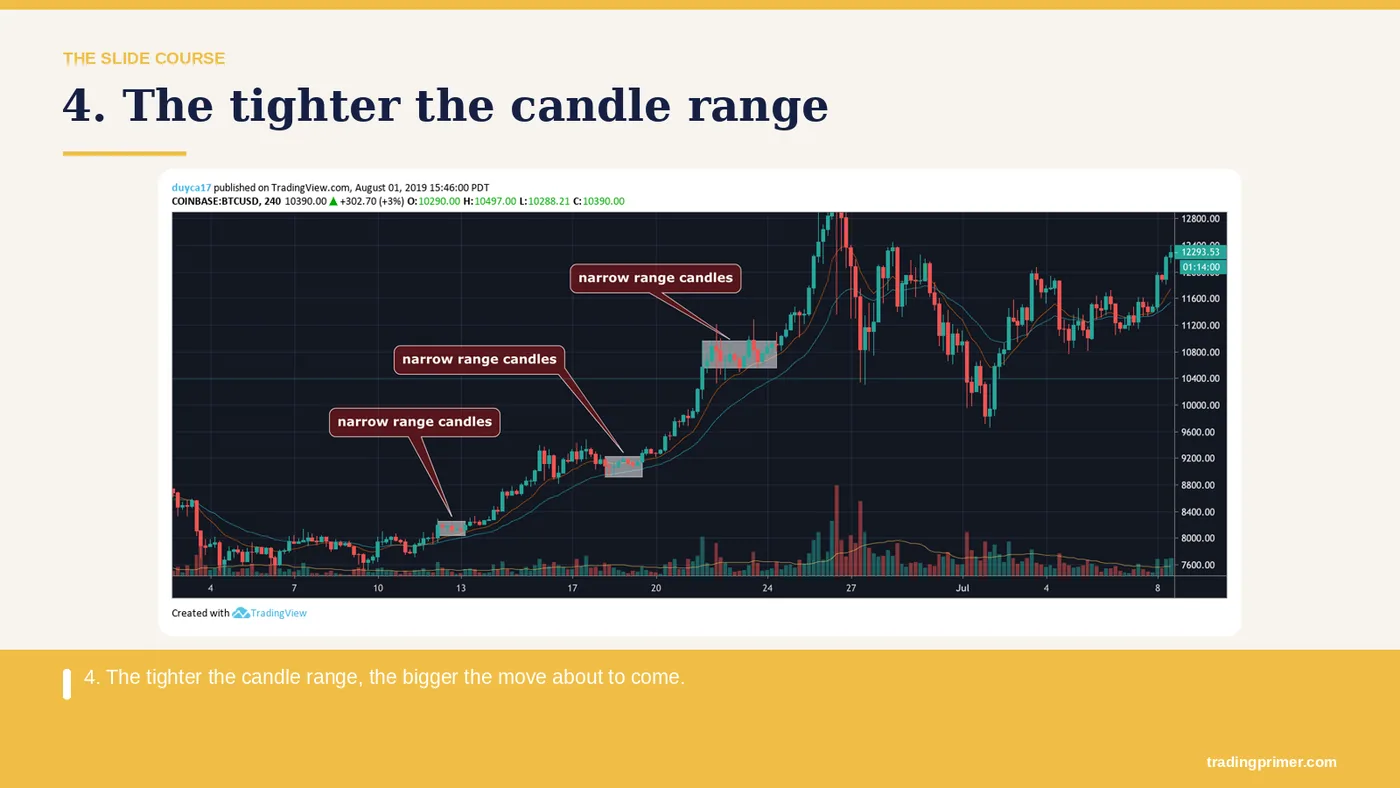
4. The tighter the candle range, the bigger the move about to come — The chart carries the detail; the markings on it are what the course is teaching here.
Slide 14 of 24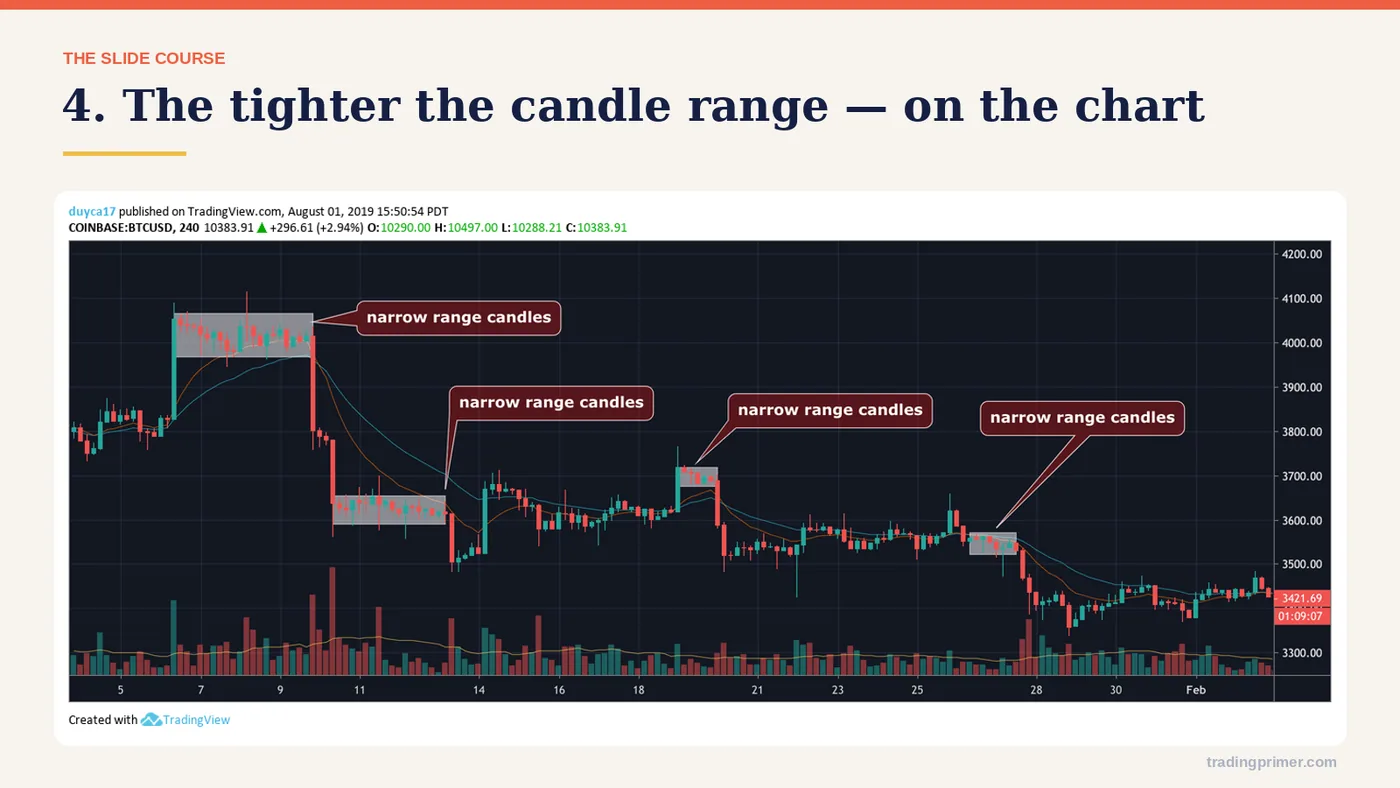
4. The tighter the candle range, the bigger the move about to come — a chart from the course deck. The markings on it are the lesson; read them left to right.
Slide 15 of 24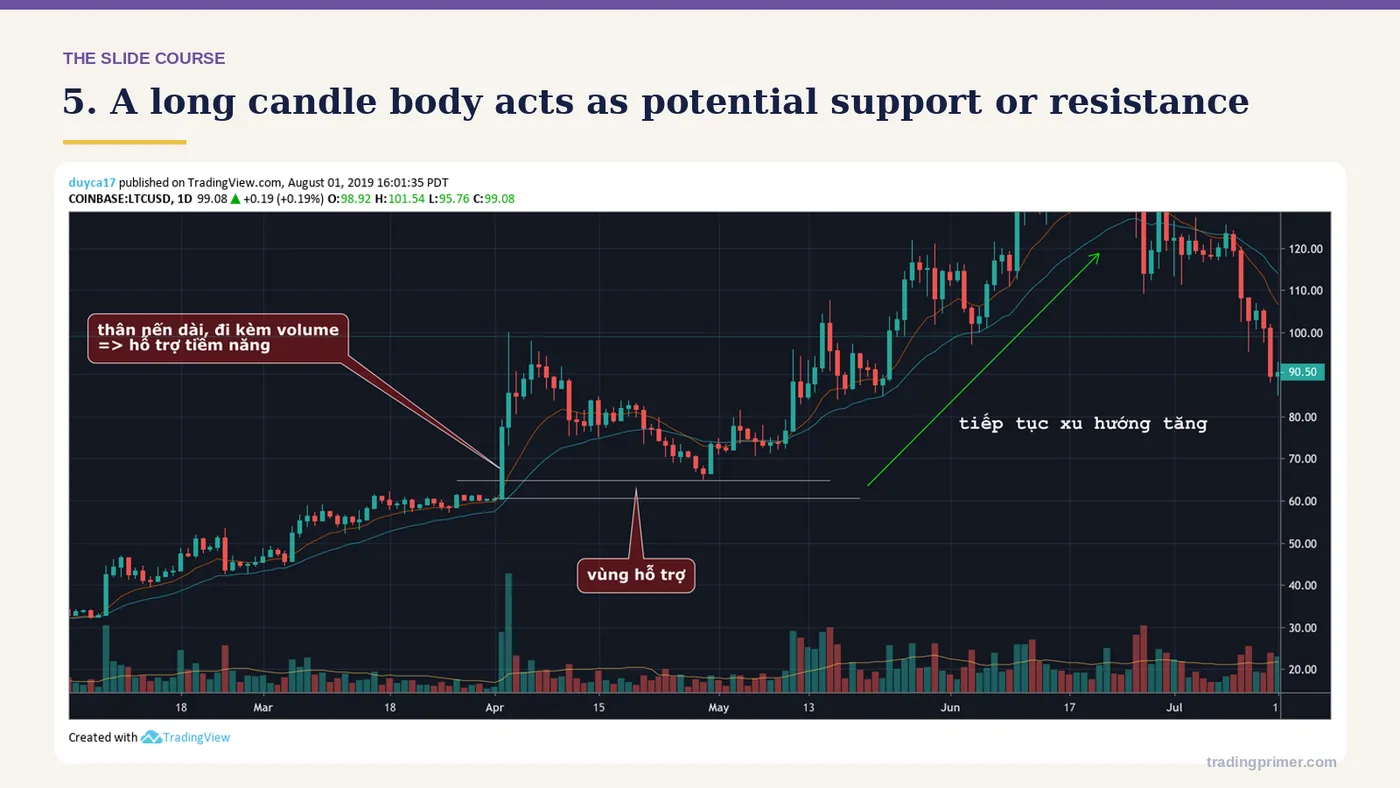
5. A long candle body acts as potential support or resistance — The chart carries the detail; the markings on it are what the course is teaching here.
Slide 16 of 24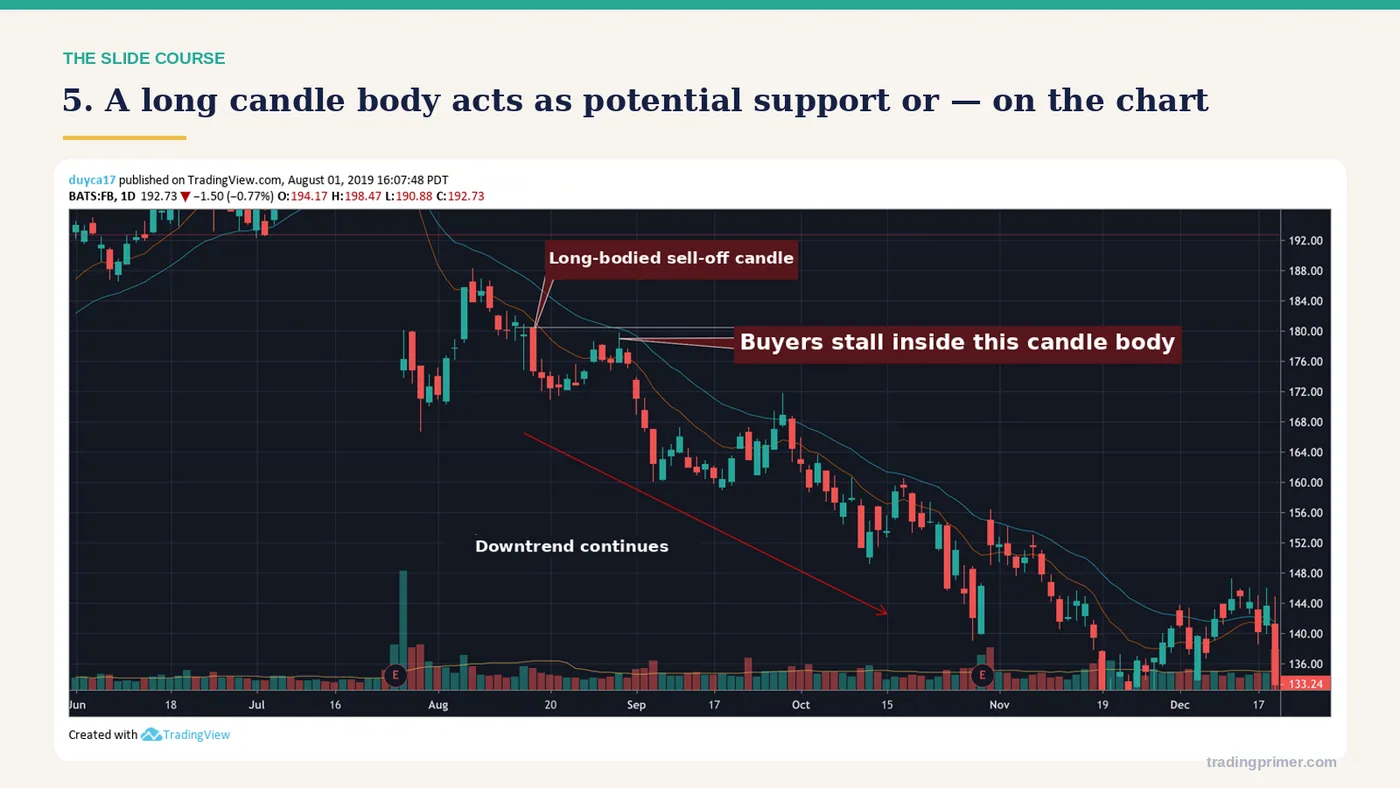
5. A long candle body acts as potential support or resistance — a chart from the course deck. The markings on it are the lesson; read them left to right.
Slide 17 of 24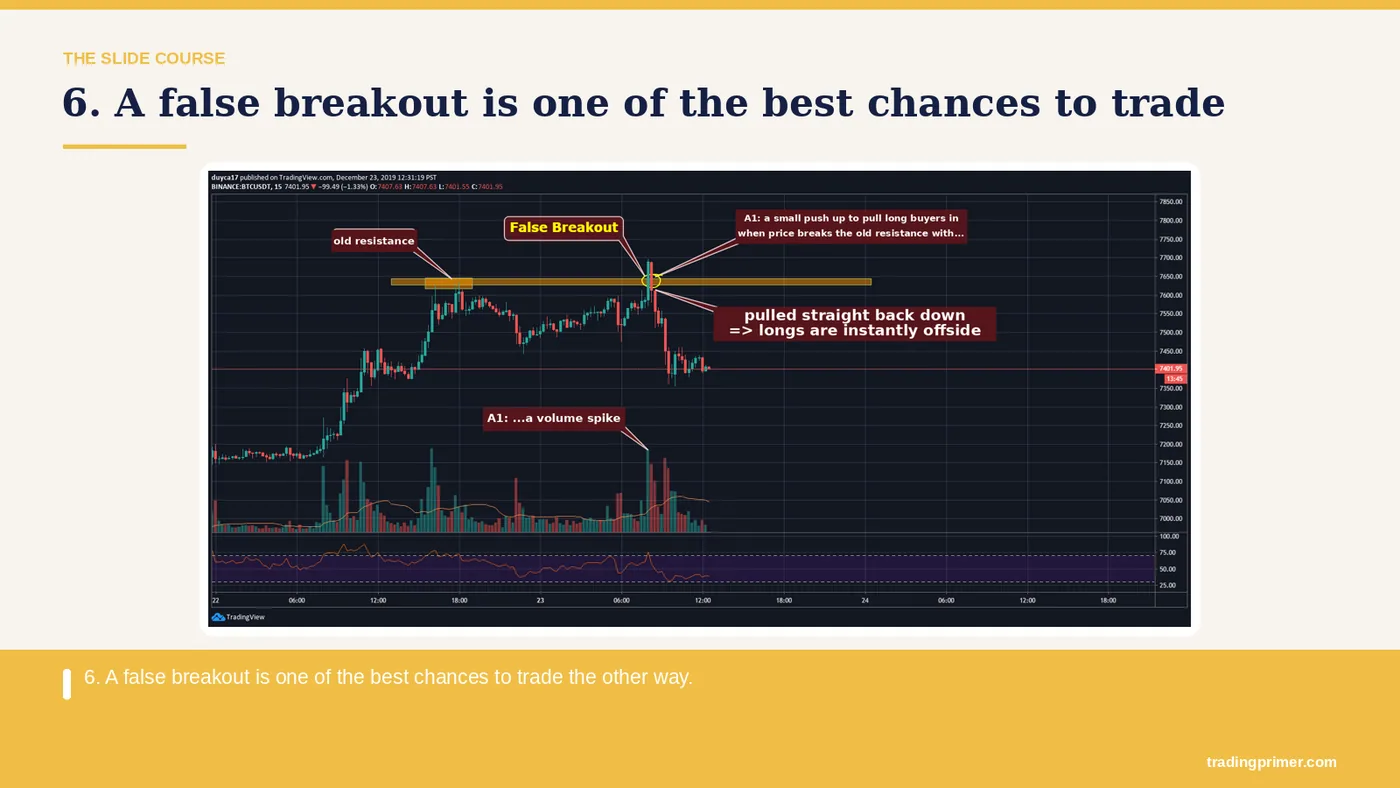
6. A false breakout is one of the best chances to trade — the other way.
Slide 18 of 24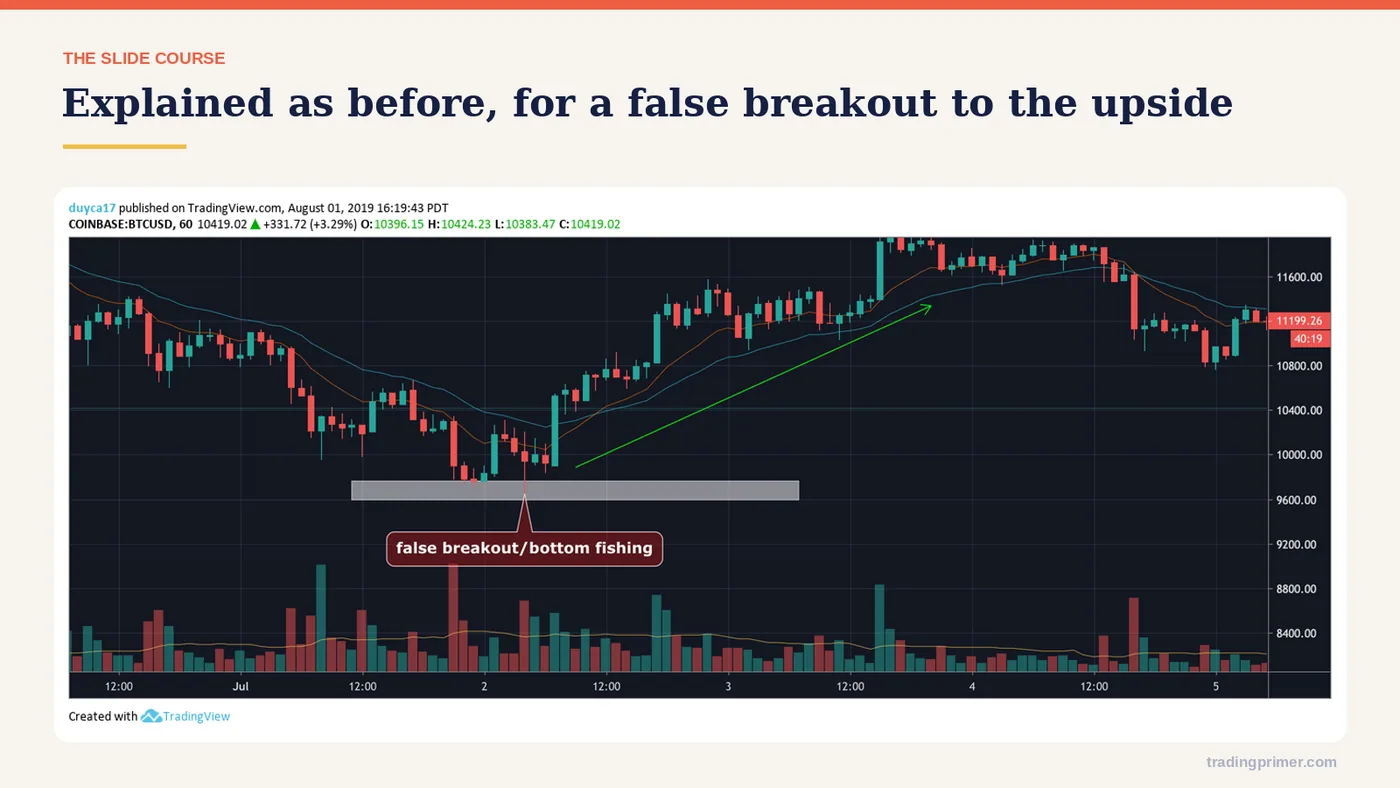
Explained as before, for a false breakout to the upside — The chart carries the detail; the markings on it are what the course is teaching here.
Slide 19 of 24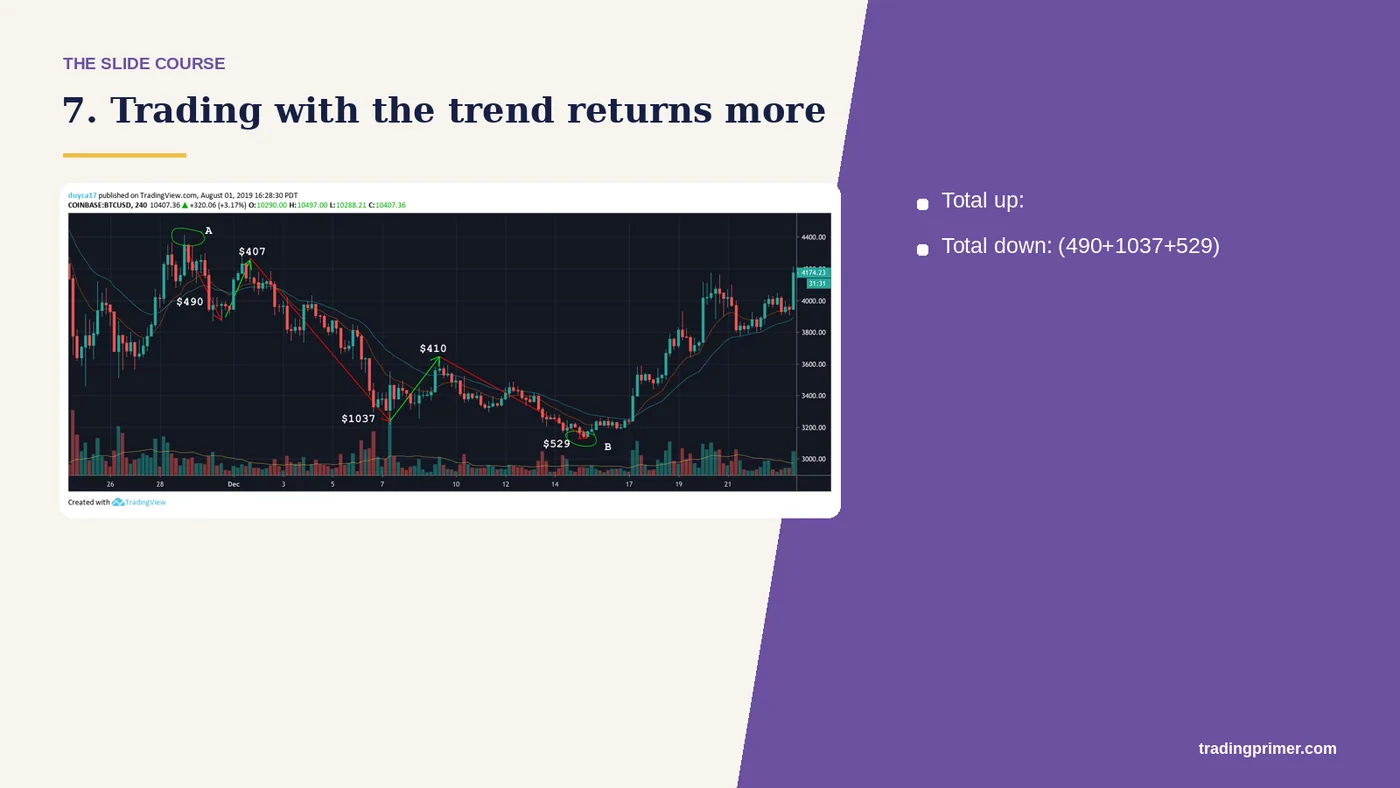
7. Trading with the trend returns more — Total up: (407+410). Total down: (490+1037+529).
Slide 20 of 24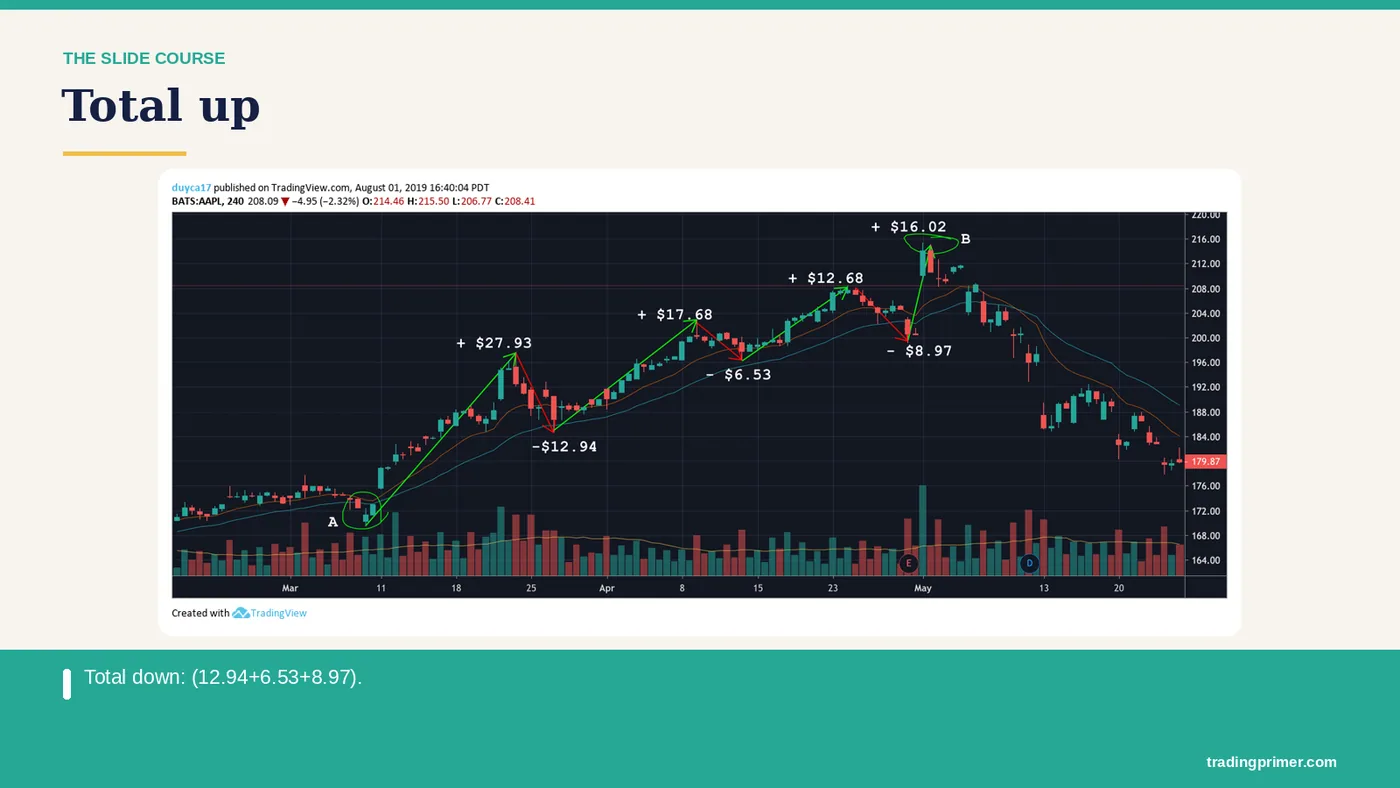
Total up: — (27.93+17.68+ 12.68+16.02). Total down: (12.94+6.53+8.97).
Slide 21 of 24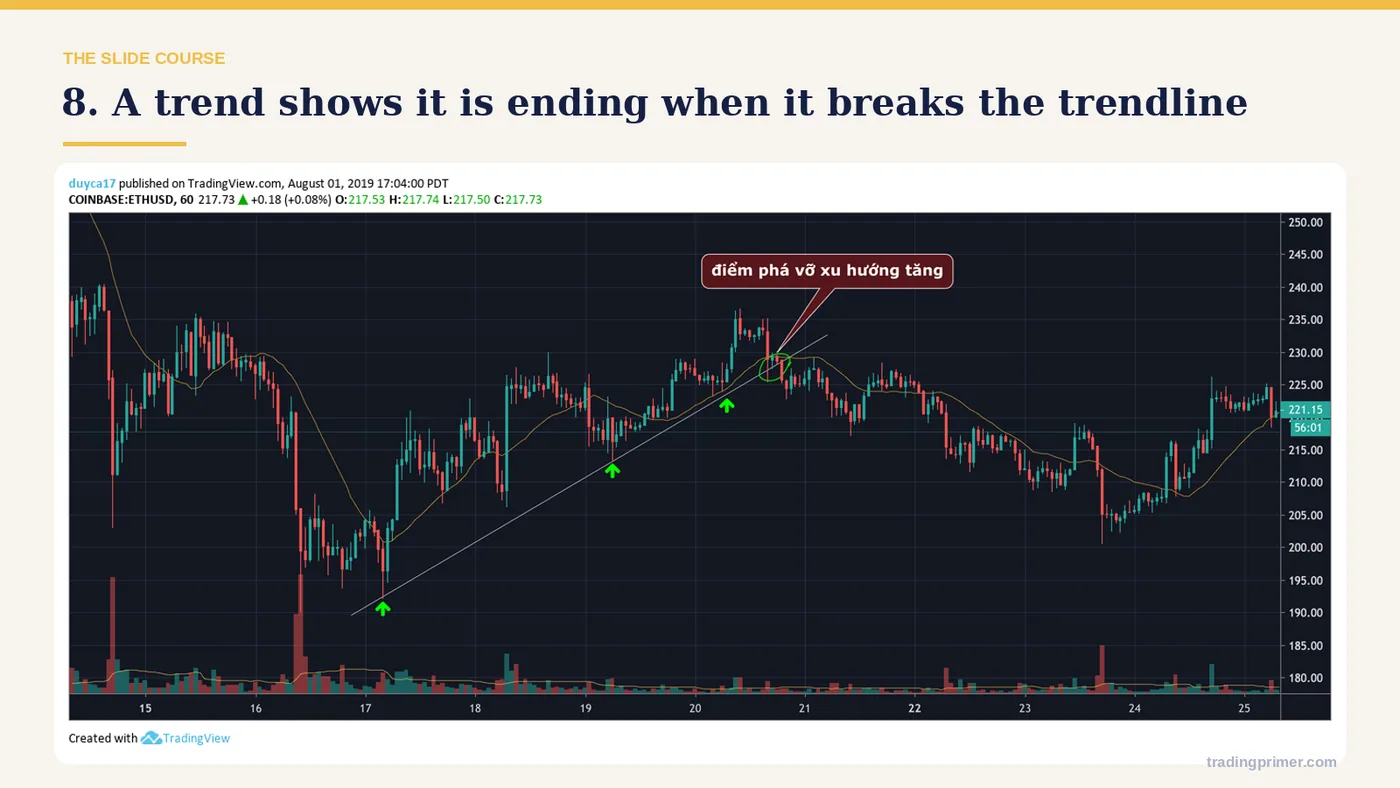
8. A trend shows it is ending when it breaks the trendline — The chart carries the detail; the markings on it are what the course is teaching here.
Slide 22 of 24
Strategies for — trading price action.
Slide 23 of 24
Strategies for trading price action — a chart from the course deck. The markings on it are the lesson; read them left to right.
Slide 24 of 24What this part covers
16 topics, in order. Each link jumps straight to that slide.
Prefer it as a PDF?
The same ten parts, downloadable, to keep next to your charts.