Part 7 — Support and resistance
The unchanging rules of levels, build-ups, and a five-step process for marking them. All 25 slides in the order the course teaches them — each one explained underneath.
Support and Resistance Zones — How To Identify Support and Resistance. Every Kind Of Divergence. How To Protect Yourself. From False Divergence. PART VII.
Slide 1 of 25
All completely wrong — The myths about. support and resistance.
Slide 2 of 25
A strategy for trading support and resistance — How do you tell when support or resistance is going to break? Five unchanging rules of support and resistance. What is there to learn about support and resistance?
Slide 3 of 25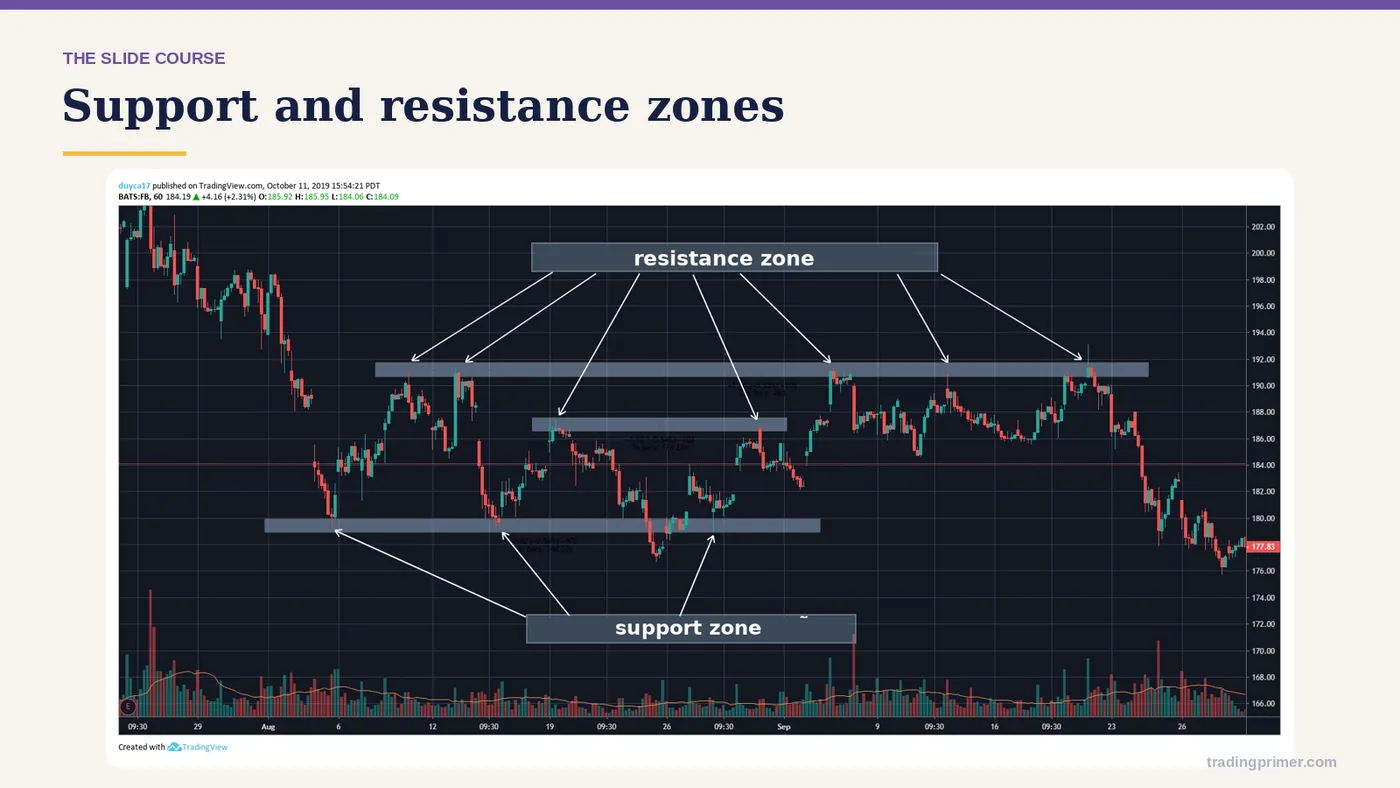
Support and resistance zones — The chart carries the detail; the markings on it are what the course is teaching here.
Slide 4 of 25
The area where buying appears, which can stop a fall and lift price back up. — Support area. Resistance area. The area where selling appears, which can make it hard for price to get through and throw it back.
Slide 5 of 25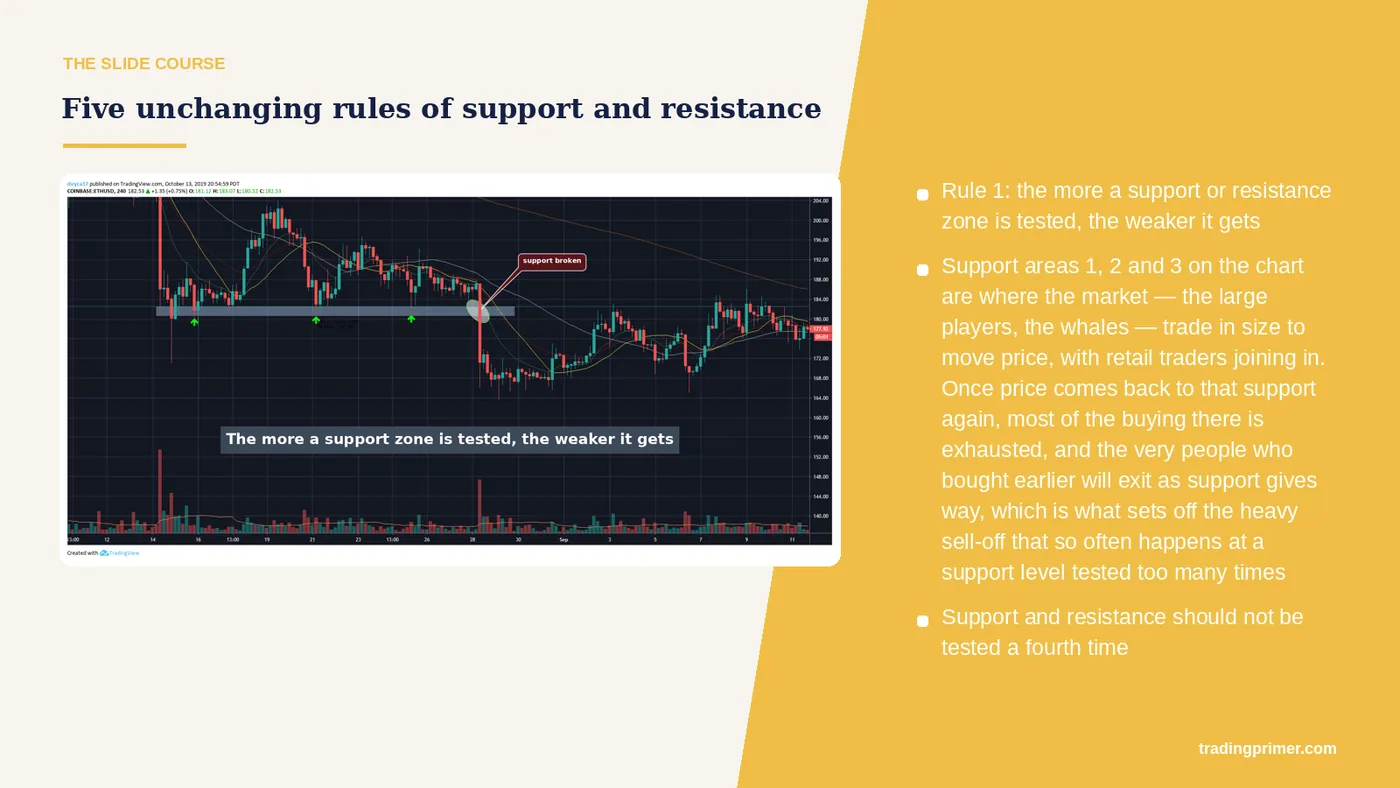
Rule 1: the more a support or resistance zone is tested, the weaker it gets — Five unchanging rules of. support and resistance. Support areas 1, 2 and 3 on the chart are where the market — the large players, the whales — trade in size to move price, with retail traders joining in. Once price comes back to that support again, most of the buying there is exhausted, and the very people who bought earlier will exit as support gives way, which is what sets off the heavy sell-off that so often happens at a support level tested too many times. Support and resistance should not be tested a fourth time.
Slide 6 of 25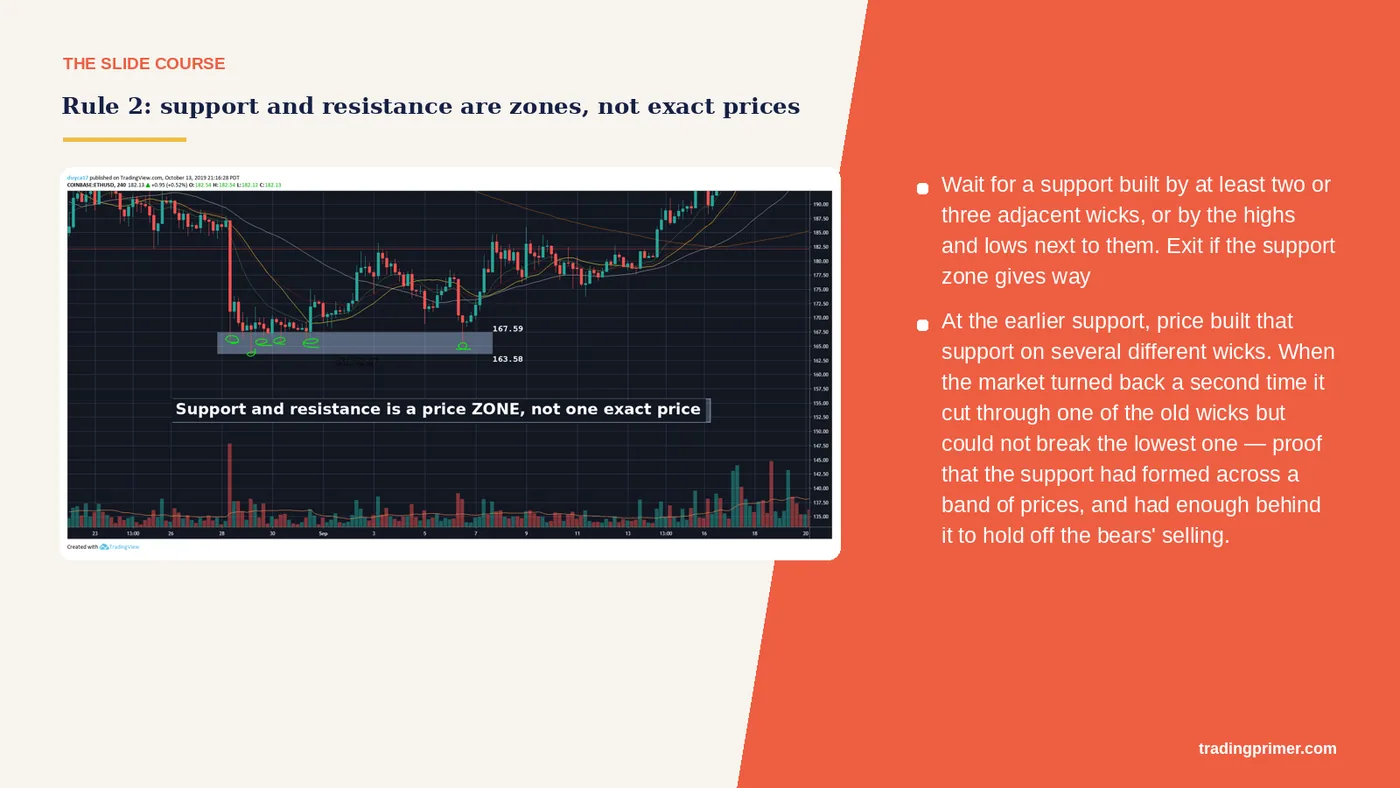
Rule 2: support and resistance are zones, not exact prices — At the earlier support, price built that support on several different wicks. When the market turned back a second time it cut through one of the old wicks but could not break the lowest one — proof that the support had formed across a band of prices, and had enough behind it to hold off the bears' selling. Wait for a support built by at least two or three adjacent wicks, or by the highs and lows next to them. Exit if the support zone gives way.
Slide 7 of 25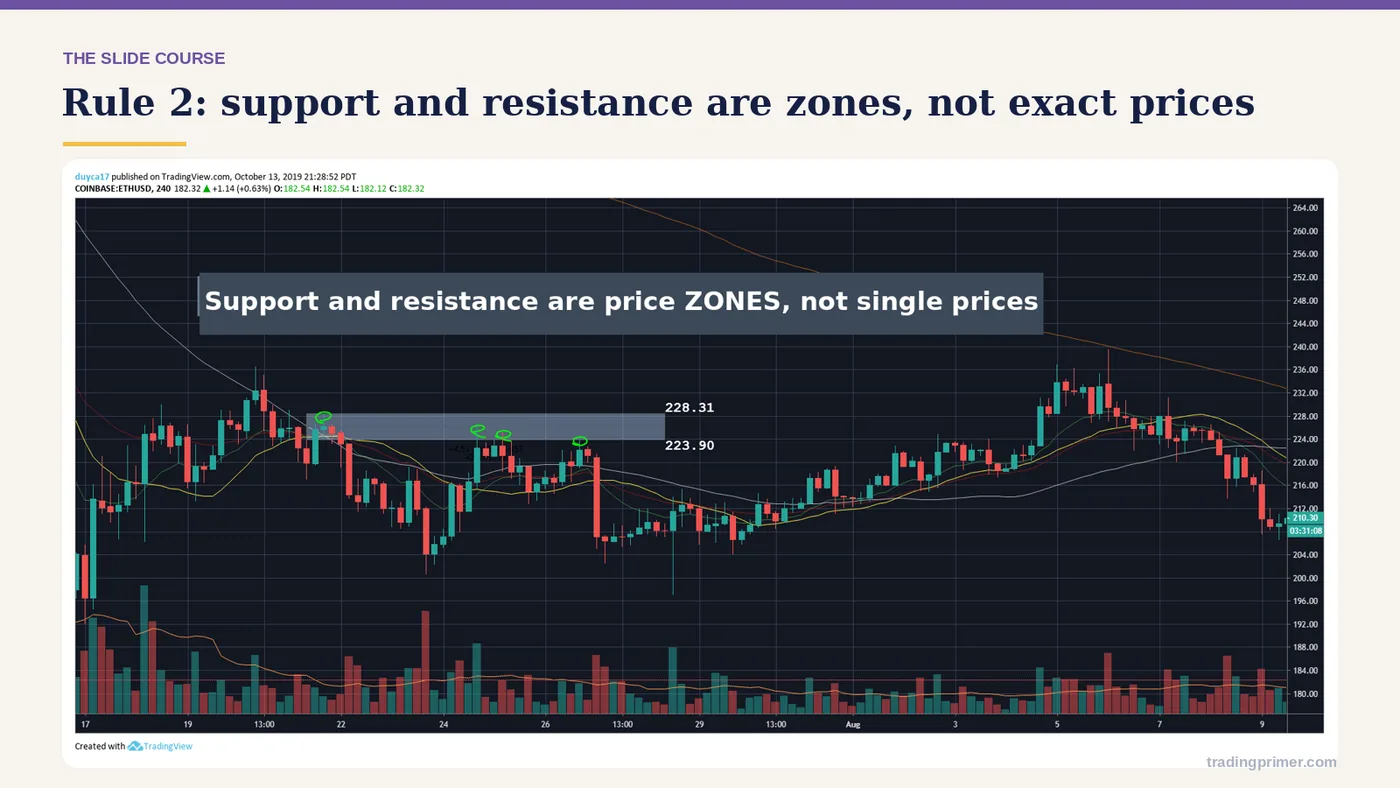
Rule 2: support and resistance are zones, not exact prices — The chart carries the detail; the markings on it are what the course is teaching here.
Slide 8 of 25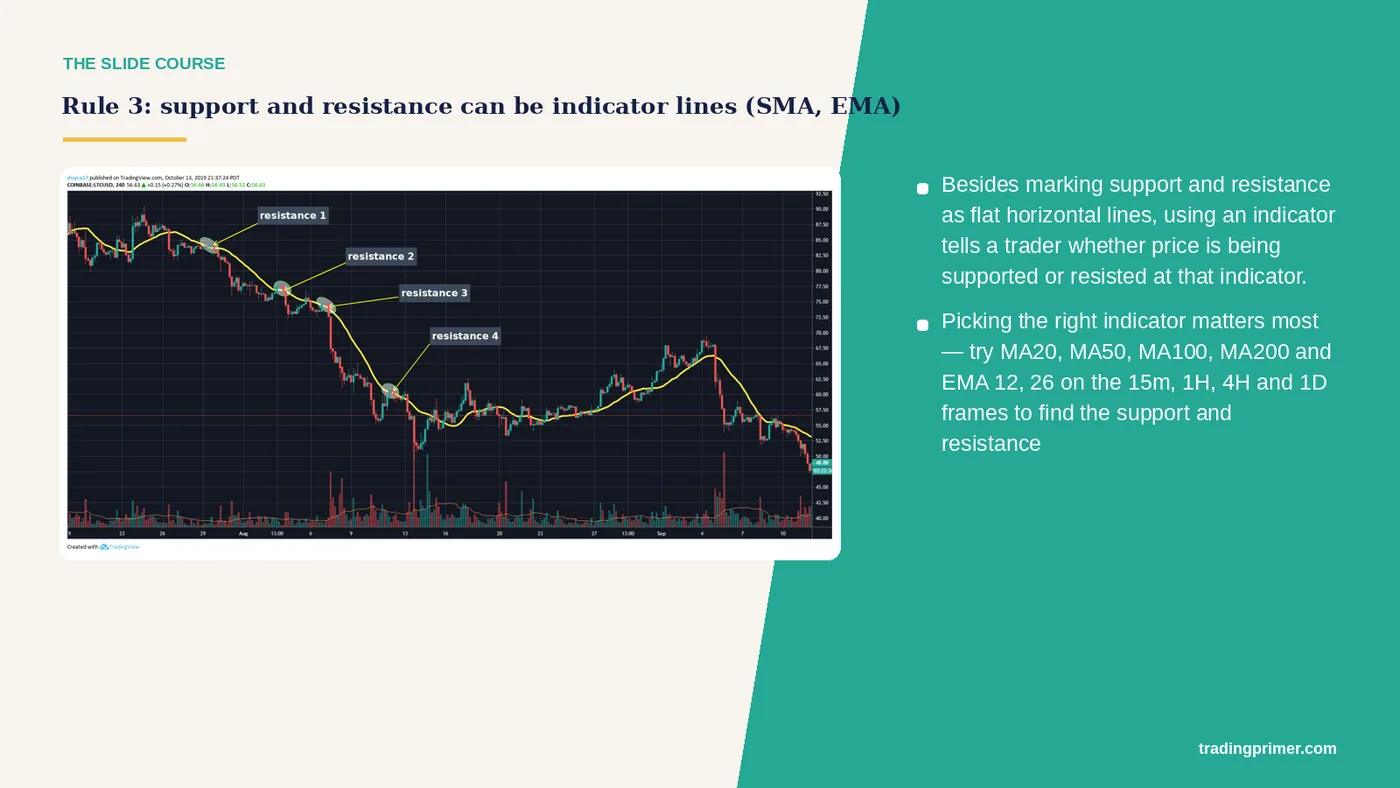
Rule 3: support and resistance can be indicator lines (SMA, EMA) — Besides marking support and resistance as flat horizontal lines, using an indicator tells a trader whether price is being supported or resisted at that indicator. Picking the right indicator matters most — try MA20, MA50, MA100, MA200 and EMA 12, 26 on the 15m, 1H, 4H and 1D frames to find the support and resistance.
Slide 9 of 25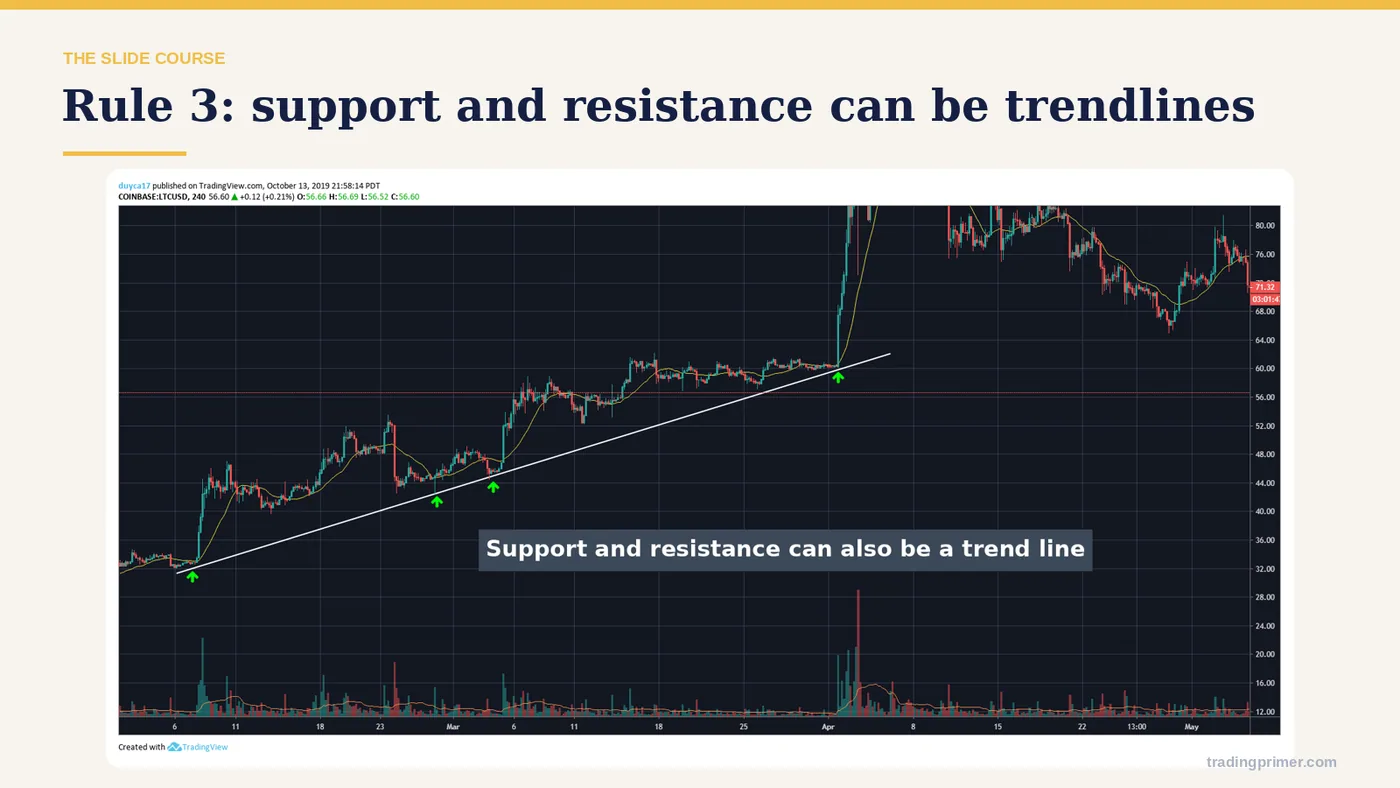
Rule 3: support and resistance can be trendlines — The chart carries the detail; the markings on it are what the course is teaching here.
Slide 10 of 25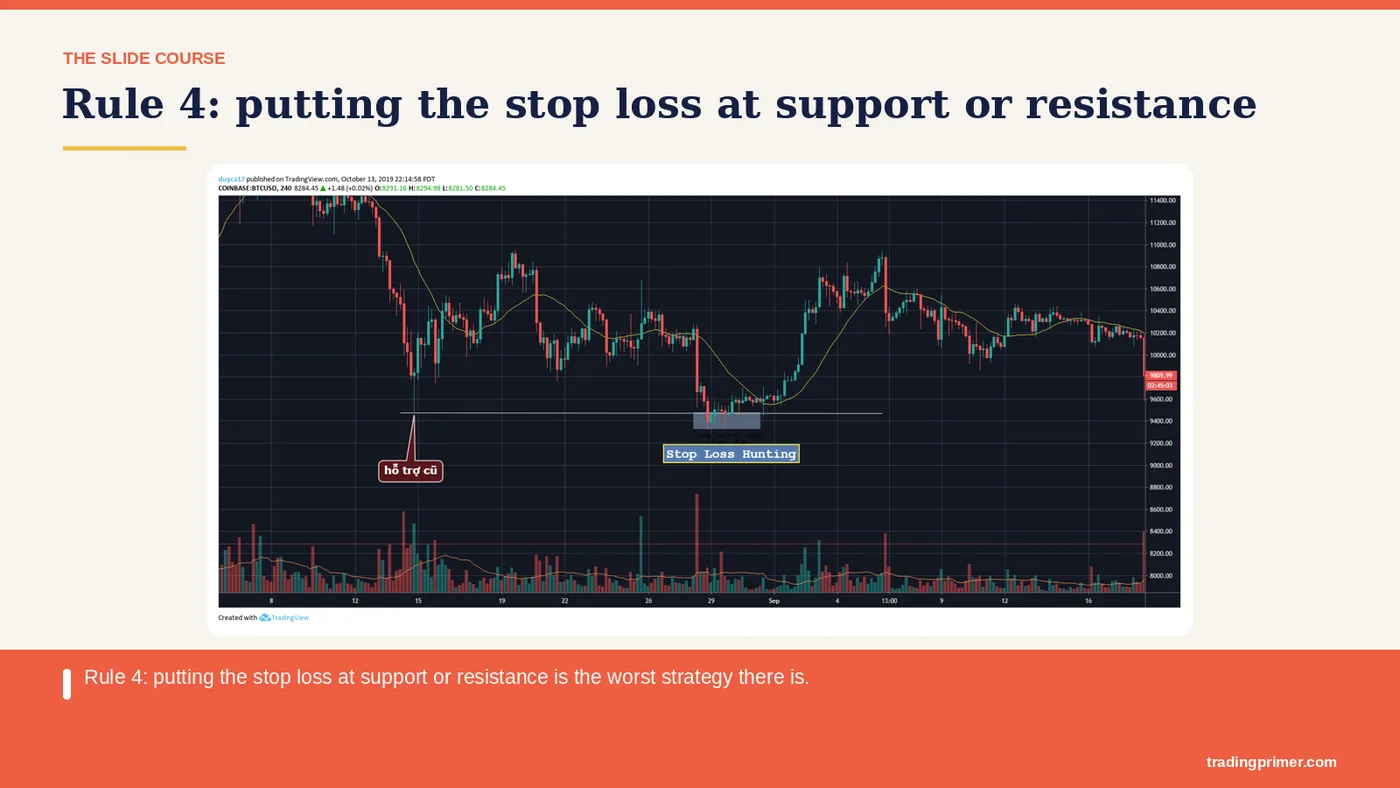
Rule 4: putting the stop loss at support or resistance is the worst strategy there is — The shape is drawn on the chart with the levels that define it. What matters is where it forms and what price does at the boundary, not the name.
Slide 11 of 25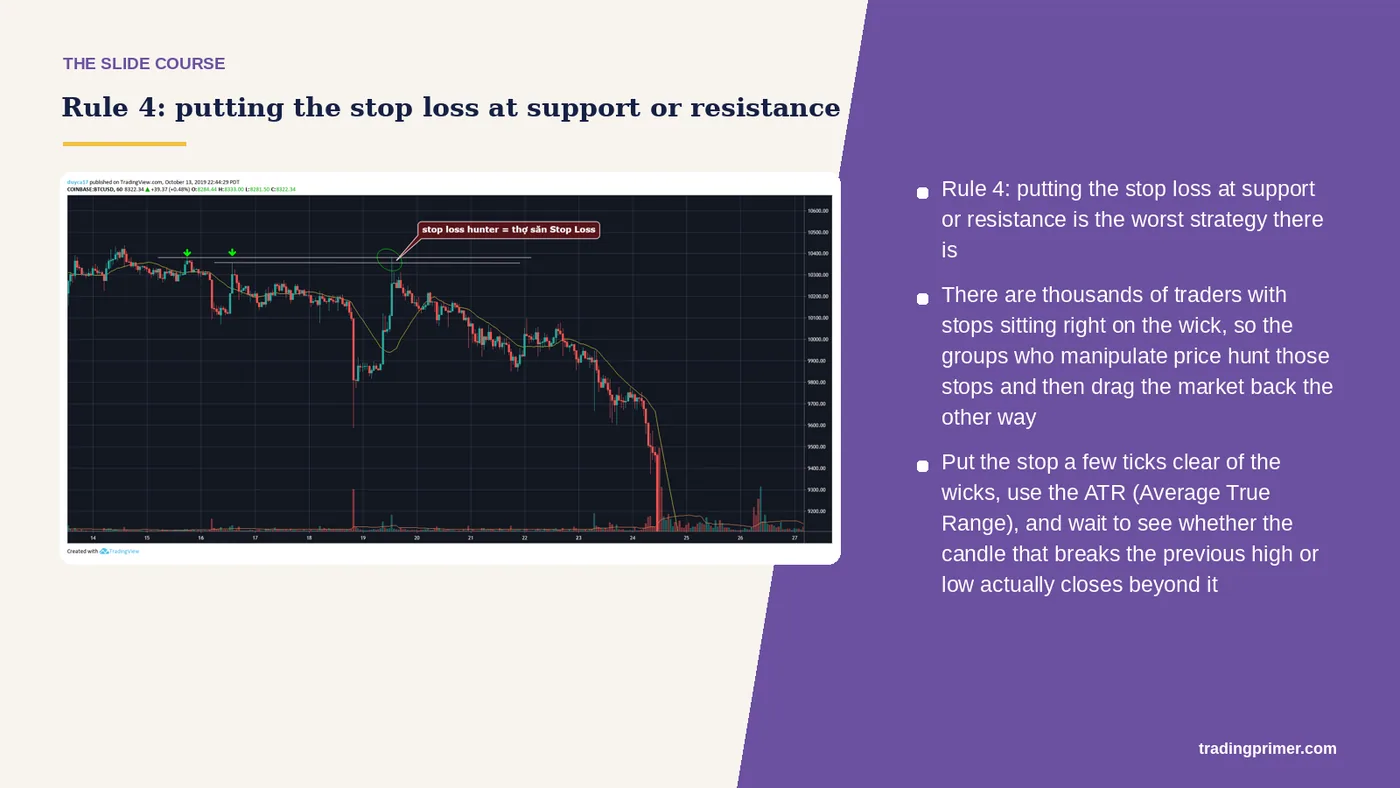
Rule 4: putting the stop loss at support or resistance is the worst strategy there is — There are thousands of traders with stops sitting right on the wick, so the groups who manipulate price hunt those stops and then drag the market back the other way. Put the stop a few ticks clear of the wicks, use the ATR (Average True Range), and wait to see whether the candle that breaks the previous high or low actually closes beyond it.
Slide 12 of 25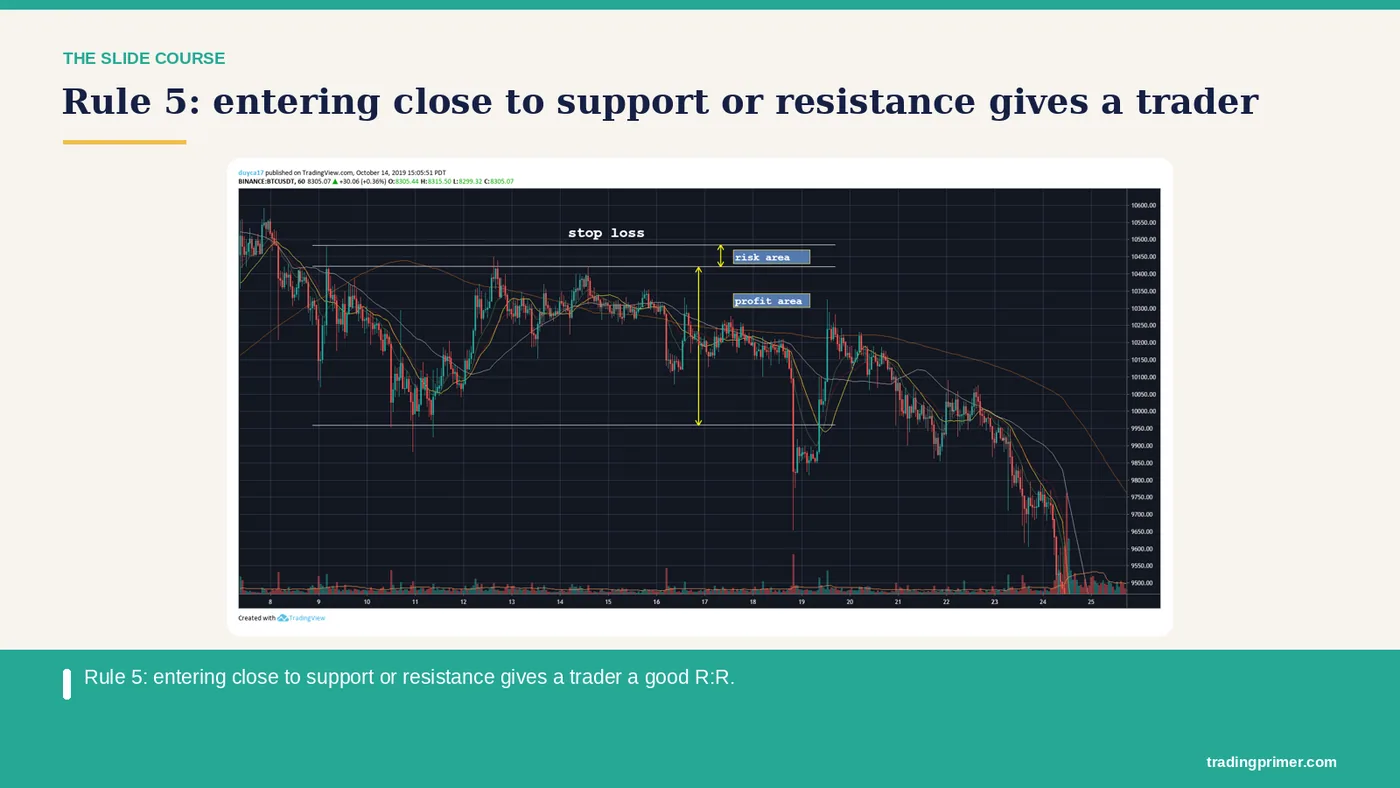
Rule 5: entering close to support or resistance gives a trader a good R:R — The chart carries the detail; the markings on it are what the course is teaching here.
Slide 13 of 25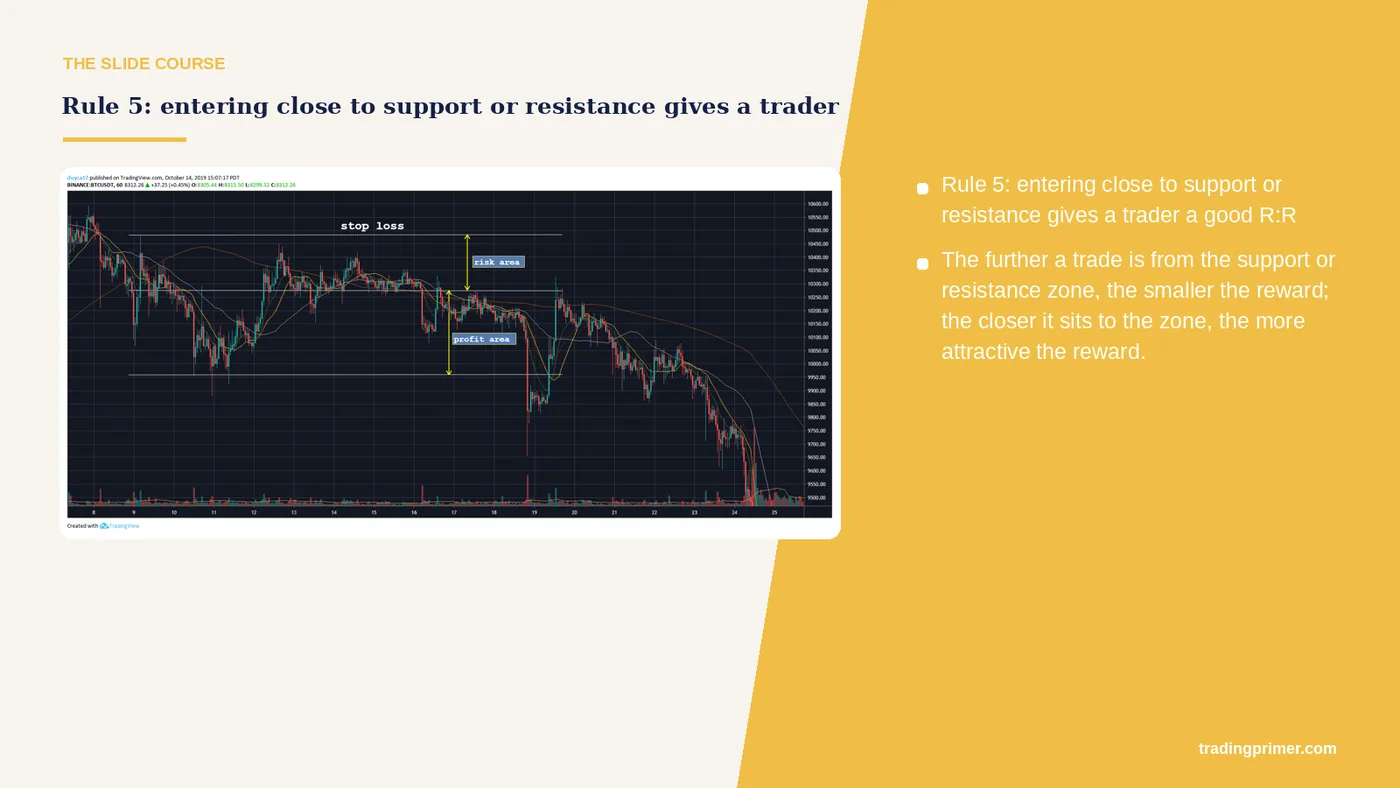
Rule 5: entering close to support or resistance gives a trader a good R:R — The further a trade is from the support or resistance zone, the smaller the reward; the closer it sits to the zone, the more attractive the reward.
Slide 14 of 25
How do you tell when — support or resistance is going to break?
Slide 15 of 25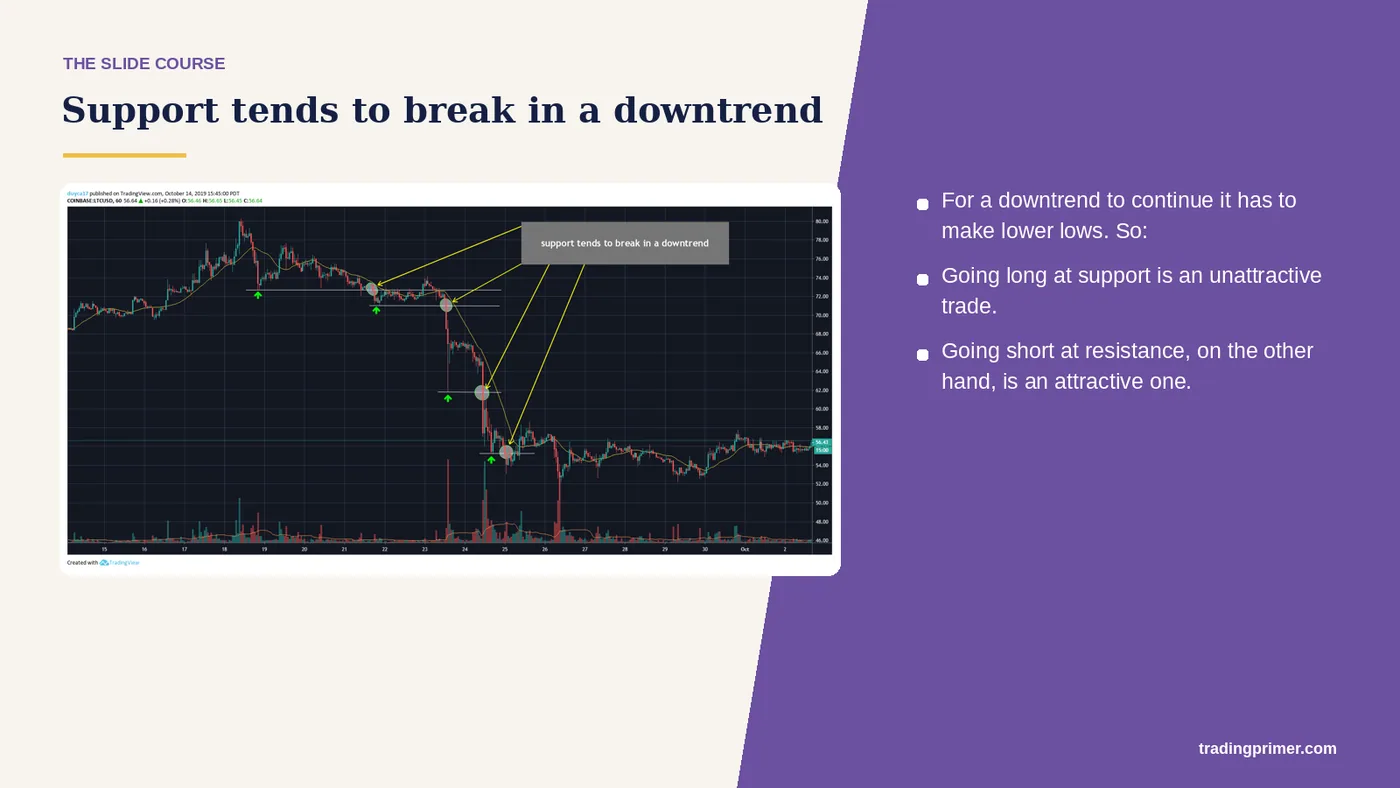
Support tends to break — in a downtrend. For a downtrend to continue it has to make lower lows. So: Going long at support is an unattractive trade. Going short at resistance, on the other hand, is an attractive one.
Slide 16 of 25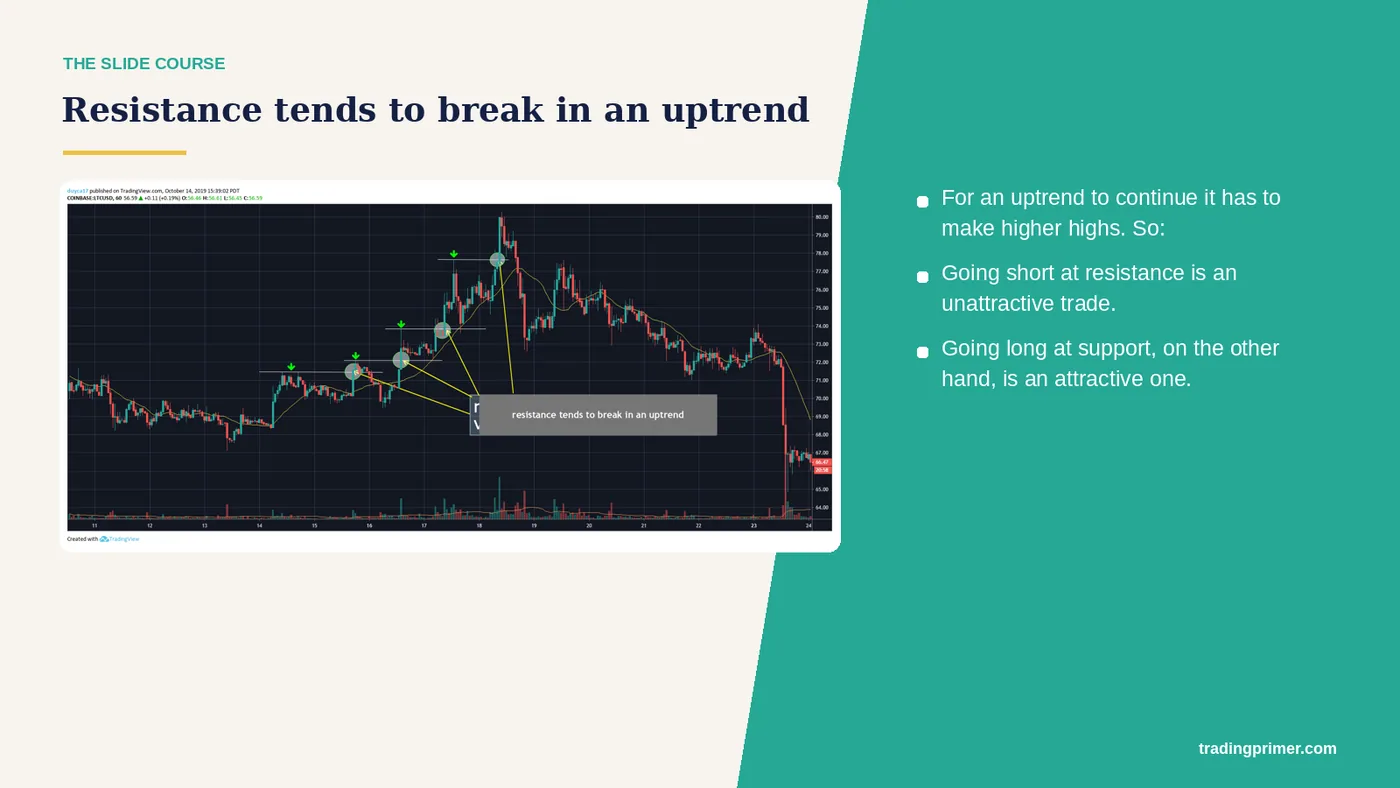
Resistance tends to break — in an uptrend. For an uptrend to continue it has to make higher highs. So: Going short at resistance is an unattractive trade. Going long at support, on the other hand, is an attractive one.
Slide 17 of 25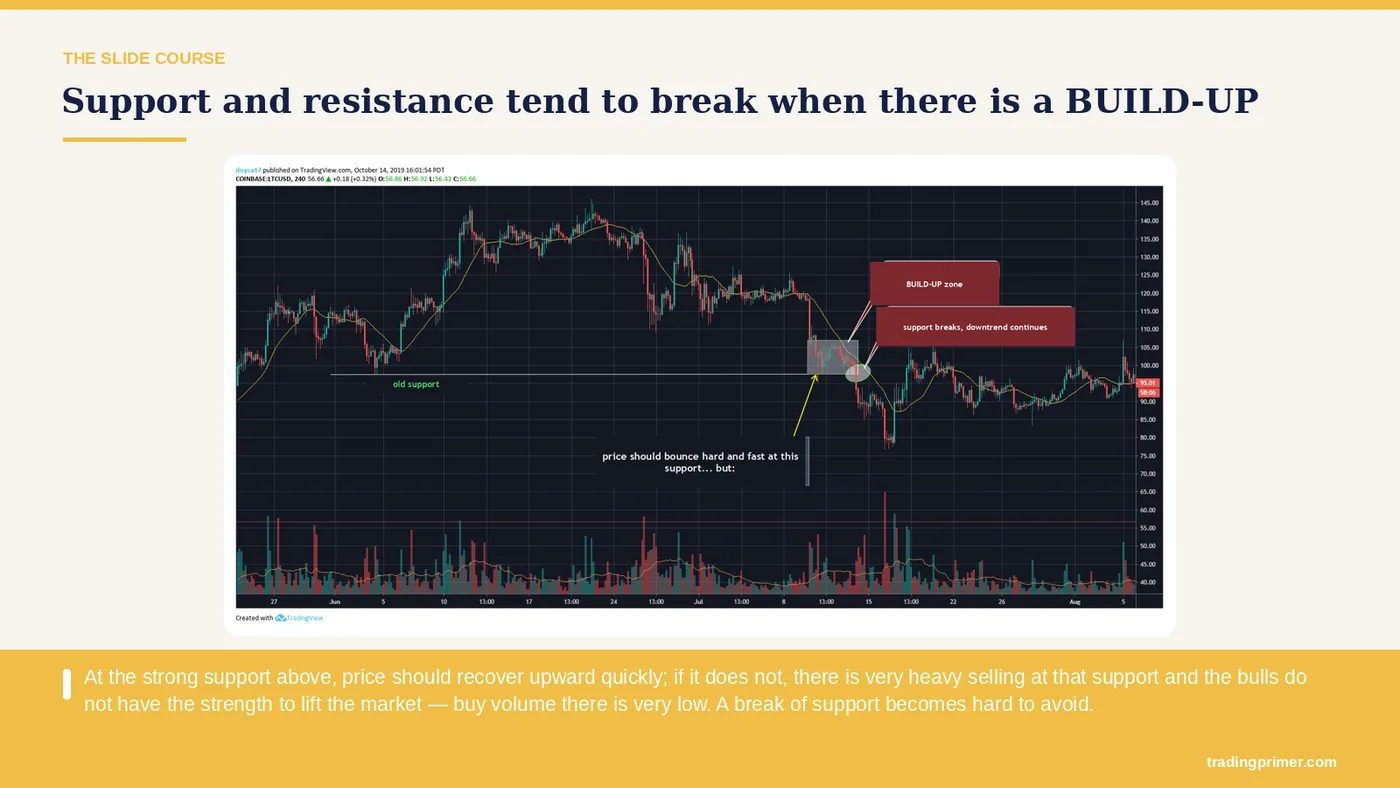
Support and resistance tend to break — when there is a BUILD-UP. At the strong support above, price should recover upward quickly; if it does not, there is very heavy selling at that support and the bulls do not have the strength to lift the market — buy volume there is very low. A break of support becomes hard to avoid.
Slide 18 of 25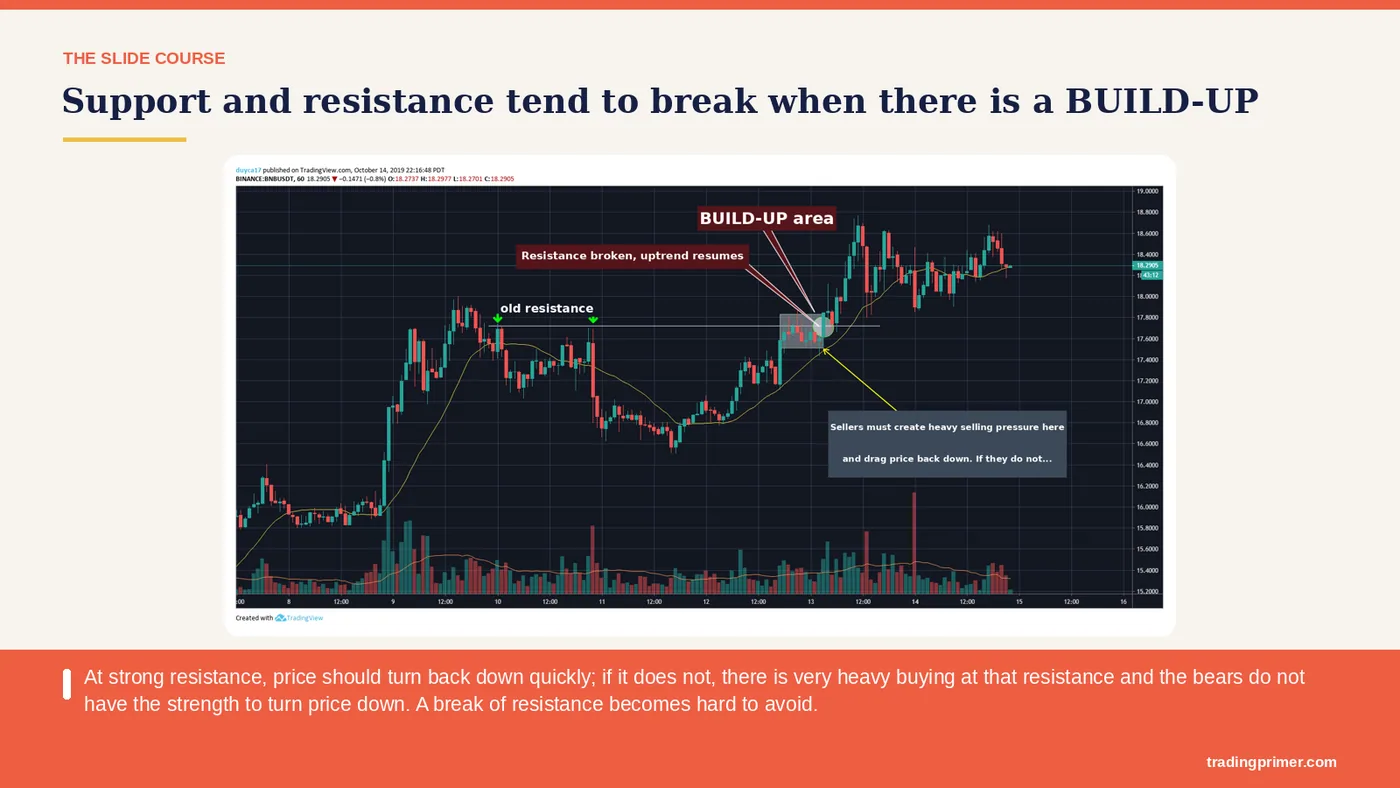
Support and resistance tend to break — when there is a BUILD-UP. At strong resistance, price should turn back down quickly; if it does not, there is very heavy buying at that resistance and the bears do not have the strength to turn price down. A break of resistance becomes hard to avoid.
Slide 19 of 25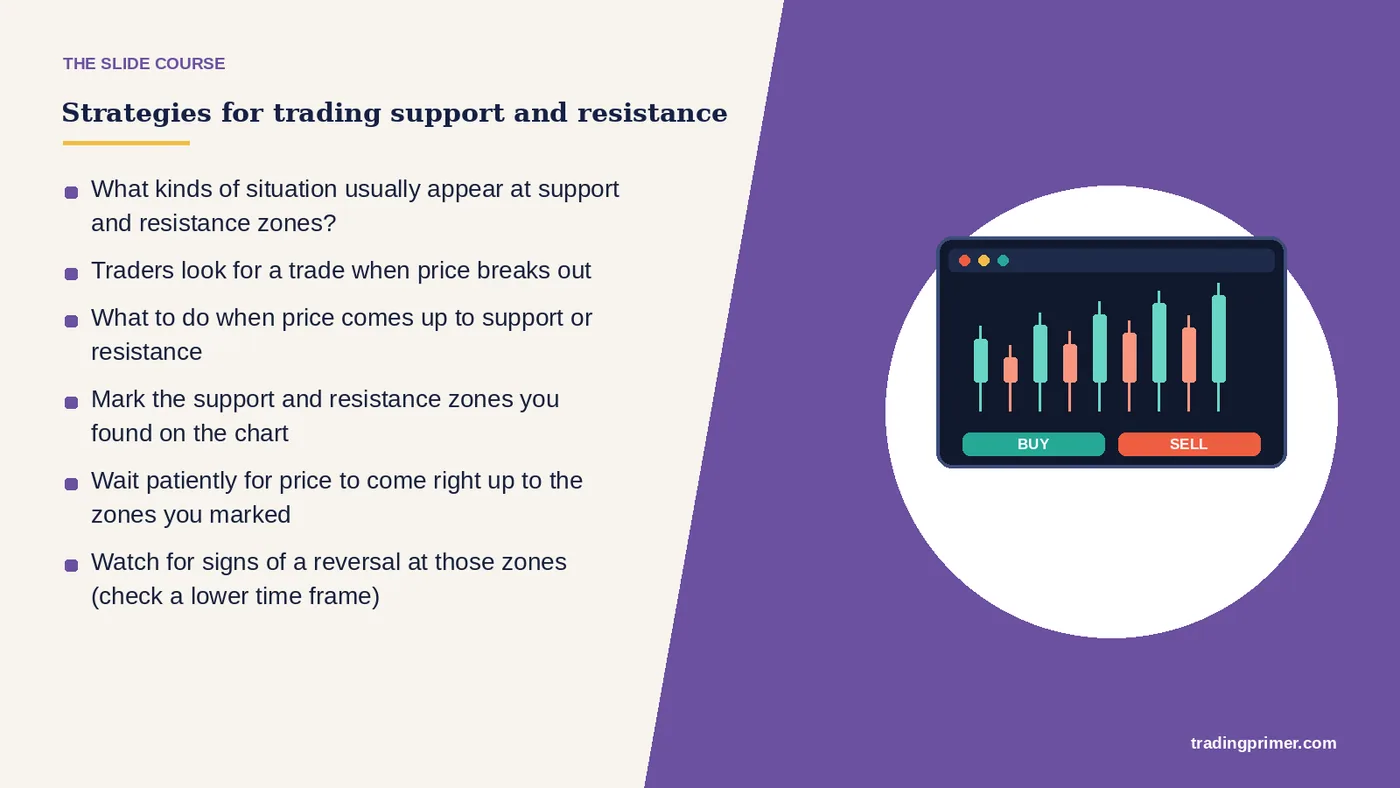
Strategies for trading — support and resistance. What kinds of situation usually appear at support and resistance zones? Traders look for a trade when price breaks out. What to do when price comes up to support or resistance. Mark the support and resistance zones you found on the chart. Wait patiently for price to come right up to the zones you marked. Watch for signs of a reversal at those zones (check a lower time frame). Enter on the second or third candle after the one rejected by the zone. Put the stop above or below the zone and set the target at the opposite zone.
Slide 20 of 25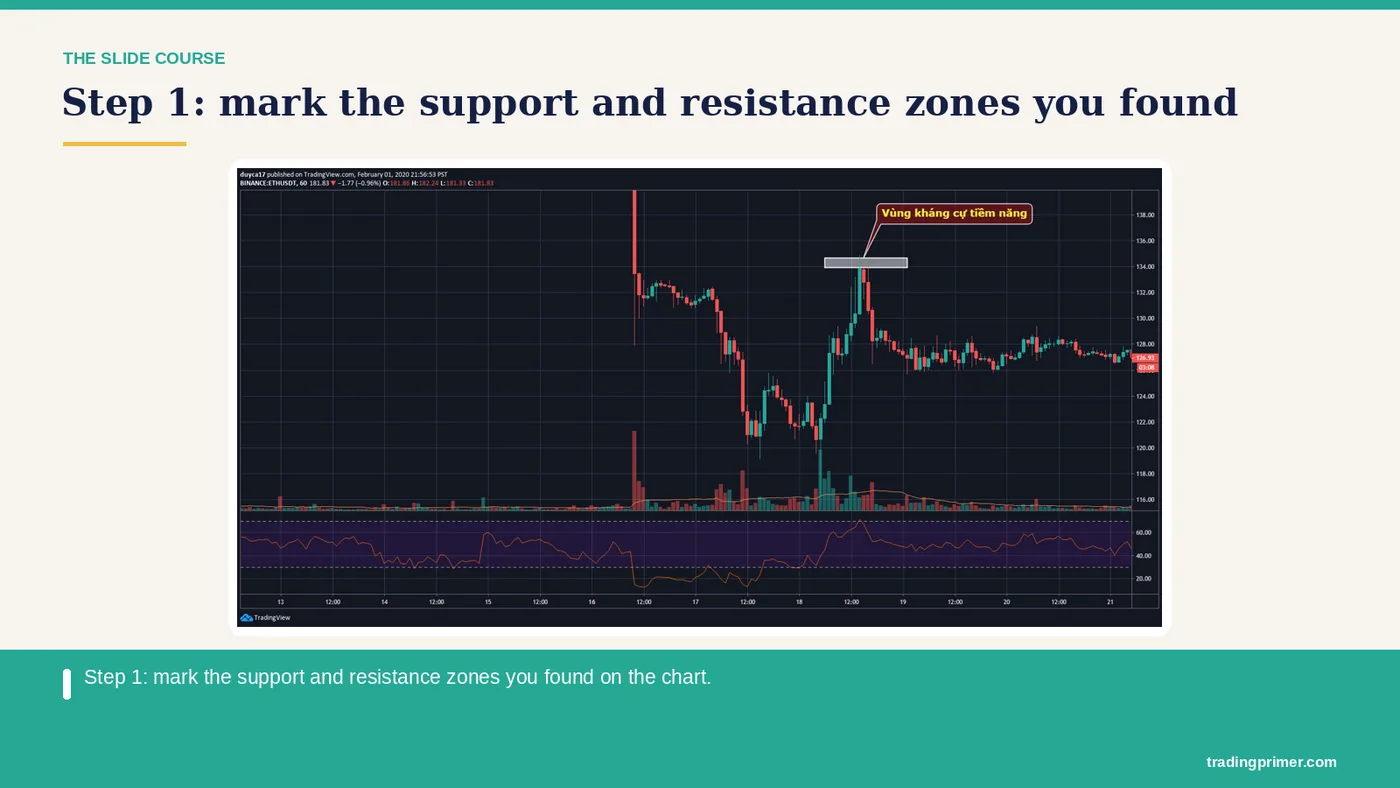
Step 1: mark the support and resistance zones you found on the chart — The chart carries the detail; the markings on it are what the course is teaching here.
Slide 21 of 25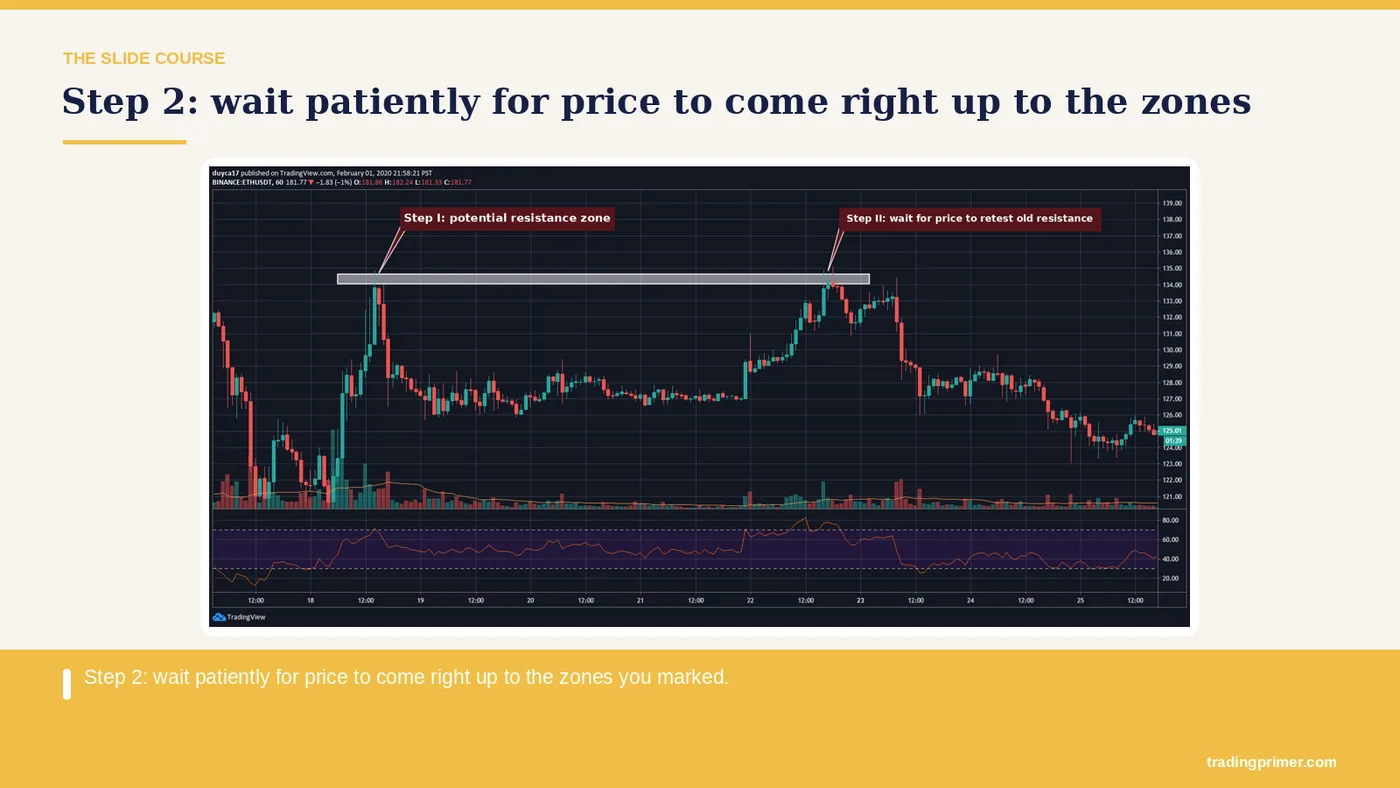
Step 2: wait patiently for price to come right up to the zones you marked — The chart carries the detail; the markings on it are what the course is teaching here.
Slide 22 of 25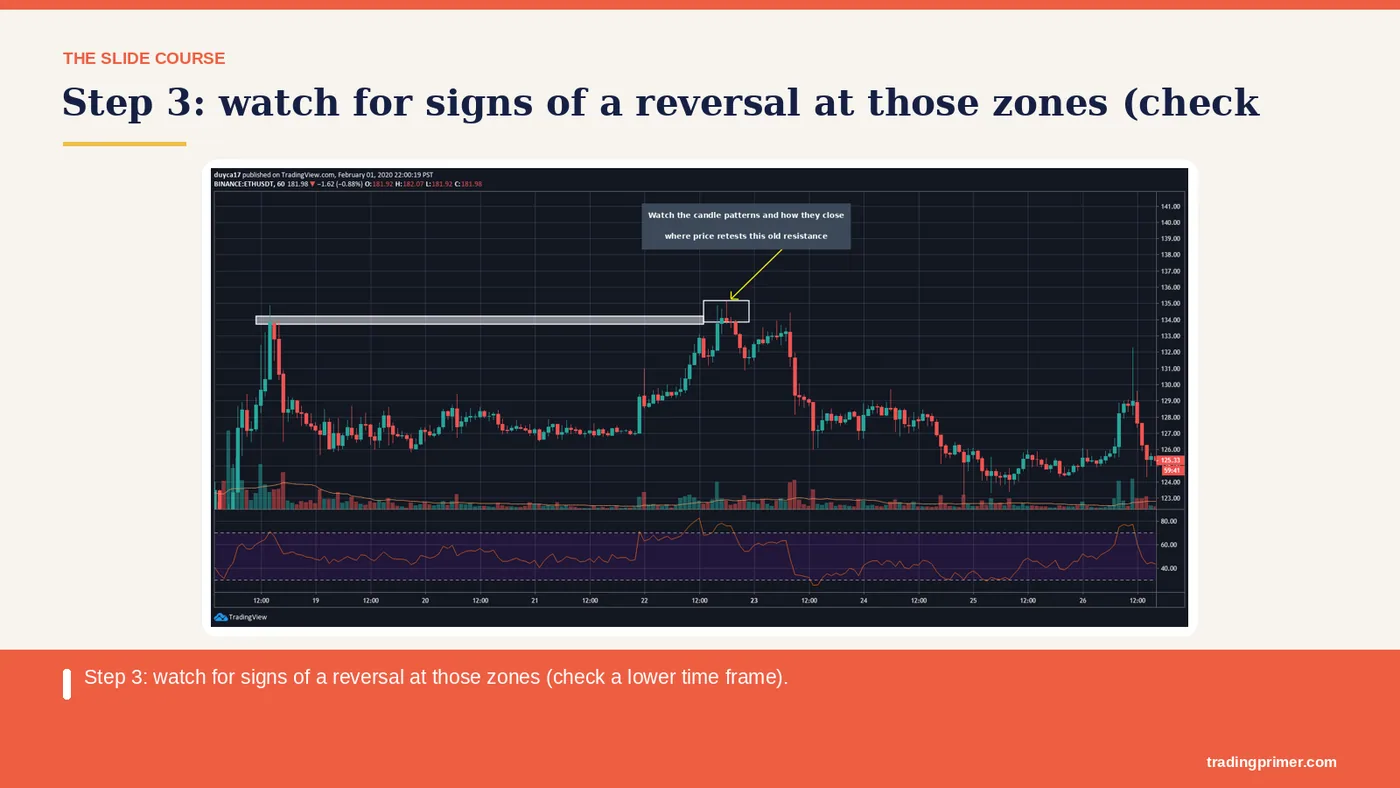
Step 3: watch for signs of a reversal at those zones (check a lower time frame) — The chart carries the detail; the markings on it are what the course is teaching here.
Slide 23 of 25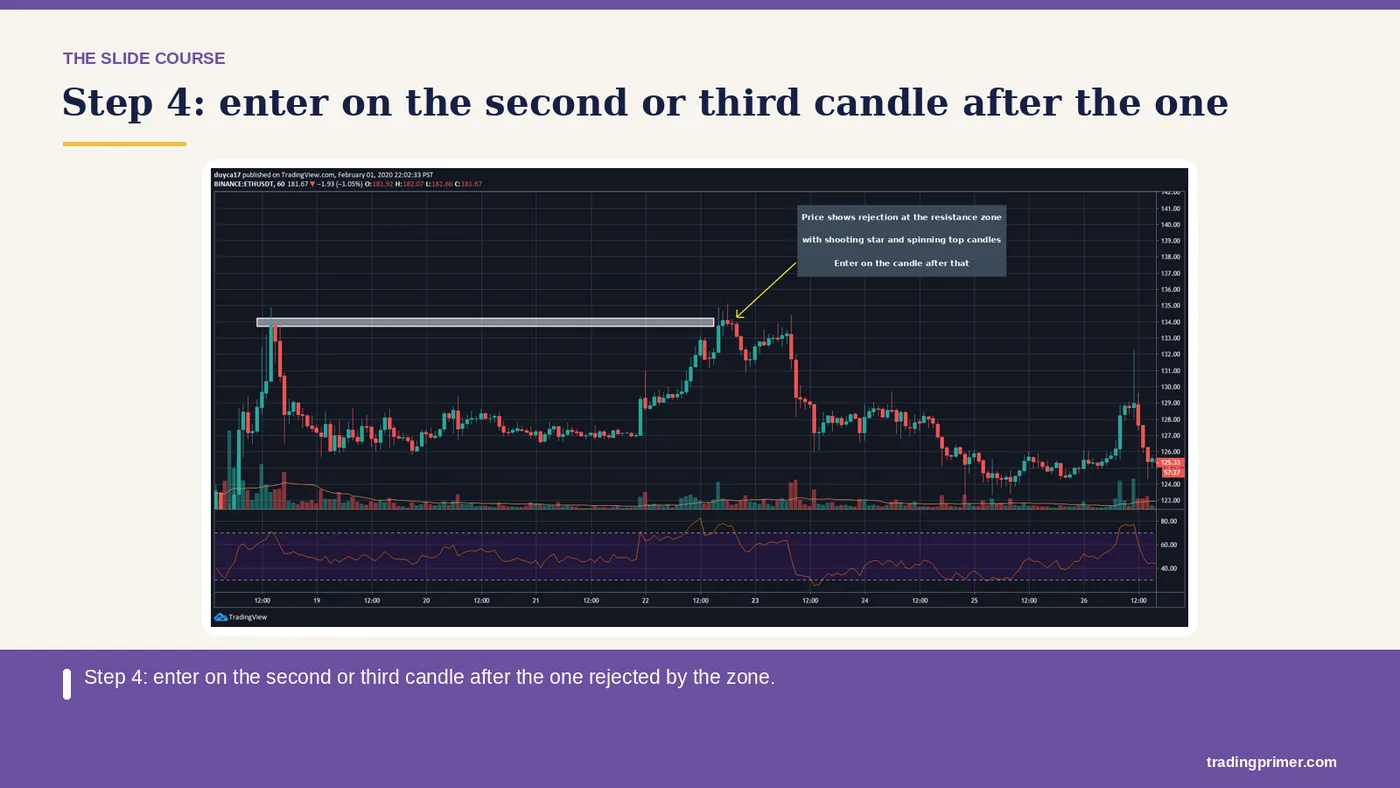
Step 4: enter on the second or third candle after the one rejected by the zone — The chart carries the detail; the markings on it are what the course is teaching here.
Slide 24 of 25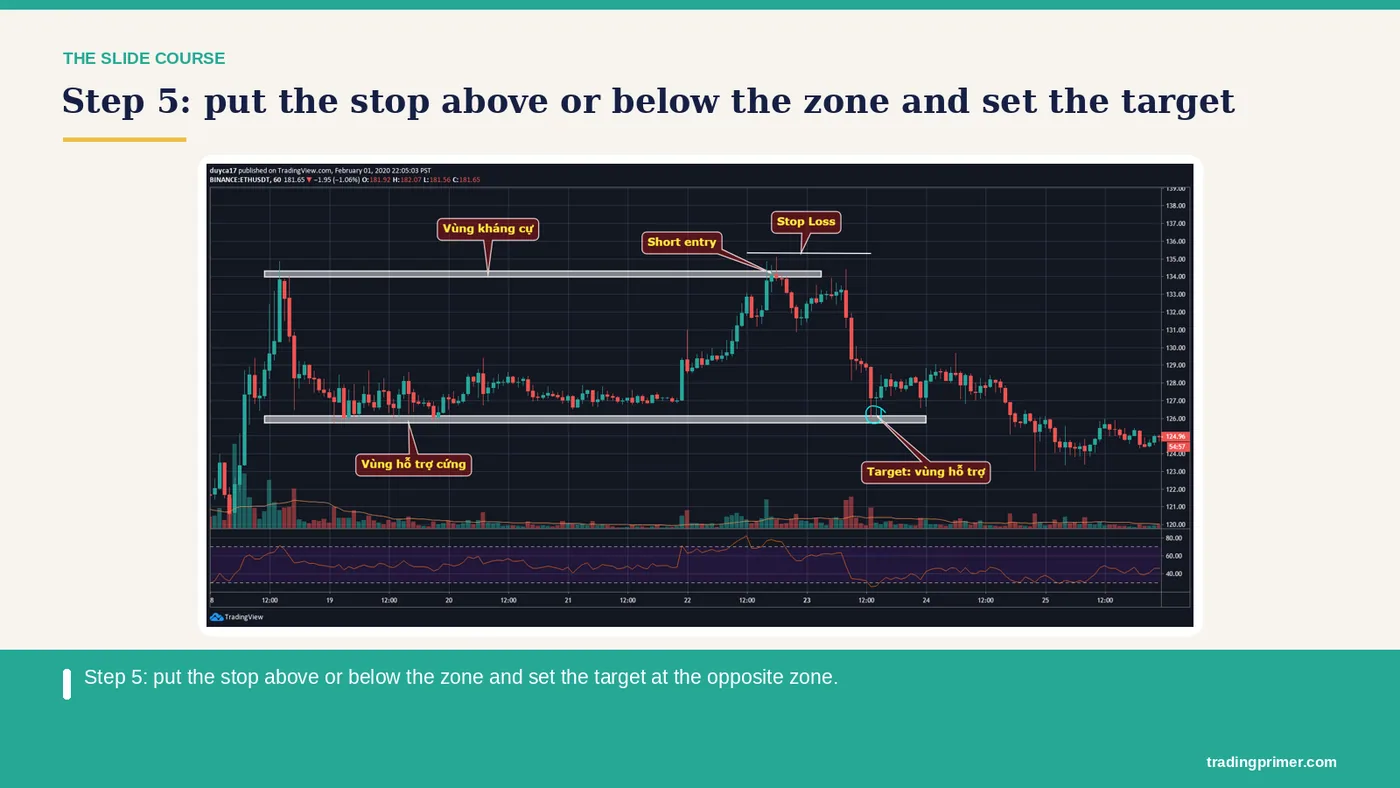
Step 5: put the stop above or below the zone and set the — target at the opposite zone.
Slide 25 of 25What this part covers
18 topics, in order. Each link jumps straight to that slide.
Prefer it as a PDF?
The same ten parts, downloadable, to keep next to your charts.